

Linear least squares
Encyclopedia
Statistics
Statistics is the study of the collection, organization, analysis, and interpretation of data. It deals with all aspects of this, including the planning of data collection in terms of the design of surveys and experiments....
and mathematics
Mathematics
Mathematics is the study of quantity, space, structure, and change. Mathematicians seek out patterns and formulate new conjectures. Mathematicians resolve the truth or falsity of conjectures by mathematical proofs, which are arguments sufficient to convince other mathematicians of their validity...
, linear least squares is an approach to fitting a mathematical
Mathematical model
A mathematical model is a description of a system using mathematical concepts and language. The process of developing a mathematical model is termed mathematical modeling. Mathematical models are used not only in the natural sciences and engineering disciplines A mathematical model is a...
or statistical model
Statistical model
A statistical model is a formalization of relationships between variables in the form of mathematical equations. A statistical model describes how one or more random variables are related to one or more random variables. The model is statistical as the variables are not deterministically but...
to data
Data
The term data refers to qualitative or quantitative attributes of a variable or set of variables. Data are typically the results of measurements and can be the basis of graphs, images, or observations of a set of variables. Data are often viewed as the lowest level of abstraction from which...
in cases where the idealized value provided by the model for any data point is expressed linearly in terms of the unknown parameter
Parameter
Parameter from Ancient Greek παρά also “para” meaning “beside, subsidiary” and μέτρον also “metron” meaning “measure”, can be interpreted in mathematics, logic, linguistics, environmental science and other disciplines....
s of the model. The resulting fitted model can be used to summarize
Descriptive statistics
Descriptive statistics quantitatively describe the main features of a collection of data. Descriptive statistics are distinguished from inferential statistics , in that descriptive statistics aim to summarize a data set, rather than use the data to learn about the population that the data are...
the data, to predict
Prediction
A prediction or forecast is a statement about the way things will happen in the future, often but not always based on experience or knowledge...
unobserved values from the same system, and to understand the mechanisms that may underlie the system.
Mathematically, linear least squares is the problem of approximately solving an overdetermined system
Overdetermined system
In mathematics, a system of linear equations is considered overdetermined if there are more equations than unknowns. The terminology can be described in terms of the concept of counting constraints. Each unknown can be seen as an available degree of freedom...
of linear equations, where the best approximation is defined as that which minimizes the sum of squared differences between the data values and their corresponding modeled values. The approach is called "linear" least squares since the solution depends linearly on the data. Linear least squares problems are convex
Convex function
In mathematics, a real-valued function f defined on an interval is called convex if the graph of the function lies below the line segment joining any two points of the graph. Equivalently, a function is convex if its epigraph is a convex set...
and have a closed-form solution
Closed-form expression
In mathematics, an expression is said to be a closed-form expression if it can be expressed analytically in terms of a bounded number of certain "well-known" functions...
that is unique, provided that the number of data-points used for fitting equals or exceeds the number of unknown parameters, except in special degenerate situations. In contrast, non-linear least squares
Non-linear least squares
Non-linear least squares is the form of least squares analysis which is used to fit a set of m observations with a model that is non-linear in n unknown parameters . It is used in some forms of non-linear regression. The basis of the method is to approximate the model by a linear one and to...
problems generally must be solved by an iterative procedure
Iterative method
In computational mathematics, an iterative method is a mathematical procedure that generates a sequence of improving approximate solutions for a class of problems. A specific implementation of an iterative method, including the termination criteria, is an algorithm of the iterative method...
, and the problems can be non-convex with multiple optima for the objective function.
In statistics, linear least squares problems correspond to a particularly important type of statistical model
Statistical model
A statistical model is a formalization of relationships between variables in the form of mathematical equations. A statistical model describes how one or more random variables are related to one or more random variables. The model is statistical as the variables are not deterministically but...
called linear regression
Linear regression
In statistics, linear regression is an approach to modeling the relationship between a scalar variable y and one or more explanatory variables denoted X. The case of one explanatory variable is called simple regression...
which arises as a particular form of regression analysis
Regression analysis
In statistics, regression analysis includes many techniques for modeling and analyzing several variables, when the focus is on the relationship between a dependent variable and one or more independent variables...
. One basic form of such a model is an ordinary least squares
Ordinary least squares
In statistics, ordinary least squares or linear least squares is a method for estimating the unknown parameters in a linear regression model. This method minimizes the sum of squared vertical distances between the observed responses in the dataset and the responses predicted by the linear...
model. The present article concentrates on the mathematical aspects of linear least squares problems, with discussion of the formulation and interpretation of statistical regression models, and of statistical inference
Statistical inference
In statistics, statistical inference is the process of drawing conclusions from data that are subject to random variation, for example, observational errors or sampling variation...
s related to these are dealt with in the articles just mentioned. See outline of regression analysis
Outline of regression analysis
In statistics, regression analysis includes any technique for learning about the relationship between one or more dependent variables Y and one or more independent variables X....
for an outline of the topic.
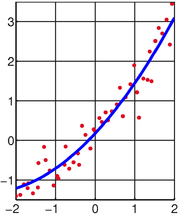
Motivational example
As a result of an experiment, four data points were obtained,

 and
and  (shown in red in the picture on the right). It is desired to find a line
  that fits "best" these four points. In other words, we would like to find the numbers
  and
and  that approximately solve the overdetermined linear system
of four equations in two unknowns in some "best" sense.
The least squares
Least squares
The method of least squares is a standard approach to the approximate solution of overdetermined systems, i.e., sets of equations in which there are more equations than unknowns. "Least squares" means that the overall solution minimizes the sum of the squares of the errors made in solving every...
approach to solving this problem is to try to make as small as possible the sum of squares of "errors" between the right- and left-hand sides of these equations, that is, to find the minimum
Maxima and minima
In mathematics, the maximum and minimum of a function, known collectively as extrema , are the largest and smallest value that the function takes at a point either within a given neighborhood or on the function domain in its entirety .More generally, the...
of the function
-

The minimum is determined by calculating the partial derivativePartial derivativeIn mathematics, a partial derivative of a function of several variables is its derivative with respect to one of those variables, with the others held constant...
s of with respect to
  and
and  and setting them to zero. This results in a system of two equations in two unknowns, called the normal equations, which give, when solved


and the equation of the line of best fit. The residuals, that is, the discrepancies between the
  values from the experiment and the
  values calculated using the line of best fit are then found to be

 and
and  (see the picture on the right). The minimum value of the sum of squares is
The general problem
Consider an overdetermined systemOverdetermined systemIn mathematics, a system of linear equations is considered overdetermined if there are more equations than unknowns. The terminology can be described in terms of the concept of counting constraints. Each unknown can be seen as an available degree of freedom...

of m linear equationLinear equationA linear equation is an algebraic equation in which each term is either a constant or the product of a constant and a single variable....
s in n unknown coefficients, β1,β2,…,βn, with m > n. This can be written in matrixMatrix (mathematics)In mathematics, a matrix is a rectangular array of numbers, symbols, or expressions. The individual items in a matrix are called its elements or entries. An example of a matrix with six elements isMatrices of the same size can be added or subtracted element by element...
form as

where

Such a system usually has no solution, so the goal is instead to find the coefficients β which fit the equations "best," in the sense of solving the quadraticQuadraticIn mathematics, the term quadratic describes something that pertains to squares, to the operation of squaring, to terms of the second degree, or equations or formulas that involve such terms...
minimization problem

where the objective function S is given by

A justification for choosing this criterion is given in properties below. This minimization problem has a unique solution, provided that the n columns of the matrix X are linearly independent, given by solving the normal equations

Derivation of the normal equations
Define the th residual to be
 .
.
Then can be rewritten

S is minimizedMaxima and minimaIn mathematics, the maximum and minimum of a function, known collectively as extrema , are the largest and smallest value that the function takes at a point either within a given neighborhood or on the function domain in its entirety .More generally, the...
when its gradient vector is zero. (This follows by definition: if the gradient vector is not zero, there is a direction in which we can move to minimize it further - see maxima and minimaMaxima and minimaIn mathematics, the maximum and minimum of a function, known collectively as extrema , are the largest and smallest value that the function takes at a point either within a given neighborhood or on the function domain in its entirety .More generally, the...
.) The elements of the gradient vector are the partial derivatives of S with respect to the parameters:

The derivatives are

Substitution of the expressions for the residuals and the derivatives into the gradient equations gives

Thus if minimizes S, we have

Upon rearrangement, we obtain the normal equations:

The normal equations are written in matrix notation as
 (where XT is the matrix transpose of X)
The solution of the normal equations yields the vector of the optimal parameter values.
Computation
A general approach to the least squares problem can be described as follows. Suppose that we can find a n by m matrix S
such that XS is an
orthogonal projection onto the image of X. Then a solution to our minimization problem is given by

simply because

is exactly a sought for orthogonal projection of onto an image of X
(see the picture below and note that as explained in the
next section the image of X is just a subspace generated by column vectors of X).
A few popular ways to find such a matrix S are described below.
Inverting the matrix of the normal equations
The algebraic solution of the normal equations can be written as

where X+ is the Moore–Penrose pseudoinverse of X. Although this equation is correct, and can work in many applications, it is not computationally efficient to invert the normal equations matrix. An exception occurs in numerical smoothing and differentiationNumerical smoothing and differentiationAn experimental datum value can be conceptually described as the sum of a signal and some noise, but in practice the two contributions cannot be separated. The purpose of smoothing is to increase the Signal-to-noise ratio without greatly distorting the signal...
where an analytical expression is required.
If the matrix XTX is well-conditionedCondition numberIn the field of numerical analysis, the condition number of a function with respect to an argument measures the asymptotically worst case of how much the function can change in proportion to small changes in the argument...
and positive definitePositive-definite matrixIn linear algebra, a positive-definite matrix is a matrix that in many ways is analogous to a positive real number. The notion is closely related to a positive-definite symmetric bilinear form ....
, that is, it has full rankRank (linear algebra)The column rank of a matrix A is the maximum number of linearly independent column vectors of A. The row rank of a matrix A is the maximum number of linearly independent row vectors of A...
, the normal equations can be solved directly by using the Cholesky decompositionCholesky decompositionIn linear algebra, the Cholesky decomposition or Cholesky triangle is a decomposition of a Hermitian, positive-definite matrix into the product of a lower triangular matrix and its conjugate transpose. It was discovered by André-Louis Cholesky for real matrices...
RTR, where R is an upper triangular matrixTriangular matrixIn the mathematical discipline of linear algebra, a triangular matrix is a special kind of square matrix where either all the entries below or all the entries above the main diagonal are zero...
, giving:
The solution is obtained in two stages, a forward substitution step, solving for z:
followed by a backward substitution, solving for
Both substitutions are facilitated by the triangular nature of R.
See example of linear regression for a worked-out numerical example with three parameters.
Orthogonal decomposition methods
Orthogonal decomposition methods of solving the least squares problem are slower than the normal equations method but are more numerically stableNumerical stabilityIn the mathematical subfield of numerical analysis, numerical stability is a desirable property of numerical algorithms. The precise definition of stability depends on the context, but it is related to the accuracy of the algorithm....
, from not having to form the product XTX.
The residuals are written in matrix notation as

The matrix X is subjected to an orthogonal decomposition; the QR decompositionQR decompositionIn linear algebra, a QR decomposition of a matrix is a decomposition of a matrix A into a product A=QR of an orthogonal matrix Q and an upper triangular matrix R...
will serve to illustrate the process.
where Q is an m×m orthogonal matrixOrthogonal matrixIn linear algebra, an orthogonal matrix , is a square matrix with real entries whose columns and rows are orthogonal unit vectors ....
and R is an m×n matrix which is partitionedBlock matrixIn the mathematical discipline of matrix theory, a block matrix or a partitioned matrix is a matrix broken into sections called blocks. Looking at it another way, the matrix is written in terms of smaller matrices. We group the rows and columns into adjacent 'bunches'. A partition is the rectangle...
into a n×n upper triangularTriangular matrixIn the mathematical discipline of linear algebra, a triangular matrix is a special kind of square matrix where either all the entries below or all the entries above the main diagonal are zero...
block, Rn, and a (m − n)×n zero block 0.

The residual vector is left-multiplied by QT.

Because Q is orthogonalOrthogonal matrixIn linear algebra, an orthogonal matrix , is a square matrix with real entries whose columns and rows are orthogonal unit vectors ....
, the sum of squares of the residuals, s, may be written as:
Since v doesn't depend on β, the minimum value of s is attained when the upper block, u, is zero. Therefore the parameters are found by solving:
These equations are easily solved as Rn is upper triangular.
An alternative decomposition of X is the singular value decompositionSingular value decompositionIn linear algebra, the singular value decomposition is a factorization of a real or complex matrix, with many useful applications in signal processing and statistics....
(SVD)

where U is m by m orthogonal matrix, V is n by n orthogonal matrix and is an m by n matrix with all its elements outside of the main diagonal equal to 0. The (pseudo)-inverse of
  is easily obtained by inverting its non-zero diagonal elements. Hence,

where P is obtained from by replacing its non-zero diagonal elements with ones. Since X and
  are obviously of the same rank (one of the many advantages of singular value decompositionSingular value decompositionIn linear algebra, the singular value decomposition is a factorization of a real or complex matrix, with many useful applications in signal processing and statistics....
)

is an orthogonal projection onto the image (column-space) of X and in accordance with a general approach described in the introduction above,

is a solution of a least squares problem. This method is the most computationally intensive, but is particularly useful if the normal equations matrix, XTX, is very ill-conditioned (i.e. if its condition numberCondition numberIn the field of numerical analysis, the condition number of a function with respect to an argument measures the asymptotically worst case of how much the function can change in proportion to small changes in the argument...
multiplied by the machine's relative round-off errorRound-off errorA round-off error, also called rounding error, is the difference between the calculated approximation of a number and its exact mathematical value. Numerical analysis specifically tries to estimate this error when using approximation equations and/or algorithms, especially when using finitely many...
is appreciably large). In that case, including the smallest singular values in the inversion merely adds numerical noise to the solution. This can be cured using the truncated SVD approach, giving a more stable and exact answer, by explicitly setting to zero all singular values below a certain threshold and so ignoring them, a process closely related to factor analysisFactor analysisFactor analysis is a statistical method used to describe variability among observed, correlated variables in terms of a potentially lower number of unobserved, uncorrelated variables called factors. In other words, it is possible, for example, that variations in three or four observed variables...
.
Properties of the least-squares estimators
The gradient equations at the minimum can be written as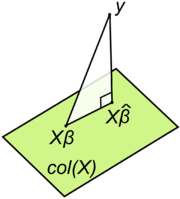

A geometrical interpretation of these equations is that the vector of residuals, is orthogonal to the column spaceColumn spaceIn linear algebra, the column space of a matrix is the set of all possible linear combinations of its column vectors. The column space of an m × n matrix is a subspace of m-dimensional Euclidean space...
of X, since the dot product is equal to zero for any conformal vector, v. This means that
  is the shortest of all possible vectors
  , that is, the variance of the residuals is the minimum possible. This is illustrated at the right.
Introducing and a matrix K with the assumption that a matrix
  is non-sigular and KT X = 0 (cf. Orthogonal projections), the residual vector should satisfy the following equation:
The equation and solution of linear least squares are thus described as follows:

If the experimental errors, , are uncorrelated, have a mean of zero and a constant variance,
  , the Gauss-Markov theorem states that the least-squares estimator,
  , has the minimum variance of all estimators that are linear combinations of the observations. In this sense it is the best, or optimal, estimator of the parameters. Note particularly that this property is independent of the statistical distribution functionDistribution functionIn molecular kinetic theory in physics, a particle's distribution function is a function of seven variables, f, which gives the number of particles per unit volume in phase space. It is the number of particles per unit volume having approximately the velocity near the place and time...
of the errors. In other words, the distribution function of the errors need not be a normal distribution. However, for some probability distributions, there is no guarantee that the least-squares solution is even possible given the observations; still, in such cases it is the best estimator that is both linear and unbiased.
For example, it is easy to show that the arithmetic meanArithmetic meanIn mathematics and statistics, the arithmetic mean, often referred to as simply the mean or average when the context is clear, is a method to derive the central tendency of a sample space...
of a set of measurements of a quantity is the least-squares estimator of the value of that quantity. If the conditions of the Gauss-Markov theorem apply, the arithmetic mean is optimal, whatever the distribution of errors of the measurements might be.
However, in the case that the experimental errors do belong to a normal distribution, the least-squares estimator is also a maximum likelihoodMaximum likelihoodIn statistics, maximum-likelihood estimation is a method of estimating the parameters of a statistical model. When applied to a data set and given a statistical model, maximum-likelihood estimation provides estimates for the model's parameters....
estimator.
These properties underpin the use of the method of least squares for all types of data fitting, even when the assumptions are not strictly valid.
Limitations
An assumption underlying the treatment given above is that the independent variable, x, is free of error. In practice, the errors on the measurements of the independent variable are usually much smaller than the errors on the dependent variable and can therefore be ignored. When this is not the case, total least squares also known as Errors-in-variables modelsErrors-in-variables modelsIn statistics and econometrics, errors-in-variables models or measurement errors models are regression models that account for measurement errors in the independent variables...
, or Rigorous least squares, should be used. This can be done by adjusting the weighting scheme to take into account errors on both the dependent and independent variables and then following the standard procedure.
In some cases the (weighted) normal equations matrix XTX is ill-conditioned. When fitting polynomials the normal equations matrix is a Vandermonde matrix. Vandermode matrices become increasingly ill-conditioned as the order of the matrix increases. In these cases, the least squares estimate amplifies the measurement noise and may be grossly inaccurate. Various regularizationRegularization (mathematics)In mathematics and statistics, particularly in the fields of machine learning and inverse problems, regularization involves introducing additional information in order to solve an ill-posed problem or to prevent overfitting...
techniques can be applied in such cases, the most common of which is called ridge regressionTikhonov regularizationTikhonov regularization, named for Andrey Tikhonov, is the most commonly used method of regularization of ill-posed problems. In statistics, the method is known as ridge regression, and, with multiple independent discoveries, it is also variously known as the Tikhonov-Miller method, the...
. If further information about the parameters is known, for example, a range of possible values of , then various techniques can be used to increase the stability of the solution. For example, see constrained least squares.
Another drawback of the least squares estimator is the fact that the norm of the residuals, is minimized, whereas in some cases one is truly interested in obtaining small error in the parameter
  , e.g., a small value of
  . However, since
  is unknown, this quantity cannot be directly minimized. If a prior probabilityPrior probabilityIn Bayesian statistical inference, a prior probability distribution, often called simply the prior, of an uncertain quantity p is the probability distribution that would express one's uncertainty about p before the "data"...
on is known, then a Bayes estimatorBayes estimatorIn estimation theory and decision theory, a Bayes estimator or a Bayes action is an estimator or decision rule that minimizes the posterior expected value of a loss function . Equivalently, it maximizes the posterior expectation of a utility function...
can be used to minimize the mean squared errorMean squared errorIn statistics, the mean squared error of an estimator is one of many ways to quantify the difference between values implied by a kernel density estimator and the true values of the quantity being estimated. MSE is a risk function, corresponding to the expected value of the squared error loss or...
, . The least squares method is often applied when no prior is known. Surprisingly, when several parameters are being estimated jointly, better estimators can be constructed, an effect known as Stein's phenomenon. For example, if the measurement error is Gaussian, several estimators are known which dominateDominating decision ruleIn decision theory, a decision rule is said to dominate another if the performance of the former is sometimes better, and never worse, than that of the latter....
, or outperform, the least squares technique; the best known of these is the James–Stein estimator. This is an example of more general shrinkage estimatorShrinkage estimatorIn statistics, a shrinkage estimator is an estimator that, either explicitly or implicitly, incorporates the effects of shrinkage. In loose terms this means that a naïve or raw estimate is improved by combining it with other information. The term relates to the notion that the improved estimate is...
s that have been applied to regression problems.
Weighted linear least squares
In some cases the observations may be weighted—for example, they may not be equally reliable. In this case, one can minimize the weighted sum of squares:

where wi > 0 is the weight of the ith observation, and W is the diagonal matrixDiagonal matrixIn linear algebra, a diagonal matrix is a matrix in which the entries outside the main diagonal are all zero. The diagonal entries themselves may or may not be zero...
of such weights.
The weights should, ideally, be equal to the reciprocalMultiplicative inverseIn mathematics, a multiplicative inverse or reciprocal for a number x, denoted by 1/x or x−1, is a number which when multiplied by x yields the multiplicative identity, 1. The multiplicative inverse of a fraction a/b is b/a. For the multiplicative inverse of a real number, divide 1 by the...
of the varianceVarianceIn probability theory and statistics, the variance is a measure of how far a set of numbers is spread out. It is one of several descriptors of a probability distribution, describing how far the numbers lie from the mean . In particular, the variance is one of the moments of a distribution...
of the measurement.
The normal equations are then:

This method is used in iteratively reweighted least squares.
Parameter errors, correlation and confidence limits
The estimated parameter values are linear combinations of the observed values

Therefore an expression for the residuals (i.e., the estimated errors in the observations) can be obtained by error propagation from the errors in the observations. Let the variance-covariance matrix for the observations be denoted by M and that of the parameters by Mβ. Then,

When W = M −1 this simplifies to

When unit weights are used (W = I) it is implied that the experimental errors are uncorrelated and all equal: M = σ2I, where σ2 is the variance of an observation, and I is the identity matrixIdentity matrixIn linear algebra, the identity matrix or unit matrix of size n is the n×n square matrix with ones on the main diagonal and zeros elsewhere. It is denoted by In, or simply by I if the size is immaterial or can be trivially determined by the context...
. In this case σ2 is approximated by , where S is the minimum value of the objective function

The denominator, m-n, is the statistical degrees of freedomDegrees of freedom (statistics)In statistics, the number of degrees of freedom is the number of values in the final calculation of a statistic that are free to vary.Estimates of statistical parameters can be based upon different amounts of information or data. The number of independent pieces of information that go into the...
; see effective degrees of freedom for generalizations for the case of correlated observations. In all cases, the varianceVarianceIn probability theory and statistics, the variance is a measure of how far a set of numbers is spread out. It is one of several descriptors of a probability distribution, describing how far the numbers lie from the mean . In particular, the variance is one of the moments of a distribution...
of the parameter is given by
  and the covarianceCovarianceIn probability theory and statistics, covariance is a measure of how much two variables change together. Variance is a special case of the covariance when the two variables are identical.- Definition :...
between parameters and
and  is given by
  . Standard deviationStandard deviationStandard deviation is a widely used measure of variability or diversity used in statistics and probability theory. It shows how much variation or "dispersion" there is from the average...
is the square root of variance and the correlation coefficient is given by . These error estimates reflect only random errors in the measurements. The true uncertainty in the parameters is larger due to the presence of systematic errors which, by definition, cannot be quantified.
Note that even though the observations may be un-correlated, the parameters are always correlatedPearson product-moment correlation coefficientIn statistics, the Pearson product-moment correlation coefficient is a measure of the correlation between two variables X and Y, giving a value between +1 and −1 inclusive...
.
It is often assumed, for want of any concrete evidence, that the error on an observation belongs to a normal distribution with a mean of zero and standard deviation . Under that assumption the following probabilities can be derived.
- 68% within the interval

- 95% within the interval

- 99% within the interval

The assumption is not unreasonable when m >> n. If the experimental errors are normally distributed the parameters will belong to a Student's t-distribution with m − n degrees of freedomDegrees of freedom (statistics)In statistics, the number of degrees of freedom is the number of values in the final calculation of a statistic that are free to vary.Estimates of statistical parameters can be based upon different amounts of information or data. The number of independent pieces of information that go into the...
. When m >> n Student's t-distribution approximates to a Normal distribution. Note, however, that these confidence limits cannot take systematic error into account. Also, parameter errors should be quoted to one significant figure only, as they are subject to sampling errorSampling error-Random sampling:In statistics, sampling error or estimation error is the error caused by observing a sample instead of the whole population. The sampling error can be found by subtracting the value of a parameter from the value of a statistic...
.
When the number of observations is relatively small, Chebychev's inequality can be used for an upper bound on probabilities, regardless of any assumptions about the distribution of experimental errors: the maximum probabilities that a parameter will be more than 1, 2 or 3 standard deviations away from its expectation value are 100%, 25% and 11% respectively.
Residual values and correlation
The residualsErrors and residuals in statisticsIn statistics and optimization, statistical errors and residuals are two closely related and easily confused measures of the deviation of a sample from its "theoretical value"...
are related to the observations by

where H is the symmetric, idempotent matrixIdempotent matrixIn algebra, an idempotent matrix is a matrix which, when multiplied by itself, yields itself. That is, the matrix M is idempotent if and only if MM = M...
known as the hat matrixHat matrixIn statistics, the hat matrix, H, maps the vector of observed values to the vector of fitted values. It describes the influence each observed value has on each fitted value...
:

and I is the identity matrixIdentity matrixIn linear algebra, the identity matrix or unit matrix of size n is the n×n square matrix with ones on the main diagonal and zeros elsewhere. It is denoted by In, or simply by I if the size is immaterial or can be trivially determined by the context...
. The variance-covariance matrice of the residuals, Mr is given by

Thus the residuals are correlated, even if the observations are not.
When ,
,
The sum of residual values is equal to zero whenever the model function contains a constant term. Left-multiply the expression for the residuals by XT:

Say, for example, that the first term of the model is a constant, so that for all i. In that case it follows that

Thus, in the motivational example, above, the fact that the sum of residual values is equal to zero it is not accidental but is a consequence of the presence of the constant term, α, in the model.
If experimental error follows a normal distribution, then, because of the linear relationship between residuals and observations, so should residuals, but since the observations are only a sample of the population of all possible observations, the residuals should belong to a Student's t-distribution. Studentized residualStudentized residualIn statistics, a studentized residual is the quotient resulting from the division of a residual by an estimate of its standard deviation. Typically the standard deviations of residuals in a sample vary greatly from one data point to another even when the errors all have the same standard...
s are useful in making a statistical test for an outlierOutlierIn statistics, an outlier is an observation that is numerically distant from the rest of the data. Grubbs defined an outlier as: An outlying observation, or outlier, is one that appears to deviate markedly from other members of the sample in which it occurs....
when a particular residual appears to be excessively large.
Objective function
The objective function can be written as

since (I – H) is also symmetric and idempotent. It can be shown from this, that the expected valueExpected valueIn probability theory, the expected value of a random variable is the weighted average of all possible values that this random variable can take on...
of S is m-n. Note, however, that this is true only if the weights have been assigned correctly. If unit weights are assumed, the expected value of S is , where
  is the variance of an observation.
If it is assumed that the residuals belong to a Normal distribution, the objective function, being a sum of weighted squared residuals, will belong to a Chi-squared ( ) distribution with m-n degrees of freedomDegrees of freedom (statistics)In statistics, the number of degrees of freedom is the number of values in the final calculation of a statistic that are free to vary.Estimates of statistical parameters can be based upon different amounts of information or data. The number of independent pieces of information that go into the...
. Some illustrative percentile values of are given in the following table.
m-n 


10 9.34 18.3 23.2 25 24.3 37.7 44.3 100 99.3 124 136
These values can be used for a statistical criterion as to the goodness-of-fit. When unit weights are used, the numbers should be divided by the variance of an observation.
Constrained linear least squares
Often it is of interest to solve a linear least squares problem with an additional constraint on the solution. With constrained linear least squares, the original equation

must be satisfied (in the least squares sense) while also ensuring that some other property of is maintained. There are often special purpose algorithms for solving such problems efficiently. Some examples of constraints are given below:
- Equality constrainedConstrained generalized inverseA constrained generalized inverse inverse is obtained by solving a system of linear equations with an additional constraint that the solution is in a given subspace...
least squares: the elements of must exactly satisfy
- RegularizedTikhonov regularizationTikhonov regularization, named for Andrey Tikhonov, is the most commonly used method of regularization of ill-posed problems. In statistics, the method is known as ridge regression, and, with multiple independent discoveries, it is also variously known as the Tikhonov-Miller method, the...
least squares: the elements of must satisfy
- Non-negative least squares (NNLS): The vector
 satisfies the vector inequalityOrdered vector spaceIn mathematics an ordered vector space or partially ordered vector space is a vector space equipped with a partial order which is compatible with the vector space operations.- Definition:...
 that is defined componentwise --- that is, each component must be either positive or zero.
 - Box-constrained least squares: The vector
 satisfies the vector inequalitiesOrdered vector spaceIn mathematics an ordered vector space or partially ordered vector space is a vector space equipped with a partial order which is compatible with the vector space operations.- Definition:...
 , each of which is defined componentwise.
 - Integer constrained least squares: all elements of
 must be integerIntegerThe integers are formed by the natural numbers together with the negatives of the non-zero natural numbers .They are known as Positive and Negative Integers respectively...
(instead of real numberReal numberIn mathematics, a real number is a value that represents a quantity along a continuum, such as -5 , 4/3 , 8.6 , √2 and π...
s). - Real constrained least squares: all elements of
 must be real (rather than complex numberComplex numberA complex number is a number consisting of a real part and an imaginary part. Complex numbers extend the idea of the one-dimensional number line to the two-dimensional complex plane by using the number line for the real part and adding a vertical axis to plot the imaginary part...
s). - Phase constrained least squares: all elements of
 must have the same phaseArg (mathematics)In mathematics, arg is a function operating on complex numbers . It gives the angle between the line joining the point to the origin and the positive real axis, shown as in figure 1 opposite, known as an argument of the point In mathematics, arg is a function operating on complex numbers...
.
When the constraint only applies to some of the variables, the mixed problem may be solved using separable least squares by letting and
and  represent the unconstrained (1) and constrained (2) components. Then substituting the least squares solution for
  , i.e.

back into the original expression gives (following some rearrangement) an equation that can be solved as a purely constrained problem in .
.

where is a projection matrix. Following the constrained estimation of
  the vector
  is obtained from the expression above.
Typical uses and applications
- Polynomial fittingPolynomial regressionIn statistics, polynomial regression is a form of linear regression in which the relationship between the independent variable x and the dependent variable y is modeled as an nth order polynomial...
: models are polynomialPolynomialIn mathematics, a polynomial is an expression of finite length constructed from variables and constants, using only the operations of addition, subtraction, multiplication, and non-negative integer exponents...
s in an independent variable, x:- Straight line:
 .
. - Quadratic:
 .
. - Cubic, quartic and higher polynomials. For regression with high-order polynomialsPolynomial regressionIn statistics, polynomial regression is a form of linear regression in which the relationship between the independent variable x and the dependent variable y is modeled as an nth order polynomial...
, the use of orthogonal polynomialsOrthogonal polynomialsIn mathematics, the classical orthogonal polynomials are the most widely used orthogonal polynomials, and consist of the Hermite polynomials, the Laguerre polynomials, the Jacobi polynomials together with their special cases the ultraspherical polynomials, the Chebyshev polynomials, and the...
is recommended.
- Straight line:
- Numerical smoothing and differentiationNumerical smoothing and differentiationAn experimental datum value can be conceptually described as the sum of a signal and some noise, but in practice the two contributions cannot be separated. The purpose of smoothing is to increase the Signal-to-noise ratio without greatly distorting the signal...
— this is an application of polynomial fitting. - Multinomials in more than one independent variable, including surface fitting
- Curve fitting with B-splineB-splineIn the mathematical subfield of numerical analysis, a B-spline is a spline function that has minimal support with respect to a given degree, smoothness, and domain partition. B-splines were investigated as early as the nineteenth century by Nikolai Lobachevsky...
s - ChemometricsChemometricsChemometrics is the science of extracting information from chemical systems by data-driven means. It is a highly interfacial discipline, using methods frequently employed in core data-analytic disciplines such as multivariate statistics, applied mathematics, and computer science, in order to...
, Calibration curveCalibration curveIn analytical chemistry, a calibration curve is a general method for determining the concentration of a substance in an unknown sample by comparing the unknown to a set of standard samples of known concentration...
, Standard additionStandard AdditionThe method of standard addition is used in instrumental analysis to determine concentration of a substance in an unknown sample by comparison to a set of samples of known concentration, similar to using a calibration curve...
, Gran plotGran plotA Gran plot is a common means of standardizing a titrate or titrant by estimating the equivalence volume or end point in a strong acid-strong base titration or in a potentiometric titration...
, analysis of mixtures
Uses in data fitting
The primary application of linear least squares is in data fitting. Given a set of m data points consisting of experimentally measured values taken at m values
  of an independent variable (
 may be scalar or vector quantities), and given a model function
  with
with  it is desired to find the parameters
  such that the model function "best" fits the data. In linear least squares, linearity is meant to be with respect to parameters
  so
so

Here, the functions may be nonlinear with respect to the variable x.
Ideally, the model function fits the data exactly, so
for all This is usually not possible in practice, as there are more data points than there are parameters to be determined. The approach chosen then is to find the minimal possible value of the sum of squares of the residuals
so to minimize the function

After substituting for and then for
  , this minimization problem becomes the quadratic minimization problem above with

and the best fit can be found by solving the normal equations.
Further Discussion
The numerical methods for linear least squares are important because linear regressionLinear regressionIn statistics, linear regression is an approach to modeling the relationship between a scalar variable y and one or more explanatory variables denoted X. The case of one explanatory variable is called simple regression...
models are among the most important types of model, both as formal statistical modelStatistical modelA statistical model is a formalization of relationships between variables in the form of mathematical equations. A statistical model describes how one or more random variables are related to one or more random variables. The model is statistical as the variables are not deterministically but...
s and for exploration of data-sets. The majority of statistical computer packagesComparison of statistical packagesThe following tables compare general and technical information for a number of statistical analysis packages.-General information:Basic information about each product...
contain facilities for regression analysis that make use of linear least squares computations. Hence it is appropriate that considerable effort has been devoted to the task of ensuring that these computations are undertaken efficiently and with due regard to round-off errorRound-off errorA round-off error, also called rounding error, is the difference between the calculated approximation of a number and its exact mathematical value. Numerical analysis specifically tries to estimate this error when using approximation equations and/or algorithms, especially when using finitely many...
.
Individual statistical analyses are seldom undertaken in isolation, but rather are part of a sequence of investigatory steps. Some of the topics involved in considering numerical methods for linear least squares relate to this point. Thus important topics can be- Computations where a number of similar, and often nested, models are considered for the same data-set. That is, where models with the same dependent variable but different sets of independent variables are to be considered, for essentially the same set of data-points.
- Computations for analyses that occur in a sequence, as the number of data-points increases.
- Special considerations for very extensive data-sets.
Fitting of linear models by least squares often, but not always, arise in the context of statistical analysis. It can therefore be important that considerations of computation efficiency for such problems extend to all of the auxiliary quantities required for such analyses, and are not restricted to the formal solution of the linear least squares problem.
Rounding errors
Matrix calculations, like any other, are affected by rounding errors. An early summary of these effects, regarding the choice of computation methods for matrix inversion, was provided by Wilkinson.
External links
Theory
Online utilities -


