

Polynomial regression
Encyclopedia
In statistics
, polynomial regression is a form of linear regression
in which the relationship between the independent variable x and the dependent variable y is modeled as an nth order polynomial
. Polynomial regression fits a nonlinear relationship between the value of x and the corresponding conditional mean
of y, denoted E(y|x), and has been used to describe nonlinear phenomena such as the growth rate of tissues, the distribution of carbon isotopes in lake sediments, and the progression of disease epidemics. Although polynomial regression fits a nonlinear model to the data, as a statistical estimation
problem it is linear, in the sense that the regression function E(y|x) is linear in the unknown parameter
s that are estimated from the data
. For this reason, polynomial regression is considered to be a special case of multiple linear regression.
. The least-squares method minimizes the variance
of the unbiased
estimators
of the coefficients, under the conditions of the Gauss–Markov theorem. The least-squares method was published in 1805 by Legendre
and in 1809 by Gauss
. The first design
of an experiment
for polynomial regression appeared in an 1815 paper of Gergonne
. In the twentieth century, polynomial regression played an important role in the development of regression analysis
, with a greater emphasis on issues of design
and inference
. More recently, the use of polynomial models has been complemented by other methods, with non-polynomial models having advantages for some classes of problems.
is used, where ε is an unobserved random error with mean zero conditioned on a scalar
variable x. In this model, for each unit increase in the value of x, the conditional expectation of y increases by a1 units.
In many settings, such a linear relationship may not hold. For example, if we are modeling the yield of a chemical synthesis in terms of the temperature at which the synthesis takes place, we may find that the yield improves by increasing amounts for each unit increase in temperature. In this case, we might propose a quadratic model of the form
In this model, when the temperature is increased from x to x + 1 units, the expected yield changes by a1 + a2 + 2a2x. The fact that the change in yield depends on x is what makes the relationship nonlinear (this must not be confused with saying that this is nonlinear regression; on the contrary, this is still a case of linear regression).
In general, we can model the expected value of y as an nth order polynomial, yielding the general polynomial regression model

Conveniently, these models are all linear from the point of view of estimation
, since the regression function is linear in terms of the unknown parameters a0, a1, .... Therefore, for least squares
analysis, the computational and inferential problems of polynomial regression can be completely addressed using the techniques of multiple regression
. This is done by treating x, x2, ... as being distinct independent variables in a multiple regression model.

can be expressed in matrix form in terms of a design matrix , a response vector
  , a parameter vector
  , and a vector ε of random errors. The ith row of
  and
and 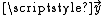 will contain the x and y value for the ith data sample. Then the model can be written as a system of linear equations:

which when using pure matrix notation is written as
The vector of estimated polynomial regression coefficients (using ordinary least squares
estimation
) is
This is the unique least squares solution as long as has linearly independent columns. Since
  is a Vandermonde matrix, this is guaranteed to hold provided that at least m + 1 of the xi are distinct (for which m < n is a necessary condition).
on the interval (0, 1). Although the correlation can be reduced by using orthogonal polynomials
, it is generally more informative to consider the fitted regression function as a whole. Point-wise or simultaneous confidence band
s can then be used to provide a sense of the uncertainty in the estimate of the regression function.
s, such as splines, radial basis function
s, and wavelet
s. These families of basis functions offer a more parsimonious fit for many types of data.
The goal of polynomial regression is to model a non-linear relationship between the independent and dependent variables (technically, between the independent variable and the conditional mean of the dependent variable). This is similar to the goal of nonparametric regression
, which aims to capture non-linear regression relationships. Therefore, non-parametric regression approaches such as smoothing
can be useful alternatives to polynomial regression. Some of these methods make use of a localized form of classical polynomial regression. An advantage of traditional polynomial regression is that the inferential framework of multiple regression can be used (this also holds when using other families of basis functions such as splines).
Statistics
Statistics is the study of the collection, organization, analysis, and interpretation of data. It deals with all aspects of this, including the planning of data collection in terms of the design of surveys and experiments....
, polynomial regression is a form of linear regression
Linear regression
In statistics, linear regression is an approach to modeling the relationship between a scalar variable y and one or more explanatory variables denoted X. The case of one explanatory variable is called simple regression...
in which the relationship between the independent variable x and the dependent variable y is modeled as an nth order polynomial
Polynomial
In mathematics, a polynomial is an expression of finite length constructed from variables and constants, using only the operations of addition, subtraction, multiplication, and non-negative integer exponents...
. Polynomial regression fits a nonlinear relationship between the value of x and the corresponding conditional mean
Conditional expectation
In probability theory, a conditional expectation is the expected value of a real random variable with respect to a conditional probability distribution....
of y, denoted E(y|x), and has been used to describe nonlinear phenomena such as the growth rate of tissues, the distribution of carbon isotopes in lake sediments, and the progression of disease epidemics. Although polynomial regression fits a nonlinear model to the data, as a statistical estimation
Estimation theory
Estimation theory is a branch of statistics and signal processing that deals with estimating the values of parameters based on measured/empirical data that has a random component. The parameters describe an underlying physical setting in such a way that their value affects the distribution of the...
problem it is linear, in the sense that the regression function E(y|x) is linear in the unknown parameter
Parameter
Parameter from Ancient Greek παρά also “para” meaning “beside, subsidiary” and μέτρον also “metron” meaning “measure”, can be interpreted in mathematics, logic, linguistics, environmental science and other disciplines....
s that are estimated from the data
Data
The term data refers to qualitative or quantitative attributes of a variable or set of variables. Data are typically the results of measurements and can be the basis of graphs, images, or observations of a set of variables. Data are often viewed as the lowest level of abstraction from which...
. For this reason, polynomial regression is considered to be a special case of multiple linear regression.
History
Polynomial regression models are usually fit using the method of least squaresLeast squares
The method of least squares is a standard approach to the approximate solution of overdetermined systems, i.e., sets of equations in which there are more equations than unknowns. "Least squares" means that the overall solution minimizes the sum of the squares of the errors made in solving every...
. The least-squares method minimizes the variance
Variance
In probability theory and statistics, the variance is a measure of how far a set of numbers is spread out. It is one of several descriptors of a probability distribution, describing how far the numbers lie from the mean . In particular, the variance is one of the moments of a distribution...
of the unbiased
Bias of an estimator
In statistics, bias of an estimator is the difference between this estimator's expected value and the true value of the parameter being estimated. An estimator or decision rule with zero bias is called unbiased. Otherwise the estimator is said to be biased.In ordinary English, the term bias is...
estimators
Estimation theory
Estimation theory is a branch of statistics and signal processing that deals with estimating the values of parameters based on measured/empirical data that has a random component. The parameters describe an underlying physical setting in such a way that their value affects the distribution of the...
of the coefficients, under the conditions of the Gauss–Markov theorem. The least-squares method was published in 1805 by Legendre
Adrien-Marie Legendre
Adrien-Marie Legendre was a French mathematician.The Moon crater Legendre is named after him.- Life :...
and in 1809 by Gauss
Gauss
Gauss may refer to:*Carl Friedrich Gauss, German mathematician and physicist*Gauss , a unit of magnetic flux density or magnetic induction*GAUSS , a software package*Gauss , a crater on the moon...
. The first design
Optimal design
Optimal designs are a class of experimental designs that are optimal with respect to some statistical criterion.In the design of experiments for estimating statistical models, optimal designs allow parameters to be estimated without bias and with minimum-variance...
of an experiment
Design of experiments
In general usage, design of experiments or experimental design is the design of any information-gathering exercises where variation is present, whether under the full control of the experimenter or not. However, in statistics, these terms are usually used for controlled experiments...
for polynomial regression appeared in an 1815 paper of Gergonne
Joseph Diaz Gergonne
Joseph Diaz Gergonne was a French mathematician and logician.-Life:In 1791, Gergonne enlisted in the French army as a captain. That army was undergoing rapid expansion because the French government feared a foreign invasion intended to undo the French Revolution and restore Louis XVI to full power...
. In the twentieth century, polynomial regression played an important role in the development of regression analysis
Regression analysis
In statistics, regression analysis includes many techniques for modeling and analyzing several variables, when the focus is on the relationship between a dependent variable and one or more independent variables...
, with a greater emphasis on issues of design
Design of experiments
In general usage, design of experiments or experimental design is the design of any information-gathering exercises where variation is present, whether under the full control of the experimenter or not. However, in statistics, these terms are usually used for controlled experiments...
and inference
Statistical inference
In statistics, statistical inference is the process of drawing conclusions from data that are subject to random variation, for example, observational errors or sampling variation...
. More recently, the use of polynomial models has been complemented by other methods, with non-polynomial models having advantages for some classes of problems.
Definition and example
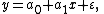
The goal of regression analysis is to model the expected value of a dependent variable y in terms of the value of an independent variable (or vector of independent variables) x. In simple linear regression, the modelis used, where ε is an unobserved random error with mean zero conditioned on a scalar
Scalar (mathematics)
In linear algebra, real numbers are called scalars and relate to vectors in a vector space through the operation of scalar multiplication, in which a vector can be multiplied by a number to produce another vector....
variable x. In this model, for each unit increase in the value of x, the conditional expectation of y increases by a1 units.
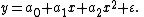
In many settings, such a linear relationship may not hold. For example, if we are modeling the yield of a chemical synthesis in terms of the temperature at which the synthesis takes place, we may find that the yield improves by increasing amounts for each unit increase in temperature. In this case, we might propose a quadratic model of the form
In this model, when the temperature is increased from x to x + 1 units, the expected yield changes by a1 + a2 + 2a2x. The fact that the change in yield depends on x is what makes the relationship nonlinear (this must not be confused with saying that this is nonlinear regression; on the contrary, this is still a case of linear regression).
In general, we can model the expected value of y as an nth order polynomial, yielding the general polynomial regression model
Conveniently, these models are all linear from the point of view of estimation
Estimation theory
Estimation theory is a branch of statistics and signal processing that deals with estimating the values of parameters based on measured/empirical data that has a random component. The parameters describe an underlying physical setting in such a way that their value affects the distribution of the...
, since the regression function is linear in terms of the unknown parameters a0, a1, .... Therefore, for least squares
Least squares
The method of least squares is a standard approach to the approximate solution of overdetermined systems, i.e., sets of equations in which there are more equations than unknowns. "Least squares" means that the overall solution minimizes the sum of the squares of the errors made in solving every...
analysis, the computational and inferential problems of polynomial regression can be completely addressed using the techniques of multiple regression
Linear regression
In statistics, linear regression is an approach to modeling the relationship between a scalar variable y and one or more explanatory variables denoted X. The case of one explanatory variable is called simple regression...
. This is done by treating x, x2, ... as being distinct independent variables in a multiple regression model.
Matrix form and calculation of estimates
The polynomial regression modelcan be expressed in matrix form in terms of a design matrix
, a response vector , a parameter vector , and a vector ε of random errors. The ith row of and will contain the x and y value for the ith data sample. Then the model can be written as a system of linear equations:which when using pure matrix notation is written as

The vector of estimated polynomial regression coefficients (using ordinary least squares
Ordinary least squares
In statistics, ordinary least squares or linear least squares is a method for estimating the unknown parameters in a linear regression model. This method minimizes the sum of squared vertical distances between the observed responses in the dataset and the responses predicted by the linear...
estimation
Estimation
Estimation is the calculated approximation of a result which is usable even if input data may be incomplete or uncertain.In statistics,*estimation theory and estimator, for topics involving inferences about probability distributions...
) is
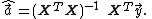
This is the unique least squares solution as long as
has linearly independent columns. Since is a Vandermonde matrix, this is guaranteed to hold provided that at least m + 1 of the xi are distinct (for which m < n is a necessary condition).Interpretation
Although polynomial regression is technically a special case of multiple linear regression, the interpretation of a fitted polynomial regression model requires a somewhat different perspective. It is often difficult to interpret the individual coefficients in a polynomial regression fit, since the underlying monomials can be highly correlated. For example, x and x2 have correlation around 0.97 when x is uniformly distributedUniform distribution (continuous)
In probability theory and statistics, the continuous uniform distribution or rectangular distribution is a family of probability distributions such that for each member of the family, all intervals of the same length on the distribution's support are equally probable. The support is defined by...
on the interval (0, 1). Although the correlation can be reduced by using orthogonal polynomials
Orthogonal polynomials
In mathematics, the classical orthogonal polynomials are the most widely used orthogonal polynomials, and consist of the Hermite polynomials, the Laguerre polynomials, the Jacobi polynomials together with their special cases the ultraspherical polynomials, the Chebyshev polynomials, and the...
, it is generally more informative to consider the fitted regression function as a whole. Point-wise or simultaneous confidence band
Confidence band
A confidence band is used in statistical analysis to represent the uncertainty in an estimate of a curve or function based on limited or noisy data. Confidence bands are often used as part of the graphical presentation of results in a statistical analysis...
s can then be used to provide a sense of the uncertainty in the estimate of the regression function.
Alternative approaches
Polynomial regression is one example of regression analysis using basis functions to model a functional relationship between two quantities. A drawback of polynomial bases is that the basis functions are "non-local", meaning that the fitted value of y at a given value x = x0 depends strongly on data values with x far from x0. In modern statistics, polynomial basis-functions are used along with new basis functionBasis function
In mathematics, a basis function is an element of a particular basis for a function space. Every continuous function in the function space can be represented as a linear combination of basis functions, just as every vector in a vector space can be represented as a linear combination of basis...
s, such as splines, radial basis function
Radial basis function
A radial basis function is a real-valued function whose value depends only on the distance from the origin, so that \phi = \phi; or alternatively on the distance from some other point c, called a center, so that \phi = \phi...
s, and wavelet
Wavelet
A wavelet is a wave-like oscillation with an amplitude that starts out at zero, increases, and then decreases back to zero. It can typically be visualized as a "brief oscillation" like one might see recorded by a seismograph or heart monitor. Generally, wavelets are purposefully crafted to have...
s. These families of basis functions offer a more parsimonious fit for many types of data.
The goal of polynomial regression is to model a non-linear relationship between the independent and dependent variables (technically, between the independent variable and the conditional mean of the dependent variable). This is similar to the goal of nonparametric regression
Nonparametric regression
Nonparametric regression is a form of regression analysis in which the predictor does not take a predetermined form but is constructed according to information derived from the data...
, which aims to capture non-linear regression relationships. Therefore, non-parametric regression approaches such as smoothing
Smoothing
In statistics and image processing, to smooth a data set is to create an approximating function that attempts to capture important patterns in the data, while leaving out noise or other fine-scale structures/rapid phenomena. Many different algorithms are used in smoothing...
can be useful alternatives to polynomial regression. Some of these methods make use of a localized form of classical polynomial regression. An advantage of traditional polynomial regression is that the inferential framework of multiple regression can be used (this also holds when using other families of basis functions such as splines).
See also
- Response surface methodologyResponse surface methodologyIn statistics, response surface methodology explores the relationships between several explanatory variables and one or more response variables. The method was introduced by G. E. P. Box and K. B. Wilson in 1951. The main idea of RSM is to use a sequence of designed experiments to obtain an...
- Polynomial and rational function modelingPolynomial and rational function modelingIn statistical modeling , polynomial functions and rational functions are sometimes used as an empirical technique for curve fitting.-Polynomial function models:A polynomial function is one that has the form...
- Polynomial interpolationPolynomial interpolationIn numerical analysis, polynomial interpolation is the interpolation of a given data set by a polynomial: given some points, find a polynomial which goes exactly through these points.- Applications :...