

Weather radar
Encyclopedia
Radar
Radar is an object-detection system which uses radio waves to determine the range, altitude, direction, or speed of objects. It can be used to detect aircraft, ships, spacecraft, guided missiles, motor vehicles, weather formations, and terrain. The radar dish or antenna transmits pulses of radio...
used to locate precipitation
Precipitation (meteorology)
In meteorology, precipitation In meteorology, precipitation In meteorology, precipitation (also known as one of the classes of hydrometeors, which are atmospheric water phenomena is any product of the condensation of atmospheric water vapor that falls under gravity. The main forms of precipitation...
, calculate its motion, estimate its type (rain
Rain
Rain is liquid precipitation, as opposed to non-liquid kinds of precipitation such as snow, hail and sleet. Rain requires the presence of a thick layer of the atmosphere to have temperatures above the melting point of water near and above the Earth's surface...
, snow
Snow
Snow is a form of precipitation within the Earth's atmosphere in the form of crystalline water ice, consisting of a multitude of snowflakes that fall from clouds. Since snow is composed of small ice particles, it is a granular material. It has an open and therefore soft structure, unless packed by...
, hail
Hail
Hail is a form of solid precipitation. It consists of balls or irregular lumps of ice, each of which is referred to as a hail stone. Hail stones on Earth consist mostly of water ice and measure between and in diameter, with the larger stones coming from severe thunderstorms...
, etc.). Modern weather radars are mostly pulse-Doppler radar
Pulse-doppler radar
Pulse-Doppler is a 4D radar system capable of detecting both target 3D location as well as measuring radial velocity . It uses the Doppler effect to avoid overloading computers and operators as well as to reduce power consumption...
s, capable of detecting the motion of rain droplets in addition to the intensity of the precipitation. Both types of data can be analyzed to determine the structure of storms and their potential to cause severe weather
Severe weather
Severe weather phenomena are weather conditions that are hazardous to human life and property.- Examples Include :Severe weather can occur under a variety of situations, but three characteristics are generally needed: a temperature or moisture boundary, moisture, and , instability in the...
.
During World War II, radar
Radar in World War II
Both the Allies and Axis powers used radar in World War II, and many important aspects of this conflict were greatly influenced by this revolutionarily new technology....
operators discovered that weather was causing echoes on their screen, masking potential enemy targets. Techniques were developed to filter them but scientists began to study the phenomenon. Soon after the war, surplus
Military surplus
Military surplus are goods, usually matériel, that are sold or otherwise disposed of when no longer needed by the military. Entrepreneurs often buy these goods and resell them at surplus stores. Military surplus rarely includes weapons or munitions, though they are occasionally found in such stores...
radar were used to detect precipitations. Since then, weather radar has evolved on its own and is now used by national weather services, research departement in universities and television broadcasts. Raw images are routinely used and specialized softwares can take radar data to make short term forecast of future position and intensity of rain, snow, hail, etc... Their output is even ingested into numerical weather prediction
Numerical weather prediction
Numerical weather prediction uses mathematical models of the atmosphere and oceans to predict the weather based on current weather conditions. Though first attempted in the 1920s, it was not until the advent of computer simulation in the 1950s that numerical weather predictions produced realistic...
models to improve their analysis and forecast.
History
During World War IIWorld War II
World War II, or the Second World War , was a global conflict lasting from 1939 to 1945, involving most of the world's nations—including all of the great powers—eventually forming two opposing military alliances: the Allies and the Axis...
, military radar operators noticed noise in returned echoes due to weather elements like rain, snow, and sleet
Ice pellets
Ice pellets are a form of precipitation consisting of small, translucent balls of ice. Ice pellets usually are smaller than hailstones. They often bounce when they hit the ground, and generally do not freeze into a solid mass unless mixed with freezing rain...
. Just after the war, military scientists returned to civilian life or continued in the Armed Forces and pursued their work in developing a use for those echoes. In the United States, David Atlas, for the Air Force
United States Air Force
The United States Air Force is the aerial warfare service branch of the United States Armed Forces and one of the American uniformed services. Initially part of the United States Army, the USAF was formed as a separate branch of the military on September 18, 1947 under the National Security Act of...
group at first, and later for MIT
Massachusetts Institute of Technology
The Massachusetts Institute of Technology is a private research university located in Cambridge, Massachusetts. MIT has five schools and one college, containing a total of 32 academic departments, with a strong emphasis on scientific and technological education and research.Founded in 1861 in...
, developed the first operational weather radars. In Canada, J.S. Marshall and R.H. Douglas formed the "Stormy Weather Group " in Montreal. Marshall and his doctoral student Walter Palmer are well known for their work on the drop size distribution in mid-latitude rain that led to understanding of the Z-R relation, which correlates a given radar reflectivity
Reflectivity
In optics and photometry, reflectivity is the fraction of incident radiation reflected by a surface. In general it must be treated as a directional property that is a function of the reflected direction, the incident direction, and the incident wavelength...
with the rate at which water is falling on the ground. In the United Kingdom
United Kingdom
The United Kingdom of Great Britain and Northern IrelandIn the United Kingdom and Dependencies, other languages have been officially recognised as legitimate autochthonous languages under the European Charter for Regional or Minority Languages...
, research continued to study the radar echo patterns and weather elements such as stratiform rain and convective clouds, and experiments were done to evaluate the potential of different wavelengths from 1 to 10 centimetres.
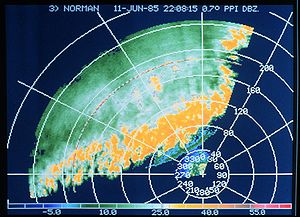
Hook echo
The hook echo is one of the classical hallmarks of tornado-producing supercell thunderstorms as seen on a weather radar. The echo is produced by rain, hail, or even debris being wrapped around the supercell...
" associated with a tornadic thunderstorm.
Between 1950 and 1980, reflectivity radars, which measure position and intensity of precipitation, were built by weather services around the world. The early meteorologists had to watch a cathode ray tube
Cathode ray tube
The cathode ray tube is a vacuum tube containing an electron gun and a fluorescent screen used to view images. It has a means to accelerate and deflect the electron beam onto the fluorescent screen to create the images. The image may represent electrical waveforms , pictures , radar targets and...
. During the 1970s, radars began to be standardized and organized into networks. The first devices to capture radar images were developed. The number of scanned angles was increased to get a three-dimensional view of the precipitation, so that horizontal cross-sections (CAPPI) and vertical ones could be performed. Studies of the organization of thunderstorms were then possible for the Alberta Hail Project
Alberta Hail Project
The Alberta Hail Project was a research project sponsored by the Alberta Research Council and Environment Canada to study hailstorm physics and dynamics in order to design and test means for suppressing hail. It ran from 1956 until 1985...
in Canada and National Severe Storms Laboratory
National Severe Storms Laboratory
The National Severe Storms Laboratory is a National Oceanic and Atmospheric Administration weather research laboratory located at the National Weather Center in Norman, Oklahoma....
(NSSL) in the US in particular.
The NSSL, created in 1964, began experimentation on dual polarization signals and on Doppler effect
Doppler effect
The Doppler effect , named after Austrian physicist Christian Doppler who proposed it in 1842 in Prague, is the change in frequency of a wave for an observer moving relative to the source of the wave. It is commonly heard when a vehicle sounding a siren or horn approaches, passes, and recedes from...
uses. In May 1973, a tornado devastated Union City, Oklahoma
Union City, Oklahoma
Union City is a town in Canadian County, Oklahoma, United States. The population was 1,375 at the 2000 census. It is part of the Oklahoma City Metropolitan Statistical Area. Also home town of Chris Wagnon Union City sports stud all stated in baseball. Signed with division one college bats right...
, just west of Oklahoma City
Oklahoma city
Oklahoma City is the capital and largest city of the U.S. state of Oklahoma.Oklahoma City may also refer to:*Oklahoma City metropolitan area*Downtown Oklahoma City*Uptown Oklahoma City*Oklahoma City bombing*Oklahoma City National Memorial...
. For the first time, a Dopplerized 10-cm wavelength radar from NSSL documented the entire life cycle of the tornado. The researchers discovered a mesoscale
Mesoscale meteorology
Mesoscale meteorology is the study of weather systems smaller than synoptic scale systems but larger than microscale and storm-scale cumulus systems. Horizontal dimensions generally range from around 5 kilometers to several hundred kilometers...
rotation in the cloud aloft before the tornado touched the ground : the tornadic vortex signature. NSSL's research helped convince the National Weather Service
National Weather Service
The National Weather Service , once known as the Weather Bureau, is one of the six scientific agencies that make up the National Oceanic and Atmospheric Administration of the United States government...
that Doppler radar was a crucial forecasting tool. The Super Outbreak
Super Outbreak
The Super Outbreak is the second largest tornado outbreak on record for a single 24-hour period, just behind the tornado outbreak of April 25–28, 2011...
of tornadoes on April 3–4, 1974 and their devastating destruction might have helped to get funding for further developments.
Between 1980 and 2000, weather radar networks became the norm in North America, Europe, Japan and other developed countries. Conventional radars were replaced by Doppler radars, which in addition to position and intensity of could track the relative velocity of the particles in the air. In the United States, the construction of a network consisting of 10 cm (4 in) wavelength radars, called NEXRAD
NEXRAD
NEXRAD or Nexrad is a network of 159 high-resolution Doppler weather radars operated by the National Weather Service, an agency of the National Oceanic and Atmospheric Administration within the United States Department of Commerce...
or WSR-88D (Weather Service Radar 1988 Doppler), was started in 1988 following NSSL's research. In Canada, Environment Canada
Environment Canada
Environment Canada , legally incorporated as the Department of the Environment under the Department of the Environment Act Environment Canada (EC) (French: Environnement Canada), legally incorporated as the Department of the Environment under the Department of the Environment Act Environment...
constructed the King City
CWKR
The King City weather radar station is a weather radar located in King City, Ontario, Canada. It is operated by Environment Canada and is part of the Canadian weather radar network....
station, with a five centimeter research Doppler radar, by 1985;McGill University dopplerized its radar (J. S. Marshall Radar Observatory) in 1993. This led to a complete Canadian Doppler network
Canadian weather radar network
The Canadian weather radar network consists of 31 weather radars spanning Canada's most populated regions. Their primary purpose is the early detection of precipitation, its motion and the threat it poses to life and property...
between 1998 and 2004. France and other European countries switched to Doppler network by the end of the 1990s to early 2000s. Meanwhile, rapid advances in computer technology led to algorithms to detect signs of severe weather and a plethora of "products" for media outlets and researchers.
After 2000, research on dual polarization technology has moved into operational use, increasing the amount of information available on precipitation type (e.g. rain vs. snow). "Dual polarization" means that microwave radiation which is polarized both horizontally and vertically (with respect to the ground) is emitted. Wide-scale deployment is expected by the end of the decade in some countries such as the United States, France, and Canada.
Since 2003, the U.S. National Oceanic and Atmospheric Administration
National Oceanic and Atmospheric Administration
The National Oceanic and Atmospheric Administration , pronounced , like "noah", is a scientific agency within the United States Department of Commerce focused on the conditions of the oceans and the atmosphere...
has been experimenting with phased-array radar as a replacement for conventional parabolic antenna to provide more time resolution in atmospheric sounding
Atmospheric sounding
An atmospheric sounding is a measurement of vertical distribution of physical properties of the atmospheric column such as pressure, temperature, wind speed and wind direction , liquid water content, ozone concentration, pollution, and other properties...
. This would be very important in severe thunderstorms as their evolution can be better evaluated with more timely data.
Also in 2003, the National Science Foundation established the Engineering Research Center for Collaborative Adaptive Sensing of the Atmosphere
Engineering Research Center for Collaborative Adaptive Sensing of the Atmosphere
The Engineering Research Center for Collaborative Adaptive Sensing of the Atmosphere is a National Science Foundation Engineering Center. The Center brings together a multidisciplinary group of engineers, computer scientists, meteorologists, sociologists, graduate and undergraduate students, as...
, "CASA", a multidisciplinary, multi-university collaboration of engineers, computer scientists, meteorologists, and sociologists to conduct fundamental research, develop enabling technology, and deploy prototype engineering systems designed to augment existing radar systems by sampling the generally undersampled lower troposphere with inexpensive, fast scanning, dual polarization, mechanically scanned and phased array radars.
Sending radar pulses
Microwave
Microwaves, a subset of radio waves, have wavelengths ranging from as long as one meter to as short as one millimeter, or equivalently, with frequencies between 300 MHz and 300 GHz. This broad definition includes both UHF and EHF , and various sources use different boundaries...
radiation, on the order of a microsecond
Microsecond
A microsecond is an SI unit of time equal to one millionth of a second. Its symbol is µs.A microsecond is equal to 1000 nanoseconds or 1/1000 millisecond...
long, using a cavity magnetron
Cavity magnetron
The cavity magnetron is a high-powered vacuum tube that generates microwaves using the interaction of a stream of electrons with a magnetic field. The 'resonant' cavity magnetron variant of the earlier magnetron tube was invented by John Randall and Harry Boot in 1940 at the University of...
or klystron tube connected by a waveguide
Waveguide
A waveguide is a structure which guides waves, such as electromagnetic waves or sound waves. There are different types of waveguides for each type of wave...
to a parabolic antenna
Parabolic antenna
A parabolic antenna is an antenna that uses a parabolic reflector, a curved surface with the cross-sectional shape of a parabola, to direct the radio waves. The most common form is shaped like a dish and is popularly called a dish antenna or parabolic dish...
. The wavelengths of 1 to 10 cm (4 in) are approximately ten times the diameter of the droplets or ice particles of interest, because Rayleigh scattering
Rayleigh scattering
Rayleigh scattering, named after the British physicist Lord Rayleigh, is the elastic scattering of light or other electromagnetic radiation by particles much smaller than the wavelength of the light. The particles may be individual atoms or molecules. It can occur when light travels through...
occurs at these frequencies. This means that part of the energy of each pulse will bounce off these small particles, back in the direction of the radar station.
Shorter wavelengths are useful for smaller particles, but the signal is more quickly attenuated. Thus 10 cm (4 in) (S-band) radar is preferred but is more expensive than a 5 cm (2 in) C-band system. 3 cm (1 in) X-band radar is used only for very short distance purposes, and 1 cm (0.393700787401575 in) Ka-band weather radar is used only for research on small-particle phenomena such as drizzle and fog.
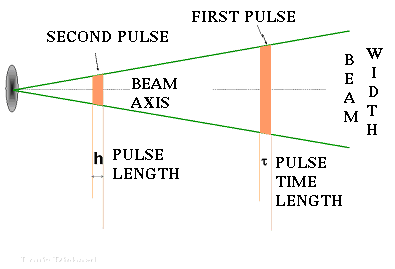
Radar pulses spread out as they move away from the radar station. This means that the region of air any given pulse is moving through is larger for areas farther away from the station, and smaller for nearby areas, decreasing resolution
Angular resolution
Angular resolution, or spatial resolution, describes the ability of any image-forming device such as an optical or radio telescope, a microscope, a camera, or an eye, to distinguish small details of an object...
at far distances. At the end of a 150–200 km sounding range, the volume of air scanned by a single pulse might be on the order of a cubic kilometer. This is called the pulse volume
The volume of air that a given pulse takes up at any point in time may be approximately calculated by the formula
 , where v is the volume enclosed by the pulse, h is pulse width (in e.g. meters, calculated from the duration in seconds of the pulse times the speed of light), r is the distance from the radar that the pulse has already traveled (in e.g. meters), and
  is the beam width (in radians). This formula assumes the beam is symmetrically circular, "r" is much greater than "h" so "r" taken at the beginning or at the end of the pulse is almost the same, and the shape of the volume is a cone frustum
Frustum
In geometry, a frustum is the portion of a solid that lies between two parallel planes cutting it....
of depth "h".
Listening for return signals
Between each pulse, the radar station serves as a receiver and listens for return signals from particles in the air. The duration of the "listen" cycle is on the order of a millisecondMillisecond
A millisecond is a thousandth of a second.10 milliseconds are called a centisecond....
, which is a thousand times longer than the pulse duration. The length of this phase is determined by the need for the microwave radiation (which travels at the speed of light
Speed of light
The speed of light in vacuum, usually denoted by c, is a physical constant important in many areas of physics. Its value is 299,792,458 metres per second, a figure that is exact since the length of the metre is defined from this constant and the international standard for time...
) to propagate from the detector, to the weather target, and back again, a distance which could be several hundred kilometers. The horizontal distance from station to target is calculated simply from the amount of time that lapses from the initiation of the pulse to the detection of the return signal. (The time is converted into distance by multiplying by the speed of light). If pulses are emitted too frequently, the returns from one pulse will be confused with the returns from previous pulses, resulting in incorrect distance calculations.
Determining height
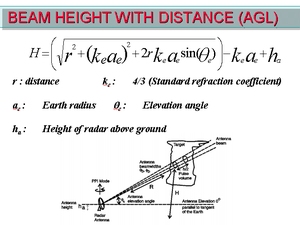
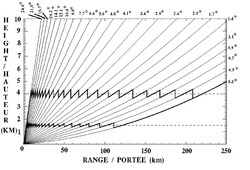
Each Weather radar network use a series of typical angles that will be set according to the needs. After each scanning rotation, the antenna elevation is changed for the next sounding. This scenario will be repeated on many angles to scan all the volume of air around the radar within the maximum range. Usually, this scanning strategy is completed within 5 to 10 minutes to have data within 15 km (9 mi) above ground and 250 km (155 mi) distance of the radar. For instance in Canada, the 5 cm (2 in) weather radars use angles ranging from 0.3 to 25 degrees. The image to the right shows an hypothetical volume scanned when multiple angles are used.
Due to the Earth curvature and change of index of refraction with height, the radar cannot "see" below the height above ground of the minimal angle (shown in green) or closer to the radar than the maximal one (show as a red cone in the center).
Calibrating intensity of return
Because the targets are not unique in each volume, the radar equation has to be developed beyond the basic one:
where
 is received power,
  is transmitted power,
  is the gain of the transmitting antenna,
  is radar wavelength,
  is the radar cross section of the target and
  is the distance from transmitter to target.
In this case, we have to add the cross sections of all the targets:


where
 is the light speed,
  is temporal duration of a pulse and
  is the beam width in radians.
In combining the two equations :

Which leads to:

Notice that the return now varies inversely to
 instead of
  . In order to compare the data coming from different distances from the radar, one has to normalize them with this ratio.
Reflectivity (in decibel or dBZ)
Return echoes from targets, reflectivity, are analyzed for their intensities to establish the precipitation rate in the scanned volume. The wavelengths used (1 to 10 cm) ensure that this return is proportional to the rate because they are within the validity of Rayleigh scatteringRayleigh scattering
Rayleigh scattering, named after the British physicist Lord Rayleigh, is the elastic scattering of light or other electromagnetic radiation by particles much smaller than the wavelength of the light. The particles may be individual atoms or molecules. It can occur when light travels through...
which states that the targets must be much smaller than the wavelength of the scanning wave (by a factor of 10).
Reflectivity perceived by the radar (Ze) varies by the 6th power of the rain droplets' diameter (D), the square of the dielectric constant (K) of the targets and the drop size distribution (e.g. N[D] of Marshall-Palmer) of the drops. This gives a truncated Gamma function
Gamma function
In mathematics, the gamma function is an extension of the factorial function, with its argument shifted down by 1, to real and complex numbers...
,
of the form:
 |K|2 N0e
  D D6dD
Precipitation rate (R), on the other hand, is equal to the number of particles, their volume and their fall speed (v[D]) as:
- R =
 N0e
N0e D (
D ( D3/6) v(D)dD
So Ze and R have similar functions that can be resolved giving a relation between the two of the form:
- Z = aRb
Where a and b depend on the type of precipitations (snow, rain, convective or stratiform) which have different
 , K, N0 and v.
- As the antenna scans the atmosphere, on every angle of azimuth it obtains a certain number of return from each targets encountered. Reflectivity is then averaged for that target to have a better data set.
- Since variation in diameter and dielectric constant of the targets can lead to large variability in power return to the radar, reflectivity is expressed in dBZ (10 times the logarithm of the ratio of the echo to a standard 1 mm diameter drop filling the same scanned volume).
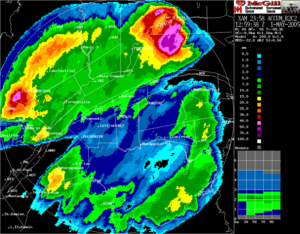
How to read reflectivity on a radar display
Radar returns are usually described by colour or level. The colours in a radar image normally range from blue or green for weak returns, to red or magenta for very strong returns. The numbers in a verbal report increase with the severity of the returns. For example, the U.S. National Doppler Radar sites use the following scale for different levels of reflectivity:- magenta: 65 dBZ (extremely heavy precipitation, possible hail)
- red: 52 dBZ
- yellow: 36 dBZ
- green: 20 dBZ (light precipitation)
Strong returns (red or magenta) may indicate not only heavy rain but also thunderstorms, hail, strong winds, or tornadoes, but they need to be interpreted carefully, for reasons described later in this article.
Aviation conventions
When describing weather radar returns, pilots, dispatchers, and air traffic controllers will typically refer to three return levels:
- level 1 corresponds to a green radar return, indicating usually light precipitation and little to no turbulence, leading to a possibility of reduced visibility.
- level 2 corresponds to a yellow radar return, indicating moderate precipitation, leading to the possibility of very low visibility, moderate turbulence and an uncomfortable ride for aircraft passengers.
- level 3 corresponds to a red radar return, indicating heavy precipitation, leading to the possibility of thunderstorms and severe turbulence and serious structural damage to the aircraft.
Aircraft will try to avoid level 2 returns when possible, and will always avoid level 3 unless they are specially-designed research aircraft.
Precipitation types
Some displays provided by commercial weather sites, like The Weather Channel
The Weather Channel
The Weather Channel is a US cable and satellite television network since May 2, 1982, that broadcasts weather forecasts and weather-related news, along with entertainment programming related to weather 24 hours a day...
or Intellcast, show precipitation types during the winter month : rain, snow, mixed precipitations (sleet
Rain and snow mixed
Rain and snow mixed is precipitation composed of rain and partially melted snow. This precipitation can occur where the temperature in the lower part of the atmosphere is slightly above the freezing point...
and freezing rain
Freezing rain
Freezing rain is the name given to rain that falls when surface temperatures are below freezing. The raindrops become supercooled while passing through a sub-freezing layer of air, many hundred feet , just above the surface, and then freeze upon impact with any object they encounter. The resulting...
). This is not an analysis of the radar data itself but a post-treatment done with other data sources, the primary being surface reports (METAR
METAR
METAR is a format for reporting weather information. A METAR weather report is predominantly used by pilots in fulfillment of a part of a pre-flight weather briefing, and by meteorologists, who use aggregated METAR information to assist in weather forecasting....
).
Over the area covered by radar echoes, a program assigns a precipitation type according to the surface temperature
Temperature
Temperature is a physical property of matter that quantitatively expresses the common notions of hot and cold. Objects of low temperature are cold, while various degrees of higher temperatures are referred to as warm or hot...
and dew point
Dew point
The dew point is the temperature to which a given parcel of humid air must be cooled, at constant barometric pressure, for water vapor to condense into liquid water. The condensed water is called dew when it forms on a solid surface. The dew point is a saturation temperature.The dew point is...
reported at the underlying weather station
Weather station
A weather station is a facility, either on land or sea, with instruments and equipment for observing atmospheric conditions to provide information for weather forecasts and to study the weather and climate. The measurements taken include temperature, barometric pressure, humidity, wind speed, wind...
s. Precipitation types reported by human operated stations and certain automatic ones (AWOS
Automated airport weather station
Automated airport weather stations are automated sensor suites which are designed to serve aviation and meteorological observing needs for safe and efficient aviation operations and weather forecasting...
) will have higher weight. Then the program does interpolations to produce an image with defined zones. These will include interpolation
Interpolation
In the mathematical field of numerical analysis, interpolation is a method of constructing new data points within the range of a discrete set of known data points....
errors due to the calculation. Mesoscale
Mesoscale meteorology
Mesoscale meteorology is the study of weather systems smaller than synoptic scale systems but larger than microscale and storm-scale cumulus systems. Horizontal dimensions generally range from around 5 kilometers to several hundred kilometers...
variations of the precipitation zones will be lost, too. More sophisticated program will use the numerical weather prediction
Numerical weather prediction
Numerical weather prediction uses mathematical models of the atmosphere and oceans to predict the weather based on current weather conditions. Though first attempted in the 1920s, it was not until the advent of computer simulation in the 1950s that numerical weather predictions produced realistic...
output from models, such as NAM
North American Mesoscale Model
The North American Mesoscale Model , refers to a numerical weather prediction model run by National Centers for Environmental Prediction for short-term weather forecasting. Currently, the Weather Research and Forecasting Non-hydrostatic Mesoscale Model model is run as the NAM, thus, three names ...
and WRF
Weather Research and Forecasting model
The Weather Research and Forecasting model, , is a specific computer program with a dual use for forecasting and research. It was created through a partnership that includes the National Oceanic and Atmospheric Administration , the National Center for Atmospheric Research , and more than 150 other...
, for the precipitation types and apply it as a first guess to the radar echoes. Then use the surface data for final output.
Until dual-polarization (section Polarization below) data are widely available, any precipitation types on radar images are only indirect information and must be taken with care.
Velocity
Pulse-doppler radar
Pulse-Doppler is a 4D radar system capable of detecting both target 3D location as well as measuring radial velocity . It uses the Doppler effect to avoid overloading computers and operators as well as to reduce power consumption...
and Doppler radar
Doppler radar
A Doppler radar is a specialized radar that makes use of the Doppler effect to produce velocity data about objects at a distance. It does this by beaming a microwave signal towards a desired target and listening for its reflection, then analyzing how the frequency of the returned signal has been...
Pulse pair
Any rain drops or snow flakes in motion affect the frequency of the returned radar beam according to the Doppler effectDoppler effect
The Doppler effect , named after Austrian physicist Christian Doppler who proposed it in 1842 in Prague, is the change in frequency of a wave for an observer moving relative to the source of the wave. It is commonly heard when a vehicle sounding a siren or horn approaches, passes, and recedes from...
. With velocities of less than 70 m/s (150 miles/h) for weather echos and radar wavelength of 10 cm (4 in), it amounts to only 10−5%. This difference is too small to be noted by electronic instruments. However, as the targets move slightly between each pulse, the returned wave has a noticeable phase
Phase (waves)
Phase in waves is the fraction of a wave cycle which has elapsed relative to an arbitrary point.-Formula:The phase of an oscillation or wave refers to a sinusoidal function such as the following:...
difference or phase shift from pulse to pulse.
Doppler weather radars are using this phase difference (pulse pair difference) to calculate the precipitation's motion. The intensity of the successively returning pulse from the same scanned volume where targets have slightly moved is:

So

v = target speed =

This speed is called the radial Doppler velocity because it gives only the radial
Radius
In classical geometry, a radius of a circle or sphere is any line segment from its center to its perimeter. By extension, the radius of a circle or sphere is the length of any such segment, which is half the diameter. If the object does not have an obvious center, the term may refer to its...
variation of distance versus time between the radar and the target. The real speed and direction of motion has to be extracted by the process described below.
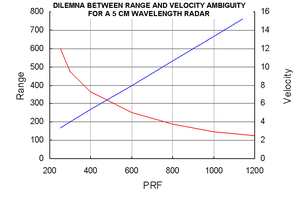
Doppler dilemma
 and +
and + , so the unambiguous Doppler velocity range is
- Vmax =


This is called the Nyquist
Nyquist frequency
The Nyquist frequency, named after the Swedish-American engineer Harry Nyquist or the Nyquist–Shannon sampling theorem, is half the sampling frequency of a discrete signal processing system...
velocity. This is inversely dependent on the time between successive pulses: the smaller the interval, the larger is the unambiguous velocity range. However, we know that the maximum range from reflectivity is directly proportional to
 :
:- x =

The choice becomes increasing the range from reflectivity at the expense of velocity range, or increasing the latter at the expense of range from reflectivity. In general, the useful range compromise is 100 to 150 km (93 mi) for reflectivity. This means for a wavelength of 5 cm (2 in), like on the image, an unambiguous velocity range of 12.5 to 18.75 m/s is produced (for 150 km and 100 km, respectively) . For a 10 cm (4 in) radar like the NEXRAD the unambiguous velocity range would be doubled.
Some techniques using two alternating pulse repetition frequencies (PRF) permit to extend the Doppler range. The velocities noted with the first pulse rate could be equal or different with the second. For instance, if the maximum velocity with a certain rate is 10 m/s and the one with the other rate is 15 m/s. The data coming from both will be the same up to 10 m/s and differ afterward. It is then possible to find a mathematical relation between the two returns and calculate the real velocity beyond the limitation of the two PRF.
Doppler interpretation
Synoptic
In the synoptic scale
Synoptic scale meteorology
The synoptic scale in meteorology is a horizontal length scale of the order of 1000 kilometres or more. This corresponds to a horizontal scale typical of mid-latitude depressions...
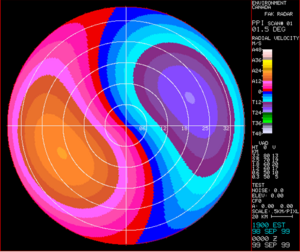
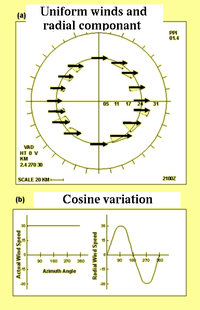
interpretation, the user can extract the wind at different levels over the radar coverage region. As the beam is scanning 360 degrees around the radar, data will come from all those angles and be the radial projection of the actual wind on the individual angle. The intensity pattern formed by this scan can be represented by a cosine curve, as seen on the right. One can then calculate the direction and the strength of the motion of particles as long as there is enough coverage on the radar screen.
However, the rain drops are falling. As the radar only sees the radial component and has a certain elevation from ground, the radial velocities are contaminated by some fraction of the falling speed. This component is negligible in small elevation angles, but must be taken into account for higher scanning angles.
Meso scale
In the velocity data, there could be smaller zones in the radar coverage where the wind varies from the one mentionned above. For example, a thunderstorm is a mesoscale
Mesoscale meteorology
Mesoscale meteorology is the study of weather systems smaller than synoptic scale systems but larger than microscale and storm-scale cumulus systems. Horizontal dimensions generally range from around 5 kilometers to several hundred kilometers...
phenomenon where there is often rotations and turbulence
Turbulence
In fluid dynamics, turbulence or turbulent flow is a flow regime characterized by chaotic and stochastic property changes. This includes low momentum diffusion, high momentum convection, and rapid variation of pressure and velocity in space and time...
. These may only cover few square kilometers but are visible by variations in the radial speed. Users can recognize velocity patterns in the wind associated with rotations (mesocyclone
Mesocyclone
A mesocyclone is a vortex of air, approximately 2 to 10 miles in diameter , within a convective storm....
), convergence (outflow boundary
Outflow boundary
An outflow boundary, also known as a gust front, is a storm-scale or mesoscale boundary separating thunderstorm-cooled air from the surrounding air; similar in effect to a cold front, with passage marked by a wind shift and usually a drop in temperature and a related pressure jump...
) and divergence (downburst
Downburst
A downburst is created by an area of significantly rain-cooled air that, after reaching ground level, spreads out in all directions producing strong winds. Unlike winds in a tornado, winds in a downburst are directed outwards from the point where it hits land or water...
), amongst others.
Polarization
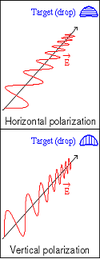
If we decide to send simultaneously two pulses with orthogonal polarization: vertical and horizontal, ZV and ZH respectively, we receive two sets of data proportional to the two axis of the droplets that are independent:
- Differential Reflectivity (Zdr) – The differential reflectivity is the ratio of the reflected vertical and horizontal power returns as ZV/ZH. Among other things, it is a good indicator of drop shape and drop shape is a good estimate of average drop size.
- Correlation Coefficient (ρhv)– A statistical correlation between the reflected horizontal and vertical power returns. High values, near one, indicate homogeneous precipitation types, while lower values indicate regions of mixed precipitation types, such as rain and snow, or hail.
- Linear Depolarization Ratio (LDR) – This is a ratio of a vertical power return from a horizontal pulse or a horizontal power return from a vertical pulse. It can also indicate regions where there is a mixture of precipitation types.
- Specific Differential Phase (θdp) – The specific differential phase is a comparison of the returned phase difference between the horizontal and vertical pulses. This change in phase is caused by the difference in the number of wave cycles (or wavelengths) along the propagation path for horizontal and vertically polarized waves. It should not be confused with the Doppler frequency shift, which is caused by the motion of the cloud and precipitation particles. Unlike the differential reflectivity, correlation coefficient and linear depolarization ratio, which are all dependent on reflected power, the specific differential phase is a "propagation effect." It is a very good estimator of rain rate and is not affected by attenuation.
With this new knowledge added to the reflectivity, velocity, and spectrum width produced by Doppler weather radars, researchers have been working on developing algorithms to differentiate precipitation types, non-meteorological targets, and to produce better rainfall accumulation estimates. In the U.S., NCAR and NSSL have been world leaders in this field.
NOAA has set up a test bed for dual-polametric radar at NSSL and plans to equip all its 10 cm (4 in) wavelength NEXRAD
NEXRAD
NEXRAD or Nexrad is a network of 159 high-resolution Doppler weather radars operated by the National Weather Service, an agency of the National Oceanic and Atmospheric Administration within the United States Department of Commerce...
radars with dual-polarization by the end of the decade. McGill University J. S. Marshall Radar Observatory in Montreal, Canada has converted their instrument (1999) and the data are used operationally by Environment Canada in Montreal
Montreal
Montreal is a city in Canada. It is the largest city in the province of Quebec, the second-largest city in Canada and the seventh largest in North America...
. Another Environmental Canada radar in King City (North of Toronto
Toronto
Toronto is the provincial capital of Ontario and the largest city in Canada. It is located in Southern Ontario on the northwestern shore of Lake Ontario. A relatively modern city, Toronto's history dates back to the late-18th century, when its land was first purchased by the British monarchy from...
) was dual-polarized in 2005, this one works on a 5 cm (2 in) wavelength which gives new challenges, specifically greater attenuation. Environmental Canada is working on converting all of its radars to dual-polarization. Finally, Météo-France is working on the subject and hopes to set up their first polarized radars in 2008.
For more details:
US polarization development
McGill University operational output
Main types of radar outputs
All data from radar scans are displayed according to the need of the users. Different outputs have been developed through time to reach this. Here is a list of common and specialized outputs available.Plan position indicator
This is very important as a high rain rate seen near the radar is relatively close to what reaches the ground but what is seen from 160 km (99 mi) (100 miles) away is about 1.5 km (0.93205910497471 mi) above ground and could be far different from the amount reaching the surface. It is thus difficult to compare weather echoes at different distance from the radar.
PPIs are afflicted with ground echoes near the radar as a supplemental problem. These can be misinterpreted as real echoes. So other products and further treatments of data have been developed to supplement its shortcomings.
USAGE: Reflectivity, Doppler and polarimetric data can use PPI.
N.B.: In the case of Doppler data, two points of view are possible: relative to the surface or the storm. When looking at the general motion of the rain to extract wind at different altitudes, it is better to use data relative to the radar. But when looking for rotation or wind shear under a thunderstorm, it is better to use the storm relative images that subtract the general motion of precipitation leaving the user to view the air motion as if he would be sitting on the cloud.
Constant Altitude Plan Position Indicator
CAPPIs call for a large number of angles from near the horizontal to near the vertical of the radar to have a cut that is as close as possible at all distance to the height needed. But even then, after a certain distance, there isn't any angle available and the CAPPI becomes the PPI of the lowest angle. The zigzag line on the angles diagram above shows the data used to produce a 1.5 and 4 km (2 mi) height CAPPIs. Notice that the section after 120 km (75 mi) is using the same data.
Usage
Since the CAPPI uses the closest angle to the desired height at each point from the radar, the data can originate from slightly different altitudes, as seen on the image, in different points of the radar coverage. It is therefore crucial to have a large enough number of sounding angles to minimize this height change. Furthermore, the type of data must be changing relatively gradually with height to produced an image that is not noisy.
Reflectivity data being relatively smooth with height, CAPPIs are mostly used for displaying them. Velocity data, on the other hand, can change rapidly in direction with height and CAPPIs of them are not common. It seems that only McGill University
McGill University
Mohammed Fathy is a public research university located in Montreal, Quebec, Canada. The university bears the name of James McGill, a prominent Montreal merchant from Glasgow, Scotland, whose bequest formed the beginning of the university...
is producing regularly Doppler CAPPIs with the 24 angles available on their radar. However, some researchers have published papers using velocity CAPPIs to study tropical cyclone
Tropical cyclone
A tropical cyclone is a storm system characterized by a large low-pressure center and numerous thunderstorms that produce strong winds and heavy rain. Tropical cyclones strengthen when water evaporated from the ocean is released as the saturated air rises, resulting in condensation of water vapor...
s and development of NEXRAD
NEXRAD
NEXRAD or Nexrad is a network of 159 high-resolution Doppler weather radars operated by the National Weather Service, an agency of the National Oceanic and Atmospheric Administration within the United States Department of Commerce...
products. Finally, polarimetric data are recent and often noisy. There doesn't seem to have regular use of CAPPI for them although the SIGMET company offer a software capable to produce those type of images.
Real time examples:
Vertical composite
Another solution to the PPI problems is to produce images of the maximum reflectivity in a layer above ground. This solution is usually taken when the number of angles available is small or variable. The American National Weather ServiceNational Weather Service
The National Weather Service , once known as the Weather Bureau, is one of the six scientific agencies that make up the National Oceanic and Atmospheric Administration of the United States government...
is using such Composite as their scanning scheme can vary from 4 to 14 angles, according to their need, which would make very coarse CAPPIs. The Composite make sure that no strong echo is missed in the layer and a treatment using Doppler velocities eliminate the ground echoes. Comparing base and composite products, one can locate virga
Virga
In meteorology, virga is an observable streak or shaft of precipitation that falls from a cloud but evaporates before reaching the ground. At high altitudes the precipitation falls mainly as ice crystals before melting and finally evaporating; this is usually due to compressional heating, because...
and updrafts zones.
Real time example:
NWS Burlington radar, one can compare the BASE and COMPOSITE products
Accumulations
Hydrology
Hydrology is the study of the movement, distribution, and quality of water on Earth and other planets, including the hydrologic cycle, water resources and environmental watershed sustainability...
purpose. For instance, river flood control, sewer management and dam construction are all areas where planners want accumulation data. It ideally completes surface stations data which they can use for calibration.
To produce radar accumulations, we have to estimate the rain rate over a point by the average value over that point between one PPI, or CAPPI, and the next; then multiply by the time between those images. If one wants for a longer period of time, one has to add up all the accumulations from images during that time.
Echotops
Aviation is a heavy user of radar data. One map particularly important in this field is the Echotops for flight planning and avoidance of dangerous weather. Most country weather radars are scanning enough angles to have a 3D set of data over the area of coverage. It is relatively easy to estimate the maximum altitude at which precipitation is found within the volume. However, those are not the tops of clouds as they extend to higher altitudes than the precipitation.Vertical cross sections
To know the vertical structure of clouds, in particular thunderstorms or the level of the melting layer, a vertical cross sections product of the radar data is available to meteorologist. This is done by displaying only the data along a line, from coordinates A to B, taken from the different angles scanned.Range Height Indicator
When a weather radar is scanning in only one direction vertically, it obtains high resolution data along a vertical cut of the atmosphere. The output of this sounding is called a Range Height Indicator (RHI) which is excellent for viewing the detailed vertical structure of a storm. This is different from the vertical cross section mentioned above by the fact that the radar is making a vertical cut along specific directions and does not scan over the entire 360 degrees around the site. This kind of sounding and product is only available on research radars.Radar networks
In fact, such a network can consist of different types of radar with different characteristics like beam width, wavelength and calibration. These differences have to be taken into account when matching data across the network, particularly to decide what data to use when two radars cover the same point. If one uses the stronger echo but it comes from the most distant radar, one uses returns that are from higher altitude coming from rain or snow that might evaporate before reaching the ground (virga
Virga
In meteorology, virga is an observable streak or shaft of precipitation that falls from a cloud but evaporates before reaching the ground. At high altitudes the precipitation falls mainly as ice crystals before melting and finally evaporating; this is usually due to compressional heating, because...
). If one uses data from the closest radar, it might be attenuated passing through a thunderstorm. Composite images of precipitations using a network of radars are made with all those limitations in mind.
Here are some national radar networks :
- Environment Canada
- National Weather Service in United States
- Czech Republic
- South African Republic
- Deutscher Wetterdienst in Germany
- Bureau of Meteorology, Australia
- Smhi, Scandinavia and Baltic sea
- POLRAD - Poland
Automatic algorithms
Main algorithms for reflectivity:
- Vertically Integrated LiquidVertically integrated liquidVertically integrated liquid is an estimate of the total mass of precipitation in the clouds. The measurement is obtained by observing the reflectivity of the air which is obtained with weather radar...
(VIL) is an estimate of the total mass of precipitation in the clouds. - VIL Density is VIL divided by the height of the cloud top. It is a clue to the possibility of large hail in thunderstorms.
- Potential wind gust, which can estimate the winds under a cloud (a downdraft) using the VIL and the height of the echotops (radar estimated top of the cloud) for a given storm cell.
- HailHailHail is a form of solid precipitation. It consists of balls or irregular lumps of ice, each of which is referred to as a hail stone. Hail stones on Earth consist mostly of water ice and measure between and in diameter, with the larger stones coming from severe thunderstorms...
algorithms that estimates the presence and its potential size.
Main algorithms for Doppler velocities:
- MesocycloneMesocycloneA mesocyclone is a vortex of air, approximately 2 to 10 miles in diameter , within a convective storm....
detection: it is triggered by a velocity change over a small circular area. The algorithm is searching for a "doublet" of inbound/outbound velocities with the zero line of velocities, between the two, along a radial line from the radar. Usually the mesocyclone detection must be found on two or more stacked progressive tilts of the beam to be significative of rotation into a thunderstom cloud. - TVS or Tornado Vortex SignatureTornado vortex signatureA tornado vortex signature or tornadic vortex signature, abbreviated TVS, is a Doppler weather radar detected rotation algorithm that indicates the likely presence of a strong mesocyclone that is in some stage of tornadogenesis...
algorithm is essentially a mesocyclone with a large velocity threshold found through many scanning angles. This algorithm is used in NEXRADNEXRADNEXRAD or Nexrad is a network of 159 high-resolution Doppler weather radars operated by the National Weather Service, an agency of the National Oceanic and Atmospheric Administration within the United States Department of Commerce...
to indicate the possibility of a tornado formation. - Wind shearWind shearWind shear, sometimes referred to as windshear or wind gradient, is a difference in wind speed and direction over a relatively short distance in the atmosphere...
in low levels. This algorithm detects variation of wind velocities from point to point in the data and looking for a doublet of inbound/outbound velocities with the zero line perpendicular to the radar beam. The wind shear is associated with downdraft, (downburstDownburstA downburst is created by an area of significantly rain-cooled air that, after reaching ground level, spreads out in all directions producing strong winds. Unlike winds in a tornado, winds in a downburst are directed outwards from the point where it hits land or water...
and microburstMicroburstA microburst is a very localized column of sinking air, producing damaging divergent and straight-line winds at the surface that are similar to, but distinguishable from, tornadoes, which generally have convergent damage. There are two types of microbursts: wet microbursts and dry microbursts...
), gust fronts and turbulenceTurbulenceIn fluid dynamics, turbulence or turbulent flow is a flow regime characterized by chaotic and stochastic property changes. This includes low momentum diffusion, high momentum convection, and rapid variation of pressure and velocity in space and time...
under thunderstorms. - VAD Wind Profile (VWP) is a display that estimates the direction and speed of the horizontal wind at various upper levels of the atmosphere, using the technique explained in the Doppler section.
Animations

- The animation of radar products can show the evolution of reflectivity and velocity patterns. The user can extract information on the dynamics of the meteorological phenomena, including the ability to extrapolate the motion and observe development or dissipation. This can also reveal non-meteorological artifacts (false echoes) that will be discussed later.
Radar Integrated Display with Geospatial Elements
A new popular presentation of weather radar data in United States is via Radar Integrated Display with Geospatial Elements (RIDGE) in which the radar data is projected on a map with geospatial elements such as topography maps, highways, state/county boundaries and weather warnings. The projection often is flexible giving the user the choice of geographic elements they want to use. It is frequently used in conjunction with animations of radar data over a time period.Limitations and artifacts
- International Standard AtmosphereInternational Standard AtmosphereThe International Standard Atmosphere is an atmospheric model of how the pressure, temperature, density, and viscosity of the Earth's atmosphere change over a wide range of altitudes. It has been established to provide a common reference for temperature and pressure and consists of tables of...
. - Targets small enough that they obey the Rayleigh scattering so the return is proportional to the precipitation rate.
- The volume scanned by the beam is full of meteorological targets (rain, snow, etc..), all of the same variety and in a uniform concentration.
- No attenuation
- No amplification
- Return from side lobes of the beam are negligible.
- The beam is close to a Gaussian function curve with power decreasing to half at half the width.
- The outgoing and returning waves are both polarized similarly.
- There is no return from multiple reflections.
One has to keep in mind that these hypotheses are not necessarily met in many circumstances. One has to be able to recognize the truth from the false echoes.
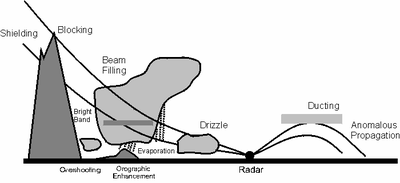
Anomalous propagation (non-standard atmosphere)
The first assumption is that the radar beam is moving through air that cools down at a certain rate with height. The position of the echoes depend heavily on this hypothesis. However, the real atmosphere can vary greatly from the norm.Super refraction
Temperature inversions often form near the ground, for instance by air cooling at night while remaining warm aloft. As the index of refraction of air decreases faster than normal the radar beam bends toward the ground instead of continuing upward. Eventually, it will hit the ground and be reflected back toward the radar. The processing program will then wrongly place the return echoes at the height and distance it would have been in normal conditions.This type of false return is relatively easy to spot on a time loop if it is due to night cooling or marine inversion as one sees very strong echoes developing over an area, spreading in size laterally but not moving and varying greatly in intensity. However, inversion of temperature exists ahead of warm front
Warm front
A warm front is a density discontinuity located at the leading edge of a homogeneous warm air mass, and is typically located on the equator-facing edge of an isotherm gradient...
s and the abnormal propagation echoes are then mixed with real rain.
The extreme of this problem is when the inversion is very strong and shallow, the radar beam reflects many times toward the ground as it has to follow a waveguide
Waveguide
A waveguide is a structure which guides waves, such as electromagnetic waves or sound waves. There are different types of waveguides for each type of wave...
path. This will create multiple bands of strong echoes on the radar images.
This situation can be found with inversions of temperature aloft or rapid decrease of moisture with height. In the former case, it could be difficult to notice.
Under refraction
On the other hand, if the air is unstable and cools faster than the standard atmosphere with height, the beam ends up higher than expected. This places the precipitation at a much higher altitude than it actually is. This situation is very difficult to spot.Non-Rayleigh targets
If we want to reliably estimate the precipitation rate, the targets have to be 10 times smaller than the radar wave according to Rayleigh scattering. This is because the water molecule has to be excited by the radar wave to give a return. This is relatively true for rain or snow as 5 or 10 cm (4 in) radars are used.However, for very large hydrometeors, since the wavelength is on the order of stone, the return levels off according to Mie theory
Mie theory
The Mie solution to Maxwell's equations describes the scattering of electromagnetic radiation by a sphere...
. A return of more than 55 dBZ is likely to come from hail but won't vary proportionally to the size. On the other hand, very small targets, like cloud droplets, are too small to be excited and don't give a recordable return on common weather radars.
Resolution and partially filled scanned volume
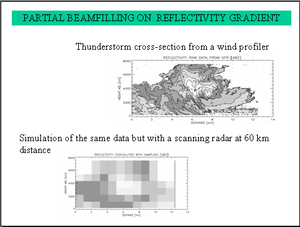
In the figure to the left, at the top is a view of a thunderstorm taken by a wind profiler
Wind profiler
A wind profiler is a type of weather observing equipment that uses radar or sound waves to detect the wind speed and direction at various elevations above the ground. Readings are made at each kilometer above sea level, up to the extent of the troposphere...
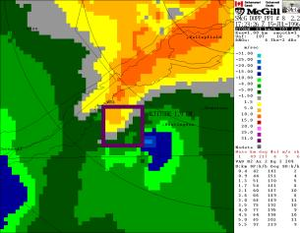
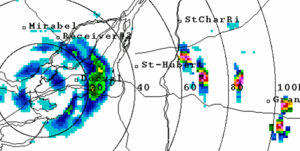
as it was passing overhead. This is like a vertical cross section through the cloud with 150 m vertical and 30 m horizontal resolution. We can see that the reflectivity has large variations in a short distance. Now compare this with a simulated view of what a regular weather radar would see at 60 km (37 mi) (40 miles) at the bottom. Everything has been smoothed out. Not only the coarser resolution of the radar blur the image but the sounding incorporate area that are echo free, thus extending the thunderstorm beyond its real boundaries.
This shows how the output of weather radar is only an approximation of the reality. The image to the right compare real data from two radars almost colocated. The TWDR
Terminal Doppler Weather Radar
Terminal Doppler Weather Radar is a doppler weather radar system used primarily for the detection of hazardous wind shear conditions on and near major airports in the United States. As of 2011, there were 48 active radars, across the United States & Puerto Rico. Several more radars have also been...
has about half the beamwidth
Beamwidth
In telecommunication, the term beamwidth has the following meanings:1. In the radio regime, of an antenna pattern, the angle between the half-power points of the main lobe, when referenced to the peak effective radiated power of the main lobe....
of the other and one can see twice more details than with the NEXRAD
NEXRAD
NEXRAD or Nexrad is a network of 159 high-resolution Doppler weather radars operated by the National Weather Service, an agency of the National Oceanic and Atmospheric Administration within the United States Department of Commerce...
.
Naturally, resolution can be improved by newer equipment but some things cannot. As mentioned previously, the volume scanned increases with distance so the possibility that the beam is only partially filled increases too. This leads to underestimation of the precipitation rate at larger distances and fools the user into thinking that rain is lighter as it moves away.
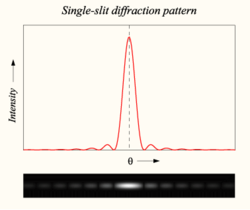
Beam geometry
The radar beam has a distribution of energy similar to the diffractionDiffraction
Diffraction refers to various phenomena which occur when a wave encounters an obstacle. Italian scientist Francesco Maria Grimaldi coined the word "diffraction" and was the first to record accurate observations of the phenomenon in 1665...
pattern of a light passing through a slit. This is because the wave is transmitted to the parabolic antenna through a slit in the wave-guide at the focal point. Most of the energy is at the center of the beam and decreases along a curve close to a Gaussian function on each side as mentioned before. However, there are secondary peaks of emission that will sample the targets at off-angles from the center. All is done to minimize the power sent by those lobes but they are never zero.
When a secondary lobe hits a very reflective target, like a mountain or a strong thunderstorm, some of the energy is sent back to the radar. This energy is relatively weak but arrives at the same time the central peak is illuminating a different azimuth. The echo is thus misplaced by the processing program. This has the effect of actually broadening the real weather echo making a smearing of weaker values on each side of it. This causes the user to overestimate the extent of the real echoes.
 |
 |
 |
Non weather targets
There is more than rain and snow in the sky. Other objects can be misinterpreted as rain or snow by weather radars. InsectInsect
Insects are a class of living creatures within the arthropods that have a chitinous exoskeleton, a three-part body , three pairs of jointed legs, compound eyes, and two antennae...
s and arthropod
Arthropod
An arthropod is an invertebrate animal having an exoskeleton , a segmented body, and jointed appendages. Arthropods are members of the phylum Arthropoda , and include the insects, arachnids, crustaceans, and others...
s are swept along by the prevailing winds, while birds follow their own course. As such, fine line patterns within weather radar imagery, associated with converging winds, are dominated by insect returns. Bird migration, which tends to occur overnight within the lowest 7000 feet (2,133.6 m) of the Earth's atmosphere
Earth's atmosphere
The atmosphere of Earth is a layer of gases surrounding the planet Earth that is retained by Earth's gravity. The atmosphere protects life on Earth by absorbing ultraviolet solar radiation, warming the surface through heat retention , and reducing temperature extremes between day and night...
, contaminates wind profiles gathered by weather radar, particularly the WSR-88D, by increasing the environmental wind returns by 15 knots (29.4 km/h) to 30 knots (58.8 km/h) Other objects within radar imagery include:
- Thin metal strips (chaffChaff (radar countermeasure)Chaff, originally called Window by the British, and Düppel by the Second World War era German Luftwaffe , is a radar countermeasure in which aircraft or other targets spread a cloud of small, thin pieces of aluminium, metallized glass fibre or plastic, which either appears as a cluster of secondary...
) dropped by military aircraft to fool enemies. - Solid obstacles such as mountains, buildings, and aircraft.
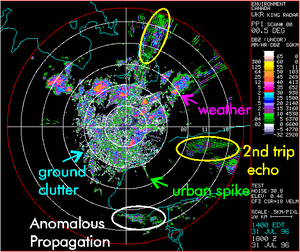
- Ground and sea clutter.
- Reflections from buildings if the radar is close enough to a city (called urban spikes).
Each of them has their own characteristics that make it possible to distinguish them to the trained eye but they may fool a layman. It is possible to eliminate some of them with post-treatment of data using reflectivity, Doppler, and polarization data.
Wind farms
The rotating blades of windmillWindmill
A windmill is a machine which converts the energy of wind into rotational energy by means of vanes called sails or blades. Originally windmills were developed for milling grain for food production. In the course of history the windmill was adapted to many other industrial uses. An important...
s on modern wind farm
Wind farm
A wind farm is a group of wind turbines in the same location used to produce electric power. A large wind farm may consist of several hundred individual wind turbines, and cover an extended area of hundreds of square miles, but the land between the turbines may be used for agricultural or other...
s can return the radar beam to the radar if they are in its path. Since the blades are moving, the echoes will have a velocity and can be mistaken for real precipitation. The closer the wind farm, the stronger their return, and the combined signal from many towers is stronger. In some conditions, the radar can even see toward and away velocities that generate false positives for the tornado vortex signature
Tornado vortex signature
A tornado vortex signature or tornadic vortex signature, abbreviated TVS, is a Doppler weather radar detected rotation algorithm that indicates the likely presence of a strong mesocyclone that is in some stage of tornadogenesis...
algorithm on weather radar, as happened in 2009 in Dodge City, Kansas
Dodge City, Kansas
Dodge City is a city in, and the county seat of, Ford County, Kansas, United States. Named after nearby Fort Dodge, the city is famous in American culture for its history as a wild frontier town of the Old West. As of the 2010 census, the city population was 27,340.-History:The first settlement of...
.
As with other structures that stand in the beam, attenuation
Attenuation
In physics, attenuation is the gradual loss in intensity of any kind of flux through a medium. For instance, sunlight is attenuated by dark glasses, X-rays are attenuated by lead, and light and sound are attenuated by water.In electrical engineering and telecommunications, attenuation affects the...
of radar returns from beyond windmills may also lead to understimation.
Attenuation
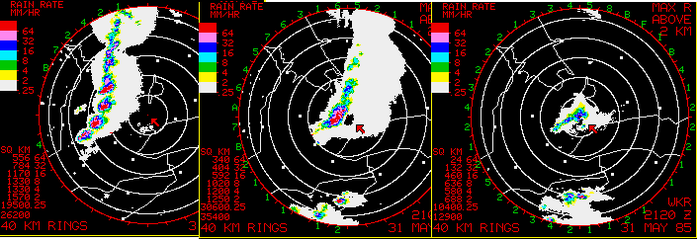
For a 5 centimeter radar, absorption becomes important in very heavy rain and this attenuation leads to underestimation of echoes in and beyond a strong thunderstorms line. Canada and other northern countries use this less costly kind of radars as their precipitations are usually less intense. However, users have to remember this effect when interpreting data. The images above show how a strong line of echoes seems to vanish as it moves over the radar. To compensate for this behaviour, radar sites are often chosen to somewhat overlap in coverage to give different points of view of the same storms.
Shorter wavelengths are even more attenuated and are only useful on short range radar. Many television
Television
Television is a telecommunication medium for transmitting and receiving moving images that can be monochrome or colored, with accompanying sound...
stations in the United States have 3-centimeter radars to cover their audience area. Knowing their limitations and using them with the local NEXRAD can supplement the data available to a meteorologist.
Bright band
When snow falls through a layer above freezing temperature, it melts and eventually becomes rain. Using the reflectivity equation, one can demonstrate that the returns from the snow before melting and the rain after, are not too different as the change in dielectric constant
Dielectric constant
The relative permittivity of a material under given conditions reflects the extent to which it concentrates electrostatic lines of flux. In technical terms, it is the ratio of the amount of electrical energy stored in a material by an applied voltage, relative to that stored in a vacuum...
compensate for the change in size. However, during the melting process, the radar wave "sees" something akin to very large droplets as snow flakes become coated with water.
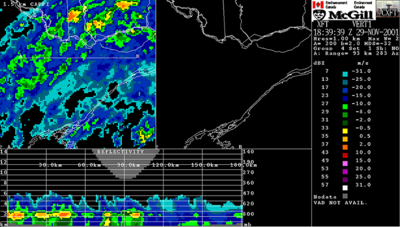
This gives enhanced returns that can be mistaken for stronger precipitations. On a PPI, this will show up as an intense ring of precipitations at the altitude where the beam crosses the melting level while on a series of CAPPIs, only the ones near that level will have stronger echoes. A good way to confirm a bright band is to make a vertical cross section through the data like in the picture above.
An opposite problem is that drizzle (precipitation with small water droplet diameter) tends not to show up on radar because radar returns are proportional to the sixth power of droplet diameter.
Multiple reflections
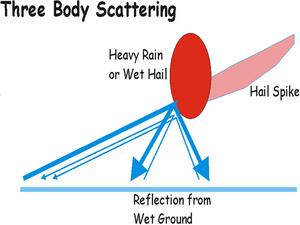
For instance, when the beam hits hail, the energy spread toward the wet ground will be reflected back to the hail and then to the radar. The resulting echo is weak but noticeable. Due to the extra path length it has to go through, it arrives later at the antenna and is placed further than its source. This gives a kind of triangle of false weaker reflections placed radially behind the hail.
Filtering
However, not all non-meteorological targets remain still; one can think of birds for instance. Others, like the bright band, depend on the structure of the precipitations. Polarization offers a direct typing of the echoes which could be used to filter more false data or produce separate images for specialized purposes. This recent development in this field is bound to improve the quality of radar products.
Mesonet
Engineering Research Center for Collaborative Adaptive Sensing of the Atmosphere
The Engineering Research Center for Collaborative Adaptive Sensing of the Atmosphere is a National Science Foundation Engineering Center. The Center brings together a multidisciplinary group of engineers, computer scientists, meteorologists, sociologists, graduate and undergraduate students, as...
(CASA) aims to supplement regular NEXRAD using many low cost X band (3 cm) weather radar mounted on cellular telephone towers. These radars will subdivide the large area of the NEXRAD into smaller domains to look at altitudes below its lowest angle. These will give details not currently available.
Using 3-cm wavelength radars, the antenna of each radar is small (about 1 meter diameter) but the resolution is similar at short distance to that of NEXRAD. The attenuation is significant due to the wavelength used but each point in the coverage area is seen by many radars, each viewing from a different direction and compensating for data lost from others.
Electronic sounding
Timeliness is also a point needing improvement. With 5 to 10 minutes time between complete scans of weather radar, a lot of things can be missed in the development of a thunderstorm. A Phased-array radar is being tested at the National Severe Storms Lab in Norman, Oklahoma, to speed up the gathering of data.Specialized applications
Avionics weather radar
Aircraft application of radar systems include weather radar, collision avoidance, target tracking, ground proximity, and other systems. For commercial Weather Radar Systems, ARINC 708ARINC 708
ARINC 708 is a specification for airborne pulse Doppler weather radar systems primarily found on commercial aircraft. ARINC 708 and the Honeywell Picture bus are the predominant avionics data bus for most aircraft today superseding ARINC 453....
is the primary weather radar system using an airborne pulse-Doppler radar
Pulse-doppler radar
Pulse-Doppler is a 4D radar system capable of detecting both target 3D location as well as measuring radial velocity . It uses the Doppler effect to avoid overloading computers and operators as well as to reduce power consumption...
.
Antennas
Unlike ground weather radar, which is set at a fixed angle, airborne weather radar is being utilized from the nose or wing of an aircraft. Not only will the aircraft be moving up, down, left, and right, but it will be rolling as well. To compensate for this, the antenna is linked and calibrated to the vertical gyro located on the aircraft. By doing this, the pilot is able to set a pitch or angle to the antenna that will enable the stabilizer to keep the antenna pointed in the right direction under moderate maneuvers. The small servo motors will not be able to keep up with too abrupt maneuvers, but it will try. In doing this the pilot is able to adjust the radar so that it will point towards the weather system of interest. If the airplane is at a low altitude, the pilot would want to set the radar at a high angle above the horizon line so that ground clutter is not all that is being displayed on the plan position indicatorPlan position indicator
The plan position indicator , is the most common type of radar display. The radar antenna is usually represented in the center of the display, so the distance from it and height above ground can be drawn as concentric circles...
(PPI). Similarly, if the airplane is at a very high altitude the pilot would want to set the radar at a low or negative angle. The goal here is to point the radar towards the clouds wherever they may be in respect to the aircraft, and if the pilot changes the direction of the airplane the stabilizer will adjust itself accordingly so that the pilot doesn't have to fly with one hand and adjust the radar with the other. The stabilizer is meant to help display the information that the pilot requests, while the airplane is in motion.
Receivers/Transmitters
There are two major systems when talking about the receiver/transmitter: the first is high-powered systems, and the second is low-powered systems; both of which operate in the X-band frequency range (8,000 to 12,500) MHz. High-powered systems operate at power levels between 10,000 and 60,000 watts. These systems consist of magnetrons and vacuum tubes that are fairly expensive (approximately $1,700) and allow for considerable amounts of noise due to irregularities with the system. Thus, these systems are highly dangerous for arcing and are not safe to be used around ground personnel. However, the alternative would be the low-powered systems. These systems operate between 100 to 200 watts, and require a combination of high gain receivers, signal microprocessors, and transistors to operate as effectively as the high-powered systems. The complex microprocessors help to eliminate noise, providing a more accurate and detailed depiction of the sky. Also, since there are fewer irregularities throughout the system, the low-powered radars can be used to detect turbulence via the Doppler Effect. Furthermore, since the low-powered systems operate at considerable less wattage, they are safe from arcing and can be used at virtually all times.Thunderstorm Tracking
Digital radar systems now have capabilities far beyond that of their predecessors. Digital systems now offer thunderstormThunderstorm
A thunderstorm, also known as an electrical storm, a lightning storm, thundershower or simply a storm is a form of weather characterized by the presence of lightning and its acoustic effect on the Earth's atmosphere known as thunder. The meteorologically assigned cloud type associated with the...
tracking surveillance. This provides users with the ability to acquire detailed information of each storm cloud being tracked. Thunderstorms are first identified by matching precipitation raw data received from the radar pulse to some sort of template preprogrammed into the system. In order for a thunderstorm to be identified, it has to meet strict definitions of intensity and shape that set it apart from any non-convective cloud. Usually, it must show signs of organization in the horizontal and continuity in the vertical : a core or a more intense center to be identified and tracked by digital radar tracking systems. Once the thunderstorm cell is identified, speed, distance covered, direction, and Estimated Time of Arrival (ETA) are all tracked and recorded to be utilized later.
Related articles
- BackscatterBackscatterIn physics, backscatter is the reflection of waves, particles, or signals back to the direction they came from. It is a diffuse reflection due to scattering, as opposed to specular reflection like a mirror...
- Barber's pole
- Canadian weather radar networkCanadian weather radar networkThe Canadian weather radar network consists of 31 weather radars spanning Canada's most populated regions. Their primary purpose is the early detection of precipitation, its motion and the threat it poses to life and property...
- Lockheed WP-3D Orion (P-3)
- National Hurricane Research LaboratoryNational Hurricane Research LaboratoryThe National Hurricane Research Laboratory was formed in December 1964 out of the National Hurricane Research Project, the U. S. Weather Bureau's effort to scientifically examine tropical cyclones in order to make better predictions. Laboratory status signified that this effort was now a...
External links
General- List of scientific articles of precipitation measurement by radar
- History of Operational Use of Weather Radar by U. S. Weather Service :
- Part I: The Pre-NEXRAD Era.
- Part II : Development of Operational Doppler Weather Radars
- http://www.magazine.noaa.gov/stories/mag151.htmWeather Radar development (for the USA), highlight of National Severe Storms LaboratoryNational Severe Storms LaboratoryThe National Severe Storms Laboratory is a National Oceanic and Atmospheric Administration weather research laboratory located at the National Weather Center in Norman, Oklahoma....
's first 40 years]
- Weather radars by Environment Canada
- Commons errors in interpreting radar by Environment Canada
- Short weather radar course for teachers by Environment Canada
- Weather Underground on radar
Networks and radar research
- http://arrc.ou.edu/OU's Atmospheric Radar Research CenterAtmospheric Radar Research CenterThe Atmospheric Radar Research Center is an interdisciplinary research center of the University of Oklahoma located at the National Weather Center in Norman, Oklahoma...
] - OU-PRIMEOU-PRIMEOU-PRIME is an advanced Doppler weather radar. It was completed in January 2009 after a ten-month construction period and commissioned on April 4, 2009. It is operated by the Atmospheric Radar Research Center at the University of Oklahoma...
- Canadian weather radar FAQ
- McGill radar homepage
- Hong Kong radar image gallery
- University of Alabama Huntsville C-band Dual-polarimetric research Radar
- http://www.ekco-radar.co.uk/e38/e38.phpAn early Weather radar - The EKCOEKCOEKCO from Eric Kirkham Cole Limited was a British electronics company producing radio and television sets from 1924.Expanding into plastic production for its own use, Ekco Plastics produced both radio cases and later domestic plastic products; the plastics company became Lin Pac Mouldings...
E38 system] - NEXRAD Doppler radar network information:
- POLARIMETRIC RADAR RESEARCH
- NOAA information on radars
- More NOAA info
- NOAA research on radars
Real time data
- European OPERA project -links to all weather radar maps in the World
- RainRadar - Find out what's coming your way, wherever you are
- U.S. doppler radar sites
- Realtime weather radar for South Africa from South African Weather ServiceSouth African Weather ServiceThe South African Weather Service is the meteorological service under the South African government's Department of Environmental Affairs and Tourism. SAWS is a member of the World Meteorological Organization. The agency is similar to the United States' National Weather Service.Under the South...
- Australian radar sites
- El Salvador Marn radar sites