
World energy resources and consumption
Encyclopedia
]

 World energy consumption in 2010: over 5% growth
Energy markets have combined crisis recovery and strong industry dynamism. Energy consumption in the G20 soared by more than 5% in 2010, after the slight decrease of 2009. This strong increase is the result of two converging trends. On the one-hand, industrialized countries, which experienced sharp decreases in energy demand in 2009, recovered firmly in 2010, almost coming back to historical trends. Oil, gas, coal, and electricity markets followed the same trend.
On the other hand, China and India, which showed no signs of slowing down in 2009, continued their intense demand for all forms of energy.
In 2009, world energy consumption decreased for the first time in 30 years (-1.1%) or 130 Mtoe (Megaton oil equivalent), as a result of the financial and economic crisis (GDP drop by 0.6% in 2009).
This evolution is the result of two contrasting trends. Energy consumption growth remained vigorous in several developing countries, specifically in Asia (+4%). Conversely, in OECD, consumption was severely cut by 4.7% in 2009 and was thus almost down to its 2000 levels. In North America, Europe and CIS, consumptions shrank by 4.5%, 5% and 8.5% respectively due to the slowdown in economic activity. China became the world's largest energy consumer (18% of the total) since its consumption surged by 8% during 2009 (up from 4% in 2008).
Oil remained the largest energy source (33%) despite the fact that its share has been decreasing over time.
Coal posted a growing role in the world's energy consumption: in 2009, it accounted for 27% of the total.
In 2008, total worldwide energy consumption was 474 exajoules
(=132,000 TWh). This is equivalent to an average energy consumption rate of 15 terawatts . The potential for renewable energy is: solar energy 1600 EJ (444,000 TWh), wind power
600 EJ (167,000 TWh), geothermal energy 500 EJ (139,000 TWh), biomass
250 EJ (70,000 TWh), hydropower
50 EJ (14,000 TWh) and ocean energy 1 EJ (280 TWh).
More than half of the energy has been consumed in the last two decades since the industrial revolution, despite advances in efficiency and sustainability. According to IEA world statistics in four years (2004–2008) the world population increased 5%, annual CO2 emissions increased 10% and gross energy production increased 10%.
Most energy is used in the country of origin, since it is cheaper to transport final products than raw materials. In 2008 the share export of the total energy production by fuel was: oil 50% (1,952/3,941 Mt), gas 25% (800/3,149 bcm), hard coal 14% (793/5,845 Mt) and electricity 1% (269/20,181 TWh).
Most of the world's energy resources are from the sun's rays hitting earth. Some of that energy has been preserved as fossil energy, some is directly or indirectly usable; for example, via wind, hydro- or wave power. The term solar constant
is the amount of incoming solar electromagnetic radiation per unit area, measured on the outer surface of Earth's atmosphere, in a plane perpendicular to the rays. The solar constant includes all types of solar radiation, not just visible light. It is measured by satellite to be roughly 1366 watts per square meter, though it fluctuates by about 6.9% during a year—from in early January to in early July, due to the Earth's varying distance from the sun, and by a few parts per thousand from day to day. For the whole Earth, with a cross section of , the total energy rate is 174 petawatts , plus or minus 3.5%. This value is the total rate of solar energy received by the planet; about half, 89 PW, reaches the Earth's surface.
The estimates of remaining non-renewable worldwide energy resources vary, with the remaining fossil fuels totaling an estimated 0.4 YJ (1 YJ = 1024J) and the available nuclear fuel such as uranium
exceeding 2.5 YJ. Fossil fuels range from 0.6 to 3 YJ if estimates of reserves of methane clathrates are accurate and become technically extractable. The total energy flux from the sun is 3.8 YJ/yr, dwarfing all non-renewable resources.
From 1990 to 2008 the average use of energy per person as IEA data increased 10 % and the world population increased 27 %. Regional energy use grew from 1990 to 2008: Middle East 170 %, China 146 %, India 91 %, Africa 70 %, Latin America 66 %, USA 20 %, EU-27 7 % and world 39 %
emissions resulting from energy production are a serious global environmental problem. Therefore many nations have signed the UN agreement to prevent a dangerous impact on the world's climate
. What is a dangerous concentration remains a subject of debate. Limiting global temperature rise at 2 degrees Celsius, considered as a high risk level by Stockholm Environmental Institute, demands 75% decline in carbon emissions in the industrial countries by 2050, if the population is 10 mrd in 2050. 75% in 40 years is about 2% decrease every year. As 2011, the warming emissions of energy production continued rising regardless of the consensus of the basic problem. There is a 25–30 years lag in the complete warming effect of emissions. Thus human activities have created already a 1.5 °C temperature rise (2006). According to Robert Engelman
(Worldwatch institute) for security civilization has to stop increase of emissions within a decade regardless of economy and population state (2009).
The United States Energy Information Administration
regularly publishes a report on world consumption for most types of primary energy resources. According to IEA
total world energy supply was 102,569 TWh (1990); 117,687 TWh (2000); 133,602 TWh (2005) and 143,851 TWh (2008). World power generation was 11,821 TWh (1990); 15,395 TWh (2000); 18,258 TWh (2005) and 20,181 TWh (2008). Compared to power supply 20,181 TWh the power end use was only 16,819 TWh in 2008 including EU27: 2 857 TWh, China 2 883 TWh and USA 4 533 TWh. In 2008 energy use per person was in the USA 4.1 fold, EU
1.9 fold and Middle East 1.6 fold the world average and in China 87% and India 30% of the world average.
In 2008 energy supply by power source was oil 33.5%, coal 26.8%, gas 20.8% (fossil 81%), renewable (hydro, solar, wind, geothermal power and biofuels) 12.9%, nuclear 5.8% and other 4%. Oil was the most popular energy fuel. Oil and coal combined represented over 60% of the world energy supply in 2008.
Since the annual energy supply increase has been high, e.g. 2007–2008 4,461 TWh, compared to the total nuclear power end use 2,731 TWh environmental activists, like Greenpeace
, support increase of energy efficiency and renewable energy
capacity. These are also more and more addressed in the international agreements and national Energy Action Plans, like the EU 2009 Renewable Energy Directive and corresponding national plans. The global renewable energy supply increased from 2000 to 2008 in total 3,155 TWh, also more than the nuclear power use 2,731 TWh in 2008. The energy resources below show the extensive reserves of renewable energy.
's 2006 estimate, the estimated 471.8 EJ total consumption in 2004 was divided as follows, with fossil fuels supplying 86% of the world's energy:
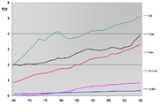
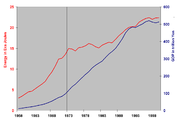
Coal fueled the industrial revolution in the 18th and 19th century. With the advent of the automobile, airplanes and the spreading use of electricity, oil
became the dominant fuel during the twentieth century. The growth of oil as the largest fossil fuel was further enabled by steadily dropping prices from 1920 until 1973. After the oil shocks of 1973
and 1979
, during which the price of oil increased from 5 to 45 US dollars per barrel, there was a shift away from oil. Coal, natural gas, and nuclear became the fuels of choice for electricity generation and conservation measures increased energy efficiency. In the U.S. the average car more than doubled the number of miles per gallon. Japan, which bore the brunt of the oil shocks, made spectacular improvements and now has the highest energy efficiency in the world. From 1965 to 2008, the use of fossil fuels has continued to grow and their share of the energy supply has increased. From 2003 to 2008, coal
was the fastest growing fossil fuel.
In 2000 coal was used in China 28%, other Asia 19%, North America 25% and the EU 14%. In 2009 the share of China was 47%.
Single most coal using country is China. It s share of the world coal production was 28 % in 2000 and 48 % in 2009. Coal use in the world increased 48 % from 2000 to 2009. In practise majority of this growth occurred in China and the rest in other Asia.
The use of oil doubled in China during 2000–2009. In 2009 the consumption of oil was in the EU 1,6 fold and North America 2.5 fold compared to China.
In 2009 the world use of gas was 131% compared to year 2000. 66% of the this growth was outside EU, North America Latin America and Russia. Others include Middle East, Asia and Africa. The gas supply increased also in the previous regions: 8.6% in the EU and 16% in the North America 2000–2009.
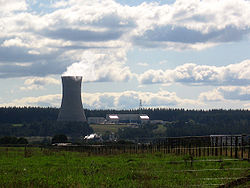
Annual generation of nuclear power has been on a slight downward trend since 2007, decreasing 1.8% in 2009 to 2558 TWh with nuclear power meeting 13–14% of the world's electricity demand.
s such as sunlight
, wind
, rain
, tides, and geothermal heat, which are renewable
(naturally replenished). As of 2010, about 16% of global final energy consumption comes from renewables, with 10% coming from traditional biomass
, which is mainly used for heating, and 3.4% from hydroelectricity
. New renewables (small hydro, modern biomass, wind, solar, geothermal, and biofuels) accounted for another 2.8% and are growing very rapidly. The share of renewables in electricity generation
is around 19%, with 16% of global electricity coming from hydroelectricity and 3% from new renewables.
installed capacity reached 816 GW in 2005, consisting of 750 GW of large plants, and 66 GW of small hydro
installations. Large hydro capacity totaling 10.9 GW was added by China
, Brazil
, and India
during the year, but there was a much faster growth (8%) small hydro, with 5 GW added, mostly in China where some 58% of the world's small hydro plants are now located.
China is the largest hydropower producer in the world, and continues to add capacity. In the Western world
, although Canada
is the largest producer of hydroelectricity in the world, the construction of large hydro plants has stagnated due to environmental concerns. The trend in both Canada and the United States has been to micro hydro
because it has negligible environmental impacts and opens up many more locations for power generation. In British Columbia alone, the estimates are that micro hydro will be able to more than double electricity production in the province.
is growing at the rate of 30% annually, with a worldwide installed capacity of 198 gigawatts (GW) in 2010, and is widely used in Europe
, Asia
, and the United States
. Wind power accounts for approximately 19% of electricity use in Denmark
, 9% in Spain
and Portugal
, and 6% in Germany
and the Republic of Ireland. The United States
is an important growth area and installed U.S. wind power capacity reached 25,170 MW at the end of 2008.
will force production to decline as the remaining reserves dwindle. The rate at which demand increases and reserves dwindle has been increasing dramatically because the rate of consumption is not constant. For example, if demand for oil doubled, reserves would not last as long. In addition, the cost of fossil fuels continues to rise while solar power becomes more economically viable.
Solar photovoltaics is growing rapidly, albeit from a small base, to a total global capacity of 40,000 MW at the end of 2010. More than 100 countries use solar PV. Some 24 GW of solar is projected in November 2011 to be installed in that year, pushing up worldwide capacity to roughly 64 GW. Installations may be ground-mounted (and sometimes integrated with farming and grazing) or built into the roof or walls of a building (building-integrated photovoltaics).
The consumption of solar hot water
and solar space heating
was estimated at 88 GWt (gigawatts of thermal power) in 2004. The heating of water for unglazed swimming pools is excluded.
Geothermal energy
is used commercially in over 70 countries. In the year 2004, 200 PJ (57 TWh) of electricity was generated from geothermal resources, and an additional 270 PJ of geothermal energy was used directly, mostly for space heating. In 2007, the world had a global capacity for 10 GW of electricity generation and an additional 28 GW of direct heating
, including extraction by geothermal heat pumps. Heat pumps are small and widely distributed, so estimates of their total capacity are uncertain and range up to 100 GW.
sources was estimated at 44 GW for 2005. Biomass electricity generation increased by over 100% in Germany
, Hungary
, the Netherlands
, Poland
, and Spain
. A further 220 GW was used for heating (in 2004), bringing the total energy consumed from biomass to around 264 GW. The use of biomass fires for cooking is excluded.
World production of bioethanol
increased by 8% in 2005 to reach 33 billion litre
s (8.72 billion US gallons), with most of the increase in the United States
, bringing it level to the levels of consumption in Brazil
. Biodiesel
increased by 85% to 3.9 billion litres (1.03 billion US gallons), making it the fastest growing renewable energy source in 2005. Over 50% is produced in Germany
.
and Germany
with an energy consumption rate of 6 kW per person and the United States
with an energy consumption rate of 11.4 kW per person. In developing countries, particularly those that are sub-tropical or tropical such as India
, the per person energy use rate is closer to 0.7 kW. Bangladesh
has the lowest consumption rate with 0.2 kW per person.
The US consumes 25% of the world's energy with a share of global GDP at 22% and a share of the world population at 4.59%. The most significant growth of energy consumption is currently taking place in China
, which has been growing at 5.5% per year over the last 25 years. Its population of 1.3 billion people (19.6% of the world population) is consuming energy at a rate of 1.6 kWh per person.
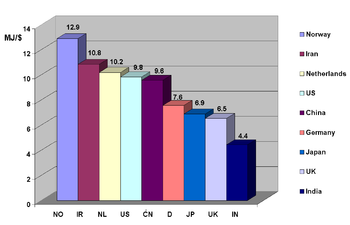
One measurement of efficiency is energy intensity
. This is a measure of the amount of energy it takes a country to produce a dollar of gross domestic product.
Industrial users (agriculture, mining, manufacturing, and construction) consume about 37% of the total 15 TW. Personal and commercial transportation consumes 20%; residential heating, lighting, and appliances use 11%; and commercial uses (lighting, heating and cooling of commercial buildings, and provision of water and sewer services) amount to 5% of the total.
The other 27% of the world's energy is lost in energy transmission and generation. In 2005, global electricity consumption averaged 2 TW. The energy rate used to generate 2 TW of electricity is approximately 5 TW, as the efficiency of a typical existing power plant is around 38%. The new generation of gas-fired plants reaches a substantially higher efficiency of 55%. Coal is the most common fuel for the world's electricity plants.
Total world energy use per sector was in 2008 industry 28%, transport 27% and residential and service 36%. Division was about the same in the year 2000.
sector is responsible for 31.5% of final energy consumption, industry
27.6%, households 25.9%, services 11.4% and agriculture
3.7%. The use of energy is responsible for the majority of greenhouse gas emissions (79%), with the energy sector representing 31%, transport 19%, industry 13%, households 9% and others 7%.
While efficient energy and resource efficiency are growing as public policy issues, more than 70% of coal plants in the European Union
are more than 20 years old and operate at an efficiency level of between 32-40%. Technological developments in the 1990s have allowed efficiencies in the range of 40–45% at newer plants. However, according to an impact assessment by the European Commission
, this is still below the best available technological (BAT) efficiency levels of 46–49%. With gas-fired power plants the average efficiency is 52% compared to 58-59% with best available technology (BAT), and gas and oil boiler plants
operate at average 36% efficiency (BAT delivers 47%). According to that same impact assessment by the European Commission
, raising the efficiency of all new plants and the majority of existing plants, through the setting of authorisation and permit conditions, to an average generation efficiency of 51.5% in 2020 would lead to a reduction in annual consumption of 15 billion m3 of natural gas and 25 Mt of coal.
and Germany
have started to make investments in solar energy, despite their unfavorable geographic locations. Germany is now the largest consumer of photovoltaic cells in the world. Denmark and Germany have installed 3 GW and 17 GW of wind power
respectively. In 2005, wind generated 18.5% of all the electricity in Denmark.
Brazil
invests in ethanol
production from sugar cane, which is now a significant part of the transportation fuel in that country.
Starting in 1965, France
made large investments in nuclear power and to this date three quarters of its electricity comes from nuclear reactors. Switzerland
is planning to cut its energy consumption by more than half to become a 2000-watt society
by 2050 and the United Kingdom
is working towards a zero energy building
standard for all new housing by 2016.
Regional:
Energy by country
Lists:
Energy markets have combined crisis recovery and strong industry dynamism. Energy consumption in the G20 soared by more than 5% in 2010, after the slight decrease of 2009. This strong increase is the result of two converging trends. On the one-hand, industrialized countries, which experienced sharp decreases in energy demand in 2009, recovered firmly in 2010, almost coming back to historical trends. Oil, gas, coal, and electricity markets followed the same trend.
On the other hand, China and India, which showed no signs of slowing down in 2009, continued their intense demand for all forms of energy.
In 2009, world energy consumption decreased for the first time in 30 years (-1.1%) or 130 Mtoe (Megaton oil equivalent), as a result of the financial and economic crisis (GDP drop by 0.6% in 2009).
This evolution is the result of two contrasting trends. Energy consumption growth remained vigorous in several developing countries, specifically in Asia (+4%). Conversely, in OECD, consumption was severely cut by 4.7% in 2009 and was thus almost down to its 2000 levels. In North America, Europe and CIS, consumptions shrank by 4.5%, 5% and 8.5% respectively due to the slowdown in economic activity. China became the world's largest energy consumer (18% of the total) since its consumption surged by 8% during 2009 (up from 4% in 2008).
Oil remained the largest energy source (33%) despite the fact that its share has been decreasing over time.
Coal posted a growing role in the world's energy consumption: in 2009, it accounted for 27% of the total.
In 2008, total worldwide energy consumption was 474 exajoules
Joule
The joule ; symbol J) is a derived unit of energy or work in the International System of Units. It is equal to the energy expended in applying a force of one newton through a distance of one metre , or in passing an electric current of one ampere through a resistance of one ohm for one second...
(=132,000 TWh). This is equivalent to an average energy consumption rate of 15 terawatts . The potential for renewable energy is: solar energy 1600 EJ (444,000 TWh), wind power
Wind power
Wind power is the conversion of wind energy into a useful form of energy, such as using wind turbines to make electricity, windmills for mechanical power, windpumps for water pumping or drainage, or sails to propel ships....
600 EJ (167,000 TWh), geothermal energy 500 EJ (139,000 TWh), biomass
Biomass
Biomass, as a renewable energy source, is biological material from living, or recently living organisms. As an energy source, biomass can either be used directly, or converted into other energy products such as biofuel....
250 EJ (70,000 TWh), hydropower
Hydropower
Hydropower, hydraulic power, hydrokinetic power or water power is power that is derived from the force or energy of falling water, which may be harnessed for useful purposes. Since ancient times, hydropower has been used for irrigation and the operation of various mechanical devices, such as...
50 EJ (14,000 TWh) and ocean energy 1 EJ (280 TWh).
More than half of the energy has been consumed in the last two decades since the industrial revolution, despite advances in efficiency and sustainability. According to IEA world statistics in four years (2004–2008) the world population increased 5%, annual CO2 emissions increased 10% and gross energy production increased 10%.
Most energy is used in the country of origin, since it is cheaper to transport final products than raw materials. In 2008 the share export of the total energy production by fuel was: oil 50% (1,952/3,941 Mt), gas 25% (800/3,149 bcm), hard coal 14% (793/5,845 Mt) and electricity 1% (269/20,181 TWh).
Most of the world's energy resources are from the sun's rays hitting earth. Some of that energy has been preserved as fossil energy, some is directly or indirectly usable; for example, via wind, hydro- or wave power. The term solar constant
Solar constant
The solar constant, a measure of flux density, is the amount of incoming solar electromagnetic radiation per unit area that would be incident on a plane perpendicular to the rays, at a distance of one astronomical unit...
is the amount of incoming solar electromagnetic radiation per unit area, measured on the outer surface of Earth's atmosphere, in a plane perpendicular to the rays. The solar constant includes all types of solar radiation, not just visible light. It is measured by satellite to be roughly 1366 watts per square meter, though it fluctuates by about 6.9% during a year—from in early January to in early July, due to the Earth's varying distance from the sun, and by a few parts per thousand from day to day. For the whole Earth, with a cross section of , the total energy rate is 174 petawatts , plus or minus 3.5%. This value is the total rate of solar energy received by the planet; about half, 89 PW, reaches the Earth's surface.
The estimates of remaining non-renewable worldwide energy resources vary, with the remaining fossil fuels totaling an estimated 0.4 YJ (1 YJ = 1024J) and the available nuclear fuel such as uranium
Uranium
Uranium is a silvery-white metallic chemical element in the actinide series of the periodic table, with atomic number 92. It is assigned the chemical symbol U. A uranium atom has 92 protons and 92 electrons, of which 6 are valence electrons...
exceeding 2.5 YJ. Fossil fuels range from 0.6 to 3 YJ if estimates of reserves of methane clathrates are accurate and become technically extractable. The total energy flux from the sun is 3.8 YJ/yr, dwarfing all non-renewable resources.
| Regional energy use (kWh/capita & TWh) and growth 1990-2008 (%) | |||||||||
|---|---|---|---|---|---|---|---|---|---|
| kWh/capita | Population (million) | Energy use (1,000 TWh TWH TWH or twh could refer to:*Tennessee Walking Horse, a breed of horse* Toronto Western Hospital, a hospital in Toronto, Canada* TWH Bus & Coach, a bus company in Romford, England* Terrawatt-hour, measure of electrical energy, 1012 watt-hours... ) |
|||||||
| 1990 | 2008 | Growth | 1990 | 2008 | Growth | 1990 | 2008 | Growth | |
| USA United States The United States of America is a federal constitutional republic comprising fifty states and a federal district... |
89,021 | 87,216 | - 2 % | 250 | 305 | 22 % | 22.3 | 26.6 | 20 % |
| EU-27 Member State of the European Union A member state of the European Union is a state that is party to treaties of the European Union and has thereby undertaken the privileges and obligations that EU membership entails. Unlike membership of an international organisation, being an EU member state places a country under binding laws in... |
40,240 | 40,821 | 1 % | 473 | 499 | 5 % | 19.0 | 20.4 | 7 % |
| Middle East Middle East The Middle East is a region that encompasses Western Asia and Northern Africa. It is often used as a synonym for Near East, in opposition to Far East... |
19,422 | 34,774 | 79 % | 132 | 199 | 51 % | 2.6 | 6.9 | 170 % |
| China China Chinese civilization may refer to:* China for more general discussion of the country.* Chinese culture* Greater China, the transnational community of ethnic Chinese.* History of China* Sinosphere, the area historically affected by Chinese culture... |
8,839 | 18,608 | 111 % | 1,141 | 1,333 | 17 % | 10.1 | 24.8 | 146 % |
| Latin America Latin America Latin America is a region of the Americas where Romance languages – particularly Spanish and Portuguese, and variably French – are primarily spoken. Latin America has an area of approximately 21,069,500 km² , almost 3.9% of the Earth's surface or 14.1% of its land surface area... |
11,281 | 14,421 | 28 % | 355 | 462 | 30 % | 4.0 | 6.7 | 66 % |
| Africa Africa Africa is the world's second largest and second most populous continent, after Asia. At about 30.2 million km² including adjacent islands, it covers 6% of the Earth's total surface area and 20.4% of the total land area... |
7,094 | 7,792 | 10 % | 634 | 984 | 55 % | 4.5 | 7.7 | 70 % |
| India India India , officially the Republic of India , is a country in South Asia. It is the seventh-largest country by geographical area, the second-most populous country with over 1.2 billion people, and the most populous democracy in the world... |
4,419 | 6,280 | 42 % | 850 | 1,140 | 34 % | 3.8 | 7.2 | 91 % |
| Others* | 25,217 | 23,871 | nd | 1,430 | 1,766 | 23 % | 36.1 | 42.2 | 17 % |
| The World | 19,422 | 21,283 | 10 % | 5,265 | 6,688 | 27 % | 102.3 | 142.3 | 39 % |
Source: IEA/OECD, Population OECD/World Bank
|
|||||||||
From 1990 to 2008 the average use of energy per person as IEA data increased 10 % and the world population increased 27 %. Regional energy use grew from 1990 to 2008: Middle East 170 %, China 146 %, India 91 %, Africa 70 %, Latin America 66 %, USA 20 %, EU-27 7 % and world 39 %
Emissions
The global warmingGlobal warming
Global warming refers to the rising average temperature of Earth's atmosphere and oceans and its projected continuation. In the last 100 years, Earth's average surface temperature increased by about with about two thirds of the increase occurring over just the last three decades...
emissions resulting from energy production are a serious global environmental problem. Therefore many nations have signed the UN agreement to prevent a dangerous impact on the world's climate
Avoiding Dangerous Climate Change
The related terms "avoiding dangerous climate change" and "preventing dangerous anthropogenic interference with the climate system" date to 1995 and earlier, in the Second Assesment Report of the International Panel on Climate Change and previous science it cites.In 2002, the United Nations...
. What is a dangerous concentration remains a subject of debate. Limiting global temperature rise at 2 degrees Celsius, considered as a high risk level by Stockholm Environmental Institute, demands 75% decline in carbon emissions in the industrial countries by 2050, if the population is 10 mrd in 2050. 75% in 40 years is about 2% decrease every year. As 2011, the warming emissions of energy production continued rising regardless of the consensus of the basic problem. There is a 25–30 years lag in the complete warming effect of emissions. Thus human activities have created already a 1.5 °C temperature rise (2006). According to Robert Engelman
Robert Engelman
Robert Engelman is an author and former journalist who writes about the environment and population and serves as the vice president for programs at the Worldwatch Institute...
(Worldwatch institute) for security civilization has to stop increase of emissions within a decade regardless of economy and population state (2009).
Energy supply and end use
Total world energy supply i.e. primary energy (2008) was 143,851 TWh and the end use of energy (2008) was 98,022 TWh. The difference 32 % is energy losses. Energy losses are not constant but depend on the energy source and technology. For example, nuclear power has large energy losses 67 % in 2008 mainly by cooling water warming. In 2008 world nuclear power primary energy was 8,283 TWh (5.8 % - 8,283/143,851) and nuclear power end use (2008) was 2,731 TWh (2.8 % - 2,731/98,022). At least some renewable energy sources have small energy losses. Based on the same statistics as the nuclear power, hydro power would have no energy losses at all. When substituting nuclear power with the renewable energy, the end energy supply is significant. The primary energy supply may reflect the fuel consumption, significant for production and environmental evaluation. From the analytical and statistical point of view one should be aware of these differences that have large significance in the energy ratios, comparisons and evaluation, as shown above.Primary energy
| World energy and power supply (TWh) | ||
|---|---|---|
| Energy | Power | |
| 1990 | 102 569 | 11 821 |
| 2000 | 117 687 | 15 395 |
| 2005 | 133 602 | 18 258 |
| 2008 | 143 851 | 20 181 |
| Source: IEA/OECD | ||
| Energy by power source 2008 | ||
|---|---|---|
| TWh | % | |
| Oil | 48 204 | 33.5% |
| Coal | 38 497 | 26.8% |
| Gas | 30 134 | 20.9% |
| Nuclear | 8 283 | 5.8% |
| Hydro | 3 208 | 2.2% |
| Other RE Renewable energy Renewable energy is energy which comes from natural resources such as sunlight, wind, rain, tides, and geothermal heat, which are renewable . About 16% of global final energy consumption comes from renewables, with 10% coming from traditional biomass, which is mainly used for heating, and 3.4% from... * |
15 284 | 10.6% |
| Others | 241 | 0.2% |
| Total | 143 851 | 100% |
| Source: IEA *`=solar, wind, geothermal and biofuels | ||
The United States Energy Information Administration
Energy Information Administration
The U.S. Energy Information Administration is the statistical and analytical agency within the U.S. Department of Energy. EIA collects, analyzes, and disseminates independent and impartial energy information to promote sound policymaking, efficient markets, and public understanding of energy and...
regularly publishes a report on world consumption for most types of primary energy resources. According to IEA
International Energy Agency
The International Energy Agency is a Paris-based autonomous intergovernmental organization established in the framework of the Organisation for Economic Co-operation and Development in 1974 in the wake of the 1973 oil crisis...
total world energy supply was 102,569 TWh (1990); 117,687 TWh (2000); 133,602 TWh (2005) and 143,851 TWh (2008). World power generation was 11,821 TWh (1990); 15,395 TWh (2000); 18,258 TWh (2005) and 20,181 TWh (2008). Compared to power supply 20,181 TWh the power end use was only 16,819 TWh in 2008 including EU27: 2 857 TWh, China 2 883 TWh and USA 4 533 TWh. In 2008 energy use per person was in the USA 4.1 fold, EU
European Union
The European Union is an economic and political union of 27 independent member states which are located primarily in Europe. The EU traces its origins from the European Coal and Steel Community and the European Economic Community , formed by six countries in 1958...
1.9 fold and Middle East 1.6 fold the world average and in China 87% and India 30% of the world average.
In 2008 energy supply by power source was oil 33.5%, coal 26.8%, gas 20.8% (fossil 81%), renewable (hydro, solar, wind, geothermal power and biofuels) 12.9%, nuclear 5.8% and other 4%. Oil was the most popular energy fuel. Oil and coal combined represented over 60% of the world energy supply in 2008.
Since the annual energy supply increase has been high, e.g. 2007–2008 4,461 TWh, compared to the total nuclear power end use 2,731 TWh environmental activists, like Greenpeace
Greenpeace
Greenpeace is a non-governmental environmental organization with offices in over forty countries and with an international coordinating body in Amsterdam, The Netherlands...
, support increase of energy efficiency and renewable energy
Renewable energy
Renewable energy is energy which comes from natural resources such as sunlight, wind, rain, tides, and geothermal heat, which are renewable . About 16% of global final energy consumption comes from renewables, with 10% coming from traditional biomass, which is mainly used for heating, and 3.4% from...
capacity. These are also more and more addressed in the international agreements and national Energy Action Plans, like the EU 2009 Renewable Energy Directive and corresponding national plans. The global renewable energy supply increased from 2000 to 2008 in total 3,155 TWh, also more than the nuclear power use 2,731 TWh in 2008. The energy resources below show the extensive reserves of renewable energy.
| Regional energy use (kWh/hab) | ||||
|---|---|---|---|---|
| kWh/capita | Population (milj) | |||
| 1990 | 2008 | 1990 | 2008 | |
| USA | 89 021 | 87 216 | 305 | |
| EU-27 | 40 240 | 40 821 | ||
| Middle East | 19 422 | 34 774 | 199 | |
| China | 8 839 | 18 608 | 1 333 | |
| Latin America | 11 281 | 14 421 | 462 | |
| Africa | 7 094 | 7 792 | 984 | |
| India | 4 419 | 6 280 | 1 140 | |
| The World | 19 421 | 21 283 | 6 688 | |
| Source: IEA/OECD, Population OECD/World Bank | ||||
| Fuel type | Average power Power (physics) In physics, power is the rate at which energy is transferred, used, or transformed. For example, the rate at which a light bulb transforms electrical energy into heat and light is measured in watts—the more wattage, the more power, or equivalently the more electrical energy is used per unit... in TW |
||
| 1980 | 2004 | 2006 | |
| Oil Oil An oil is any substance that is liquid at ambient temperatures and does not mix with water but may mix with other oils and organic solvents. This general definition includes vegetable oils, volatile essential oils, petrochemical oils, and synthetic oils.... |
4.38 | 5.58 | 5.74 |
| Gas Gas Gas is one of the three classical states of matter . Near absolute zero, a substance exists as a solid. As heat is added to this substance it melts into a liquid at its melting point , boils into a gas at its boiling point, and if heated high enough would enter a plasma state in which the electrons... |
1.80 | 3.45 | 3.61 |
| Coal Coal Coal is a combustible black or brownish-black sedimentary rock usually occurring in rock strata in layers or veins called coal beds or coal seams. The harder forms, such as anthracite coal, can be regarded as metamorphic rock because of later exposure to elevated temperature and pressure... |
2.34 | 3.87 | 4.27 |
| Hydroelectric | 0.60 | 0.93 | 1.00 |
| Nuclear power Nuclear power Nuclear power is the use of sustained nuclear fission to generate heat and electricity. Nuclear power plants provide about 6% of the world's energy and 13–14% of the world's electricity, with the U.S., France, and Japan together accounting for about 50% of nuclear generated electricity... |
0.25 | 0.91 | 0.93 |
| Geothermal Geothermal Geothermal is related to energy and may refer to:* The geothermal gradient and associated heat flows from within the Earth- Renewable technology :... , wind Wind Wind is the flow of gases on a large scale. On Earth, wind consists of the bulk movement of air. In outer space, solar wind is the movement of gases or charged particles from the sun through space, while planetary wind is the outgassing of light chemical elements from a planet's atmosphere into space... , solar energy, wood Wood Wood is a hard, fibrous tissue found in many trees. It has been used for hundreds of thousands of years for both fuel and as a construction material. It is an organic material, a natural composite of cellulose fibers embedded in a matrix of lignin which resists compression... |
0.02 | 0.13 | 0.16 |
| Total | 9.48 | 15.0 | 15.8 |
| Source: The USA Energy Information Administration Energy Information Administration The U.S. Energy Information Administration is the statistical and analytical agency within the U.S. Department of Energy. EIA collects, analyzes, and disseminates independent and impartial energy information to promote sound policymaking, efficient markets, and public understanding of energy and... |
|||
Fossil fuels
The twentieth century saw a rapid twentyfold increase in the use of fossil fuels. Between 1980 and 2006, the worldwide annual growth rate was 2%. According to the US Energy Information AdministrationEnergy Information Administration
The U.S. Energy Information Administration is the statistical and analytical agency within the U.S. Department of Energy. EIA collects, analyzes, and disseminates independent and impartial energy information to promote sound policymaking, efficient markets, and public understanding of energy and...
's 2006 estimate, the estimated 471.8 EJ total consumption in 2004 was divided as follows, with fossil fuels supplying 86% of the world's energy:
Coal fueled the industrial revolution in the 18th and 19th century. With the advent of the automobile, airplanes and the spreading use of electricity, oil
Petroleum
Petroleum or crude oil is a naturally occurring, flammable liquid consisting of a complex mixture of hydrocarbons of various molecular weights and other liquid organic compounds, that are found in geologic formations beneath the Earth's surface. Petroleum is recovered mostly through oil drilling...
became the dominant fuel during the twentieth century. The growth of oil as the largest fossil fuel was further enabled by steadily dropping prices from 1920 until 1973. After the oil shocks of 1973
1973 oil crisis
The 1973 oil crisis started in October 1973, when the members of Organization of Arab Petroleum Exporting Countries or the OAPEC proclaimed an oil embargo. This was "in response to the U.S. decision to re-supply the Israeli military" during the Yom Kippur war. It lasted until March 1974. With the...
and 1979
1979 energy crisis
The 1979 oil crisis in the United States occurred in the wake of the Iranian Revolution. Amid massive protests, the Shah of Iran, Mohammad Reza Pahlavi, fled his country in early 1979 and the Ayatollah Khomeini soon became the new leader of Iran. Protests severely disrupted the Iranian oil...
, during which the price of oil increased from 5 to 45 US dollars per barrel, there was a shift away from oil. Coal, natural gas, and nuclear became the fuels of choice for electricity generation and conservation measures increased energy efficiency. In the U.S. the average car more than doubled the number of miles per gallon. Japan, which bore the brunt of the oil shocks, made spectacular improvements and now has the highest energy efficiency in the world. From 1965 to 2008, the use of fossil fuels has continued to grow and their share of the energy supply has increased. From 2003 to 2008, coal
Coal
Coal is a combustible black or brownish-black sedimentary rock usually occurring in rock strata in layers or veins called coal beds or coal seams. The harder forms, such as anthracite coal, can be regarded as metamorphic rock because of later exposure to elevated temperature and pressure...
was the fastest growing fossil fuel.
Coal
| Regional coal supply (TWh) and share 2009 (%) | |||||
|---|---|---|---|---|---|
| 2000 | 2008 | 2009* | %* | Change 2000-2009* |
|
| North America | 6,654 | 6,740 | 6,375 | 16% | -2.2 % |
| Asia excl. China | 5,013 | 7,485 | 7,370 | 19% | 18.5 % |
| China | 7,318 | 16,437 | 18,449 | 47% | 87.4 % |
| EU | 3,700 | 3,499 | 3,135 | 8% | -4.4 % |
| Africa | 1,049 | 1,213 | 1,288 | 3% | 1.9 % |
| Russia | 1,387 | 1,359 | 994 | 3% | 3.1 % |
| Others | 1,485 | 1,763 | 1,727 | 4% | 1.9 % |
| Total | 26,607 | 38,497 | 39,340 | 100% | 100 % |
| Source: IEA, *in 2009 BP* Change 2000-2009: Region's share of the world change +12,733 TWh from 2000 to 2009 |
|||||
In 2000 coal was used in China 28%, other Asia 19%, North America 25% and the EU 14%. In 2009 the share of China was 47%.
Single most coal using country is China. It s share of the world coal production was 28 % in 2000 and 48 % in 2009. Coal use in the world increased 48 % from 2000 to 2009. In practise majority of this growth occurred in China and the rest in other Asia.
Oil
| Regional oil supply (TWh) and share 2009 (%) | ||||
|---|---|---|---|---|
| 2000 | 2008 | 2009* | %* | |
| North America | 12,350 | 12,590 | 12,305 | 26% |
| Asia excl. China | 8,510 | 9,217 | 9,620 | 21% |
| China | 2,490 | 4,130 | 4,855 | 10% |
| EU | 7,980 | 8,055 | 8,050 | 17% |
| Africa | 1,482 | 1,624 | 1,730 | 4% |
| Russia | 2,138 | 2,828 | 1,499 | 3% |
| Others | 8,562 | 9,761 | 8,526 | 18% |
| Total | 43,506 | 48,204 | 46,585 | 100% |
| Source: IEA, *in 2009 BP | ||||
The use of oil doubled in China during 2000–2009. In 2009 the consumption of oil was in the EU 1,6 fold and North America 2.5 fold compared to China.
Gas
| Regional gas supply (TWh) | ||||
|---|---|---|---|---|
| 2000 | 2008 | 2009* | % | |
| North America | 7,621 | 7,779 | 8,839 | 28% |
| Asia excl. China | 2,744 | 4,074 | 4,348 | 14% |
| China | 270 | 825 | 1,015 | 3% |
| EU | 4,574 | 5,107 | 4,967 | 16% |
| Africa | 612 | 974 | 1,455 | 5% |
| Russia | 3,709 | 4,259 | 4,209 | 13% |
| Latin America | 1,008 | 1,357 | 958 | 3% |
| Others | 3,774 | 5,745 | 6,047 | 19% |
| Total | 24,312 | 30,134 | 31,837 | 100% |
| Source: IEA, *in 2009 BP | ||||
In 2009 the world use of gas was 131% compared to year 2000. 66% of the this growth was outside EU, North America Latin America and Russia. Others include Middle East, Asia and Africa. The gas supply increased also in the previous regions: 8.6% in the EU and 16% in the North America 2000–2009.
Nuclear power
, the world had 436 reactors. Since commercial nuclear energy began in the mid 1950s, 2008 was the first year that no new nuclear power plant was connected to the grid, although two were connected in 2009.Annual generation of nuclear power has been on a slight downward trend since 2007, decreasing 1.8% in 2009 to 2558 TWh with nuclear power meeting 13–14% of the world's electricity demand.
Renewable energy
Renewable energy comes from natural resourceNatural resource
Natural resources occur naturally within environments that exist relatively undisturbed by mankind, in a natural form. A natural resource is often characterized by amounts of biodiversity and geodiversity existent in various ecosystems....
s such as sunlight
Sunlight
Sunlight, in the broad sense, is the total frequency spectrum of electromagnetic radiation given off by the Sun. On Earth, sunlight is filtered through the Earth's atmosphere, and solar radiation is obvious as daylight when the Sun is above the horizon.When the direct solar radiation is not blocked...
, wind
Wind
Wind is the flow of gases on a large scale. On Earth, wind consists of the bulk movement of air. In outer space, solar wind is the movement of gases or charged particles from the sun through space, while planetary wind is the outgassing of light chemical elements from a planet's atmosphere into space...
, rain
Rain
Rain is liquid precipitation, as opposed to non-liquid kinds of precipitation such as snow, hail and sleet. Rain requires the presence of a thick layer of the atmosphere to have temperatures above the melting point of water near and above the Earth's surface...
, tides, and geothermal heat, which are renewable
Renewable resource
A renewable resource is a natural resource with the ability of being replaced through biological or other natural processes and replenished with the passage of time...
(naturally replenished). As of 2010, about 16% of global final energy consumption comes from renewables, with 10% coming from traditional biomass
Biomass
Biomass, as a renewable energy source, is biological material from living, or recently living organisms. As an energy source, biomass can either be used directly, or converted into other energy products such as biofuel....
, which is mainly used for heating, and 3.4% from hydroelectricity
Hydroelectricity
Hydroelectricity is the term referring to electricity generated by hydropower; the production of electrical power through the use of the gravitational force of falling or flowing water. It is the most widely used form of renewable energy...
. New renewables (small hydro, modern biomass, wind, solar, geothermal, and biofuels) accounted for another 2.8% and are growing very rapidly. The share of renewables in electricity generation
Electricity generation
Electricity generation is the process of generating electric energy from other forms of energy.The fundamental principles of electricity generation were discovered during the 1820s and early 1830s by the British scientist Michael Faraday...
is around 19%, with 16% of global electricity coming from hydroelectricity and 3% from new renewables.
Hydropower
Worldwide hydroelectricityHydroelectricity
Hydroelectricity is the term referring to electricity generated by hydropower; the production of electrical power through the use of the gravitational force of falling or flowing water. It is the most widely used form of renewable energy...
installed capacity reached 816 GW in 2005, consisting of 750 GW of large plants, and 66 GW of small hydro
Small hydro
Small hydro is the development of hydroelectric power on a scale serving a small community or industrial plant. The definition of a small hydro project varies but a generating capacity of up to 10 megawatts is generally accepted as the upper limit of what can be termed small hydro. This may be...
installations. Large hydro capacity totaling 10.9 GW was added by China
China
Chinese civilization may refer to:* China for more general discussion of the country.* Chinese culture* Greater China, the transnational community of ethnic Chinese.* History of China* Sinosphere, the area historically affected by Chinese culture...
, Brazil
Brazil
Brazil , officially the Federative Republic of Brazil , is the largest country in South America. It is the world's fifth largest country, both by geographical area and by population with over 192 million people...
, and India
India
India , officially the Republic of India , is a country in South Asia. It is the seventh-largest country by geographical area, the second-most populous country with over 1.2 billion people, and the most populous democracy in the world...
during the year, but there was a much faster growth (8%) small hydro, with 5 GW added, mostly in China where some 58% of the world's small hydro plants are now located.
China is the largest hydropower producer in the world, and continues to add capacity. In the Western world
Western world
The Western world, also known as the West and the Occident , is a term referring to the countries of Western Europe , the countries of the Americas, as well all countries of Northern and Central Europe, Australia and New Zealand...
, although Canada
Canada
Canada is a North American country consisting of ten provinces and three territories. Located in the northern part of the continent, it extends from the Atlantic Ocean in the east to the Pacific Ocean in the west, and northward into the Arctic Ocean...
is the largest producer of hydroelectricity in the world, the construction of large hydro plants has stagnated due to environmental concerns. The trend in both Canada and the United States has been to micro hydro
Micro hydro
Micro hydro is a term used for hydroelectric power installations that typically produce up to 100 kW of electricity. These installations can provide power to an isolated home or small community, or are sometimes connected to electric power networks....
because it has negligible environmental impacts and opens up many more locations for power generation. In British Columbia alone, the estimates are that micro hydro will be able to more than double electricity production in the province.
Wind power
Wind powerWind power
Wind power is the conversion of wind energy into a useful form of energy, such as using wind turbines to make electricity, windmills for mechanical power, windpumps for water pumping or drainage, or sails to propel ships....
is growing at the rate of 30% annually, with a worldwide installed capacity of 198 gigawatts (GW) in 2010, and is widely used in Europe
Wind power in the European Union
According to the European Wind Energy Association report of February 2011, there are over 12,000 wind turbines in Europe with a total capacity of 84 GW. The European Union accounts for over 98% of that total. In 2010, €12.7 billion was invested in EU wind farms and 9.3 GW of new power capacity was...
, Asia
Wind power in China
At the end of 2010, wind power in the People's Republic of China accounted for 41.8 gigawatts of electricity generating capacity, and China has identified wind power as a key growth component of the country's economy. With its large land mass and long coastline, China has exceptional wind...
, and the United States
Wind power in the United States
As of the third quarter of 2011, the cumulative installed capacity of wind power in the United States was 43,461 megawatts , making it second in the world, behind China. In 2010 wind power accounted for 2.3% of the electricity generated in the United States...
. Wind power accounts for approximately 19% of electricity use in Denmark
Wind power in Denmark
Wind power provided 18.9% of electricity production and 24.1% of generation capacity in Denmark in 2008, Denmark was a pioneer in developing commercial wind power during the 1970s, and today almost half of the wind turbines around the world are produced by Danish manufacturers such as Vestas and...
, 9% in Spain
Wind power in Spain
Spain is the world's fourth biggest producer of wind power, after China, the United States and Germany, with an installed capacity of 19,959 megawatts at the end of 2010, a rise of 1,609 MW for the year...
and Portugal
Wind power in Portugal
In December 2010, there was 3,937 MW of wind power nameplate capacity installed in Portugal. The major wind turbine manufacturers in the Portuguese market are Enercon, Vestas and Gamesa...
, and 6% in Germany
Wind power in Germany
In 2010, the installed capacity of wind power in Germany was 27.2 GW. Wind power currently produces about seven percent of Germany’s total electrical power. More than 21,607 wind turbines are located in the German federal area and the country has plans to build more wind turbines...
and the Republic of Ireland. The United States
Wind power in the United States
As of the third quarter of 2011, the cumulative installed capacity of wind power in the United States was 43,461 megawatts , making it second in the world, behind China. In 2010 wind power accounted for 2.3% of the electricity generated in the United States...
is an important growth area and installed U.S. wind power capacity reached 25,170 MW at the end of 2008.
Solar power
The available solar energy resources are 3.8 YJ/yr (120,000 TW). Less than 0.02% of available resources are sufficient to entirely replace fossil fuels and nuclear power as an energy source. Assuming that our rate of usage in 2005 remains constant, estimated reserves are accurate, and no new unplanned reserves are found, we will run out of conventional oil in 2045, and coal in 2159. In practice, neither will actually run out as natural constraintsHubbert peak theory
The Hubbert peak theory posits that for any given geographical area, from an individual oil-producing region to the planet as a whole, the rate of petroleum production tends to follow a bell-shaped curve...
will force production to decline as the remaining reserves dwindle. The rate at which demand increases and reserves dwindle has been increasing dramatically because the rate of consumption is not constant. For example, if demand for oil doubled, reserves would not last as long. In addition, the cost of fossil fuels continues to rise while solar power becomes more economically viable.
Solar photovoltaics is growing rapidly, albeit from a small base, to a total global capacity of 40,000 MW at the end of 2010. More than 100 countries use solar PV. Some 24 GW of solar is projected in November 2011 to be installed in that year, pushing up worldwide capacity to roughly 64 GW. Installations may be ground-mounted (and sometimes integrated with farming and grazing) or built into the roof or walls of a building (building-integrated photovoltaics).
The consumption of solar hot water
Solar hot water
Solar water heating or solar hot water systems comprise several innovations and many mature renewable energy technologies that have been well established for many years...
and solar space heating
Central solar heating
Central solar heating is the provision of central heating and hot water from solar energy by a system in which the water is heated centrally by arrays of solar thermal collectors and distributed through district heating pipe networks .For block systems, the solar collectors are...
was estimated at 88 GWt (gigawatts of thermal power) in 2004. The heating of water for unglazed swimming pools is excluded.
Geothermal
Geothermal energy
Geothermal power
Geothermal energy is thermal energy generated and stored in the Earth. Thermal energy is the energy that determines the temperature of matter. Earth's geothermal energy originates from the original formation of the planet and from radioactive decay of minerals...
is used commercially in over 70 countries. In the year 2004, 200 PJ (57 TWh) of electricity was generated from geothermal resources, and an additional 270 PJ of geothermal energy was used directly, mostly for space heating. In 2007, the world had a global capacity for 10 GW of electricity generation and an additional 28 GW of direct heating
Geothermal heating
Geothermal heating is the direct use of geothermal energy for heating applications. Humans have taken advantage of geothermal heat this way since the Paleolithic era. Approximately seventy countries made direct use of a total of 270 PJ of geothermal heating in 2004...
, including extraction by geothermal heat pumps. Heat pumps are small and widely distributed, so estimates of their total capacity are uncertain and range up to 100 GW.
Biomass and biofuels
Until the beginning of the nineteenth century biomass was the predominant fuel, today it has only a small share of the overall energy supply. Electricity produced from biomassBiomass
Biomass, as a renewable energy source, is biological material from living, or recently living organisms. As an energy source, biomass can either be used directly, or converted into other energy products such as biofuel....
sources was estimated at 44 GW for 2005. Biomass electricity generation increased by over 100% in Germany
Germany
Germany , officially the Federal Republic of Germany , is a federal parliamentary republic in Europe. The country consists of 16 states while the capital and largest city is Berlin. Germany covers an area of 357,021 km2 and has a largely temperate seasonal climate...
, Hungary
Hungary
Hungary , officially the Republic of Hungary , is a landlocked country in Central Europe. It is situated in the Carpathian Basin and is bordered by Slovakia to the north, Ukraine and Romania to the east, Serbia and Croatia to the south, Slovenia to the southwest and Austria to the west. The...
, the Netherlands
Netherlands
The Netherlands is a constituent country of the Kingdom of the Netherlands, located mainly in North-West Europe and with several islands in the Caribbean. Mainland Netherlands borders the North Sea to the north and west, Belgium to the south, and Germany to the east, and shares maritime borders...
, Poland
Poland
Poland , officially the Republic of Poland , is a country in Central Europe bordered by Germany to the west; the Czech Republic and Slovakia to the south; Ukraine, Belarus and Lithuania to the east; and the Baltic Sea and Kaliningrad Oblast, a Russian exclave, to the north...
, and Spain
Spain
Spain , officially the Kingdom of Spain languages]] under the European Charter for Regional or Minority Languages. In each of these, Spain's official name is as follows:;;;;;;), is a country and member state of the European Union located in southwestern Europe on the Iberian Peninsula...
. A further 220 GW was used for heating (in 2004), bringing the total energy consumed from biomass to around 264 GW. The use of biomass fires for cooking is excluded.
World production of bioethanol
Ethanol fuel
Ethanol fuel is ethanol , the same type of alcohol found in alcoholic beverages. It is most often used as a motor fuel, mainly as a biofuel additive for gasoline. World ethanol production for transport fuel tripled between 2000 and 2007 from 17 billion to more than 52 billion litres...
increased by 8% in 2005 to reach 33 billion litre
Litre
pic|200px|right|thumb|One litre is equivalent to this cubeEach side is 10 cm1 litre water = 1 kilogram water The litre is a metric system unit of volume equal to 1 cubic decimetre , to 1,000 cubic centimetres , and to 1/1,000 cubic metre...
s (8.72 billion US gallons), with most of the increase in the United States
United States
The United States of America is a federal constitutional republic comprising fifty states and a federal district...
, bringing it level to the levels of consumption in Brazil
Brazil
Brazil , officially the Federative Republic of Brazil , is the largest country in South America. It is the world's fifth largest country, both by geographical area and by population with over 192 million people...
. Biodiesel
Biodiesel
Biodiesel refers to a vegetable oil- or animal fat-based diesel fuel consisting of long-chain alkyl esters. Biodiesel is typically made by chemically reacting lipids with an alcohol....
increased by 85% to 3.9 billion litres (1.03 billion US gallons), making it the fastest growing renewable energy source in 2005. Over 50% is produced in Germany
Germany
Germany , officially the Federal Republic of Germany , is a federal parliamentary republic in Europe. The country consists of 16 states while the capital and largest city is Berlin. Germany covers an area of 357,021 km2 and has a largely temperate seasonal climate...
.
By country
Energy consumption is loosely correlated with gross national product and climate, but there is a large difference even between the most highly developed countries, such as JapanJapan
Japan is an island nation in East Asia. Located in the Pacific Ocean, it lies to the east of the Sea of Japan, China, North Korea, South Korea and Russia, stretching from the Sea of Okhotsk in the north to the East China Sea and Taiwan in the south...
and Germany
Germany
Germany , officially the Federal Republic of Germany , is a federal parliamentary republic in Europe. The country consists of 16 states while the capital and largest city is Berlin. Germany covers an area of 357,021 km2 and has a largely temperate seasonal climate...
with an energy consumption rate of 6 kW per person and the United States
Energy use in the United States
The United States is the 2nd largest energy consumer in terms of total use in 2010 . The U.S. ranks seventh in energy consumption per-capita after Canada and a number of small countries....
with an energy consumption rate of 11.4 kW per person. In developing countries, particularly those that are sub-tropical or tropical such as India
India
India , officially the Republic of India , is a country in South Asia. It is the seventh-largest country by geographical area, the second-most populous country with over 1.2 billion people, and the most populous democracy in the world...
, the per person energy use rate is closer to 0.7 kW. Bangladesh
Bangladesh
Bangladesh , officially the People's Republic of Bangladesh is a sovereign state located in South Asia. It is bordered by India on all sides except for a small border with Burma to the far southeast and by the Bay of Bengal to the south...
has the lowest consumption rate with 0.2 kW per person.
The US consumes 25% of the world's energy with a share of global GDP at 22% and a share of the world population at 4.59%. The most significant growth of energy consumption is currently taking place in China
China
Chinese civilization may refer to:* China for more general discussion of the country.* Chinese culture* Greater China, the transnational community of ethnic Chinese.* History of China* Sinosphere, the area historically affected by Chinese culture...
, which has been growing at 5.5% per year over the last 25 years. Its population of 1.3 billion people (19.6% of the world population) is consuming energy at a rate of 1.6 kWh per person.
One measurement of efficiency is energy intensity
Energy intensity
]Energy intensity is a measure of the energy efficiency of a nation's economy. It is calculated as units of energy per unit of GDP.* High energy intensities indicate a high price or cost of converting energy into GDP....
. This is a measure of the amount of energy it takes a country to produce a dollar of gross domestic product.
Oil
| Top 10 oil Oil An oil is any substance that is liquid at ambient temperatures and does not mix with water but may mix with other oils and organic solvents. This general definition includes vegetable oils, volatile essential oils, petrochemical oils, and synthetic oils.... producers (Mt) |
||||||
|---|---|---|---|---|---|---|
| 2005 | 2008 | 2009 | 2010 | Share 2010 |
||
| 1 | Russia | 470 | 485 | 494 | 502 | 13 % |
| 2 | Saudi Arabia Energy in Saudi Arabia Energy in Saudi Arabia describes energy and electricity production, consumption and export in Saudi Arabia.Saudi Arabia is one of the world's largest energy producers, pumping approximately of petroleum... |
519 | 509 | 452 | 471 | 12 % |
| 3 | US | 307 | 300 | 320 | 336 | 8 % |
| 4 | Iran Energy in Iran Energy resources in Iran consist of the third largest oil reserves and the second largest natural gas reserves in the world. Iran is in a constant battle to use its energy resources more effectively in the face of subsidization and the need for technological advances in energy exploration and... |
205 | 214 | 206 | 227 | 6 % |
| 5 | China | 183 | 190 | 194 | 200 | 5 % |
| 6 | Canada | 143 | 155 | 152 | 159 | 4 % |
| 7 | Venezuela Energy in Venezuela Energy in Venezuela describes energy and electricity production, consumption and export from Venezuela. Energy policy of Venezuela describes the the energy policy in the politics of Venezuela more in detail... |
162 | 137 | 126 | 149 | 4 % |
| 8 | Mexico Energy in Mexico Energy in Mexico describes energy and electricity production, consumption and import in Mexico. Energy policy of Mexico will describe the he energy policy in the politics of Mexico more in detail... |
188 | 159 | 146 | 144 | 4 % |
| 9 | UAE Energy in the United Arab Emirates Energy in the United Arab Emirates describes energy and electricity production, consumption and import in the United Arab Emirates . UAE has 7 % of global proved oil reserves, about 100 billion barrels.- Overview :- Oil production :... |
nd | 136 | 120 | 129 | 3 % |
| 10 | Nigeria Energy in Nigeria Energy in Nigeria describes energy and electricity production, consumption and export from Nigeria. Nigeria is a member of the Organisation of the Petroleum Exporting Countries.... |
133 | nd | nd | 130 | 3 % |
| x | Kuwait Energy in Kuwait Kuwait was 9. top oil producer 2009. Kuwait is a member of OPEC. In four years 2004-2008 the population growth of Kuwait was 11 % and the energy export grew 16 %... |
nd | 145 | 124 | nd | nd |
| x | Norway Energy in Norway Since the discovery of North Sea oil in Norwegian waters during the late 1960s, exports of oil and gas have become very important elements of the economy of Norway... |
139 | nd | nd | nd | nd |
| Total | 3,923 | 3,941 | 3,843 | 3,973 | 100 % | |
| Top ten | 62 % | 62 % | 61 % | 62% | 62% | |
Coal
| Top 10 coal producers (Mt) | ||||||
|---|---|---|---|---|---|---|
| 2005 | 2008 | 2009 | 2010 | Share % 2010 |
||
| 1 | China | 2,226 | 2,761 | 2,971 | 3,162 | 44 % |
| 2 | US | 1,028 | 1,076 | 985 | 997 | 14 % |
| 3 | India Energy in India Energy in India describes energy and electricity production, consumption and import in India. Energy policy of India describes the politics of India related to energy. Electricity sector in India is the main article of electricity in India.... |
430 | 521 | 561 | 571 | 8 % |
| 4 | Australia Energy in Australia Energy in Australia describes energy and electricity production, consumption and export in Australia. Energy policy of Australia describes the politics of Australia related to energy.... |
372 | 397 | 399 | 420 | 6 % |
| 5 | Indonesia Energy in Indonesia Energy in Indonesia describes energy and electricity production, consumption and import in Indonesia. In 2009 Indonesia produced oil, coal, natural gas and palm oil, utilized also as energy raw material in 2010. Renewable energy potential in Indonesia is high: solar, wind, hydro and geothermal... |
318 | 284 | 301 | 336 | 5 % |
| 6 | South Africa Energy in South Africa Energy in South Africa describes energy and electricity production, consumption and export in South Africa.South Africa was 6. top hard coal producer in 2009. Hard coal production was 1,620 TWh in 2009 and total energy production 1,995 TWh in 2008. The environmenatal concerns of old abandoned coal... |
315 | 236 | 247 | 255 | 4 % |
| 7 | Russia | 222 | 323 | 297 | 324 | 4 % |
| 8 | Kazakhstan Energy in Kazakhstan Energy in Kazakhstan describes energy and electricity production, consumption and import in Kazakhstan. Energy policy of Kazakhstan describes the politics of Kazakhstan related to energy.Kazakhstan is net energy exporter... |
79 | 108 | 101 | 111 | 2 % |
| 9 | Poland Energy in Poland Energy in Poland describes energy and electricity production, consumption and import in Poland.In 2009, Poland was world's 9th largest hard coal producer... |
160 | 144 | 135 | 134 | 2 % |
| 10 | Colombia | 65 | 79 | 73 | 74 | 1 % |
| Total | 5,878 | 6,796 | 6,903 | 7,229 | 100 % | |
| Top ten | 89 % | 87 % | 88 % | 88% | 88% | |
| * include hard coal and brown coal | ||||||
| Top hard coal importers (Mt) | ||||
|---|---|---|---|---|
| 2005 | 2008 | 2009 | ||
| 1 | Japan | 178 | 186 | 165 |
| 2 | China | 25 | nd | 114 |
| 3 | South Korea Energy in South Korea Energy in South Korea describes energy and electricity production, consumption and import in South Korea. Energy policy of South Korea will describe the politics of South Korea related to energy more in detail. Electricity sector in South Korea will be the main article of electricity in South... |
77 | 100 | 103 |
| 4 | India Energy in India Energy in India describes energy and electricity production, consumption and import in India. Energy policy of India describes the politics of India related to energy. Electricity sector in India is the main article of electricity in India.... |
37 | 58 | 66 |
| 5 | Taiwan | 61 | 66 | 60 |
| 6 | Germany Energy in Germany Energy in Germany describes energy and electricity production, consumption and import in Germany. Energy policy of Germany will describe the politics of Germany related to energy more in detail. Electricity sector in Germany is the main article of electricity in Germany... |
38 | 46 | 38 |
| 7 | United Kingdom | 44 | 43 | 38 |
| 8 | Turkey Energy in Turkey Energy in Turkey describes energy and electricity production, consumption and import in Turkey. Energy policy of Turkey will describe the energy policy in the politics of Turkey more in detail... |
nd | 19 | 20 |
| 9 | Italy Energy in Italy Energy in Italy describes energy and electricity production, consumption and import in Italy. Energy policy of Italy will describe more in detail the politics of Italy related to energy. Electricity sector in Italy is the main article of electricity in Italy.... |
24 | 25 | 19 |
| 10 | Spain Energy in Spain Energy in Spain describes energy and electricity production, consumption and import in Spain.Spain is a member of European Union. In 2009 Spain was among the top natural gas and coal importers. In 2008 Spain was among the top crude oil importers 61 Mt. The net oil import was 77 Mt, since oil... |
25 | 19 | 16 |
| x | France Energy in France Energy in France describes energy and electricity production, consumption and import in France. Energy policy of France will describe more in detail the politics of France related to energy. Electricity sector in France is the main article of electricity in France.-Overview:-Companies:Électricité... |
nd | 21 | nd |
| x | United States | 28 | nd | nd |
| Total | 778 | 778 | 819 | |
| x | Top ten | 69 % | 75 % | 78 % |
| Import of production | 16 % | 13 % | 14 %trees are importent | |
Natural gas
| Top 10 natural gas producers (billion cubic meters) | ||||||
|---|---|---|---|---|---|---|
| 2005 | 2008 | 2009 | 2010 | Share 2010 |
||
| 1 | Russia | 627 | 657 | 589 | 637 | 19.4 % |
| 2 | United States | 517 | 583 | 594 | 613 | 18.7 % |
| 3 | Canada | 187 | 175 | 159 | 160 | 4.9 % |
| 4 | Iran Energy in Iran Energy resources in Iran consist of the third largest oil reserves and the second largest natural gas reserves in the world. Iran is in a constant battle to use its energy resources more effectively in the face of subsidization and the need for technological advances in energy exploration and... |
84 | 121 | 144 | 145 | 4.4 % |
| 5 | Qatar Energy in Qatar Energy in Qatar describe energy issues in Qatar. Qatar is an OPEC member. Energy production in relation to population is remarkable. Qatar is significant producer of natural gas and its production has been increased since 2005.- Natural gas :... |
nd | 79 | 89 | 121 | 3.7 % |
| 6 | Norway Energy in Norway Since the discovery of North Sea oil in Norwegian waters during the late 1960s, exports of oil and gas have become very important elements of the economy of Norway... |
90 | 103 | 106 | 107 | 3.3 % |
| 7 | China | nd | 76 | 90 | 97 | 3.0 % |
| 8 | Netherlands Energy in the Netherlands Energy in the Netherlands describes energy and electricity production, consumption and import in the Netherlands. Energy policy of the Netherlands will describe the politics of the Netherlands related to energy more in detail.... |
79 | 85 | 79 | 89 | 2.7 % |
| 9 | Indonesia Energy in Indonesia Energy in Indonesia describes energy and electricity production, consumption and import in Indonesia. In 2009 Indonesia produced oil, coal, natural gas and palm oil, utilized also as energy raw material in 2010. Renewable energy potential in Indonesia is high: solar, wind, hydro and geothermal... |
77 | 77 | 76 | 88 | 2.7 % |
| 10 | Saudi Arabia Energy in Saudi Arabia Energy in Saudi Arabia describes energy and electricity production, consumption and export in Saudi Arabia.Saudi Arabia is one of the world's largest energy producers, pumping approximately of petroleum... |
70 | nd | nd | 82 | 2.5 % |
| x | Algeria Energy in Algeria Energy in Algeria describes energy and electricity production, consumption and import in Algeria. Energy policy of Algeria will describe the energy policy in the politics of Algeria more in detail. Algeria is an OPEC country.-Overview:-Natural gas:... |
93 | 82 | 81 | nd | nd |
| x | United Kingdom | 93 | nd | nd | nd | nd |
| Total | 2,872 | 3,149 | 3,101 | 3,282 | 100 % | |
| Top ten | 67 % | 65 % | 65 % | 65 % | 65 % | |
| Top 10 natural gas importers (billion cubic meters) | ||||||
|---|---|---|---|---|---|---|
| 2005 | 2008 | 2009 | 2010 | Share 2010 |
||
| 1 | Japan | 81 | 95 | 93 | 99 | 12.1 % |
| 2 | Germany Energy in Germany Energy in Germany describes energy and electricity production, consumption and import in Germany. Energy policy of Germany will describe the politics of Germany related to energy more in detail. Electricity sector in Germany is the main article of electricity in Germany... |
91 | 79 | 83 | 83 | 10.1 % |
| 3 | Italy Energy in Italy Energy in Italy describes energy and electricity production, consumption and import in Italy. Energy policy of Italy will describe more in detail the politics of Italy related to energy. Electricity sector in Italy is the main article of electricity in Italy.... |
73 | 77 | 69 | 75 | 9.1 % |
| 4 | United States | 121 | 84 | 76 | 74 | 9.0 % |
| 5 | France Energy in France Energy in France describes energy and electricity production, consumption and import in France. Energy policy of France will describe more in detail the politics of France related to energy. Electricity sector in France is the main article of electricity in France.-Overview:-Companies:Électricité... |
47 | 44 | 45 | 46 | 5.6 % |
| 6 | South Korea Energy in South Korea Energy in South Korea describes energy and electricity production, consumption and import in South Korea. Energy policy of South Korea will describe the politics of South Korea related to energy more in detail. Electricity sector in South Korea will be the main article of electricity in South... |
29 | 36 | 33 | 43 | 5.2 % |
| 7 | Ukraine Energy in Ukraine Energy in Ukraine describes energy and electricity production, consumption and import in Ukraine.Ukraine has depended on Russia for most energy supplies, especially natural gas There was low prices for natural gas until 2009. Ukraine tries to diversify energy sources.- Overview :-Gas:Ukraine was... |
62 | 53 | 38 | 37 | 4.5 % |
| 8 | Turkey Energy in Turkey Energy in Turkey describes energy and electricity production, consumption and import in Turkey. Energy policy of Turkey will describe the energy policy in the politics of Turkey more in detail... |
27 | 36 | 35 | 37 | 4.5 % |
| 9 | United Kingdom | nd | 26 | 29 | 37 | 4.5 % |
| 10 | Spain Energy in Spain Energy in Spain describes energy and electricity production, consumption and import in Spain.Spain is a member of European Union. In 2009 Spain was among the top natural gas and coal importers. In 2008 Spain was among the top crude oil importers 61 Mt. The net oil import was 77 Mt, since oil... |
33 | 39 | 34 | 36 | 4.4 % |
| x | Netherlands Energy in the Netherlands Energy in the Netherlands describes energy and electricity production, consumption and import in the Netherlands. Energy policy of the Netherlands will describe the politics of the Netherlands related to energy more in detail.... |
23 | nd | nd | nd | nd |
| Total | 838 | 783 | 749 | 820 | 100 % | |
| x | Top ten | 70 % | 73 % | 71 % | 69 % | 69 % |
| Import of production | 29 % | 25 % | 24 % | 25 % | 25 % | |
By sector
| World energy use per sector | ||||
|---|---|---|---|---|
| 2000 | 2008 | 2000 | 2008 | |
| TWh | %* | |||
| Industry | 21,733 | 27,273 | 26.5 | 27.8 |
| Transport | 22,563 | 26,742 | 27.5 | 27.3 |
| Residential and service | 30,555 | 35,319 | 37.3 | 36.0 |
| Non-energy use | 7,119 | 8,688 | 8.7 | 8.9 |
| Total* | 81,970 | 98,022 | 100 | 100 |
| Source: IEA 2010, Total is calculated from the given sectors Numbers are the end use of energy Total world energy supply (2008) 143,851 TWh |
||||
Industrial users (agriculture, mining, manufacturing, and construction) consume about 37% of the total 15 TW. Personal and commercial transportation consumes 20%; residential heating, lighting, and appliances use 11%; and commercial uses (lighting, heating and cooling of commercial buildings, and provision of water and sewer services) amount to 5% of the total.
The other 27% of the world's energy is lost in energy transmission and generation. In 2005, global electricity consumption averaged 2 TW. The energy rate used to generate 2 TW of electricity is approximately 5 TW, as the efficiency of a typical existing power plant is around 38%. The new generation of gas-fired plants reaches a substantially higher efficiency of 55%. Coal is the most common fuel for the world's electricity plants.
Total world energy use per sector was in 2008 industry 28%, transport 27% and residential and service 36%. Division was about the same in the year 2000.
European Union
The European Environmental Agency (EEA) measures final energy consumption (does not include energy used in production and lost in transportation) and finds that the transportTransport
Transport or transportation is the movement of people, cattle, animals and goods from one location to another. Modes of transport include air, rail, road, water, cable, pipeline, and space. The field can be divided into infrastructure, vehicles, and operations...
sector is responsible for 31.5% of final energy consumption, industry
Industry
Industry refers to the production of an economic good or service within an economy.-Industrial sectors:There are four key industrial economic sectors: the primary sector, largely raw material extraction industries such as mining and farming; the secondary sector, involving refining, construction,...
27.6%, households 25.9%, services 11.4% and agriculture
Agriculture
Agriculture is the cultivation of animals, plants, fungi and other life forms for food, fiber, and other products used to sustain life. Agriculture was the key implement in the rise of sedentary human civilization, whereby farming of domesticated species created food surpluses that nurtured the...
3.7%. The use of energy is responsible for the majority of greenhouse gas emissions (79%), with the energy sector representing 31%, transport 19%, industry 13%, households 9% and others 7%.
While efficient energy and resource efficiency are growing as public policy issues, more than 70% of coal plants in the European Union
European Union
The European Union is an economic and political union of 27 independent member states which are located primarily in Europe. The EU traces its origins from the European Coal and Steel Community and the European Economic Community , formed by six countries in 1958...
are more than 20 years old and operate at an efficiency level of between 32-40%. Technological developments in the 1990s have allowed efficiencies in the range of 40–45% at newer plants. However, according to an impact assessment by the European Commission
European Commission
The European Commission is the executive body of the European Union. The body is responsible for proposing legislation, implementing decisions, upholding the Union's treaties and the general day-to-day running of the Union....
, this is still below the best available technological (BAT) efficiency levels of 46–49%. With gas-fired power plants the average efficiency is 52% compared to 58-59% with best available technology (BAT), and gas and oil boiler plants
Boiler (steam generator)
A boiler or steam generator is a device used to create steam by applying heat energy to water. Although the definitions are somewhat flexible, it can be said that older steam generators were commonly termed boilers and worked at low to medium pressure but, at pressures above this, it is more...
operate at average 36% efficiency (BAT delivers 47%). According to that same impact assessment by the European Commission
European Commission
The European Commission is the executive body of the European Union. The body is responsible for proposing legislation, implementing decisions, upholding the Union's treaties and the general day-to-day running of the Union....
, raising the efficiency of all new plants and the majority of existing plants, through the setting of authorisation and permit conditions, to an average generation efficiency of 51.5% in 2020 would lead to a reduction in annual consumption of 15 billion m3 of natural gas and 25 Mt of coal.
Alternative energy paths
DenmarkDenmark
Denmark is a Scandinavian country in Northern Europe. The countries of Denmark and Greenland, as well as the Faroe Islands, constitute the Kingdom of Denmark . It is the southernmost of the Nordic countries, southwest of Sweden and south of Norway, and bordered to the south by Germany. Denmark...
and Germany
Germany
Germany , officially the Federal Republic of Germany , is a federal parliamentary republic in Europe. The country consists of 16 states while the capital and largest city is Berlin. Germany covers an area of 357,021 km2 and has a largely temperate seasonal climate...
have started to make investments in solar energy, despite their unfavorable geographic locations. Germany is now the largest consumer of photovoltaic cells in the world. Denmark and Germany have installed 3 GW and 17 GW of wind power
Wind power
Wind power is the conversion of wind energy into a useful form of energy, such as using wind turbines to make electricity, windmills for mechanical power, windpumps for water pumping or drainage, or sails to propel ships....
respectively. In 2005, wind generated 18.5% of all the electricity in Denmark.
Brazil
Brazil
Brazil , officially the Federative Republic of Brazil , is the largest country in South America. It is the world's fifth largest country, both by geographical area and by population with over 192 million people...
invests in ethanol
Ethanol fuel
Ethanol fuel is ethanol , the same type of alcohol found in alcoholic beverages. It is most often used as a motor fuel, mainly as a biofuel additive for gasoline. World ethanol production for transport fuel tripled between 2000 and 2007 from 17 billion to more than 52 billion litres...
production from sugar cane, which is now a significant part of the transportation fuel in that country.
Starting in 1965, France
France
The French Republic , The French Republic , The French Republic , (commonly known as France , is a unitary semi-presidential republic in Western Europe with several overseas territories and islands located on other continents and in the Indian, Pacific, and Atlantic oceans. Metropolitan France...
made large investments in nuclear power and to this date three quarters of its electricity comes from nuclear reactors. Switzerland
Switzerland
Switzerland name of one of the Swiss cantons. ; ; ; or ), in its full name the Swiss Confederation , is a federal republic consisting of 26 cantons, with Bern as the seat of the federal authorities. The country is situated in Western Europe,Or Central Europe depending on the definition....
is planning to cut its energy consumption by more than half to become a 2000-watt society
2000-watt society
The 2000-watt society is a vision, originated by the Swiss Federal Institute of Technology in Zürich at the end of 1998, in which each person in the developed world would cut their over-all rate of energy use to an average of no more than 2,000 watts The 2000-watt society (2,000-Watt Society) is a...
by 2050 and the United Kingdom
United Kingdom
The United Kingdom of Great Britain and Northern IrelandIn the United Kingdom and Dependencies, other languages have been officially recognised as legitimate autochthonous languages under the European Charter for Regional or Minority Languages...
is working towards a zero energy building
Zero energy building
A zero-energy building, also known as a zero net energy building, Net-Zero Energy Building , or Net Zero Building, is a popular term to describe a building with zero net energy consumption and zero carbon emissions annually. Zero energy buildings can be independent from the energy grid supply...
standard for all new housing by 2016.
See also
- Comparisons of life-cycle greenhouse gas emissionsComparisons of life-cycle greenhouse gas emissionsComparisons of life-cycle greenhouse gas emissions attempt to calculate the emissions of greenhouse gases or solely carbon dioxide over the full life of a power source, from groundbreaking to fuel sources to waste management back to greenfield status....
- Cubic mile of oilCubic mile of oilThe cubic mile of oil is a unit of energy. It was created by Hew Crane of SRI International to aid in public understanding of global-scale energy consumption and resources....
- Domestic Energy ConsumptionDomestic Energy ConsumptionDomestic energy consumption is the amount of energy that is spent on the different appliances used within housing. The amount of energy used per household varies widely depending on the standard of living of the country, climate, and the age and type of residence...
- Earth's energy budgetEarth's energy budgetThe Earth can be considered as a physical system with an energy budget that includes all gains of incoming energy and all losses of outgoing energy. The planet is approximately in equilibrium, so the sum of the gains is approximately equal to the sum of the losses.Note on accompanying images:...
- Electricity generationElectricity generationElectricity generation is the process of generating electric energy from other forms of energy.The fundamental principles of electricity generation were discovered during the 1820s and early 1830s by the British scientist Michael Faraday...
- Electric energy consumption
- Energy developmentEnergy developmentEnergy development is the effort to provide sufficient primary energy sources and secondary energy forms for supply, cost, impact on air pollution and water pollution, mitigation of climate change with renewable energy....
- Energy policyEnergy policyEnergy policy is the manner in which a given entity has decided to address issues of energy development including energy production, distribution and consumption...
- Environmental impact of aviation
- Kardashev scaleKardashev scaleThe Kardashev scale is a method of measuring an advanced civilization's level of technological advancement. The scale is only theoretical and in terms of an actual civilization highly speculative; however, it puts energy consumption of an entire civilization in a cosmic perspective. It was first...
- Peak oilPeak oilPeak oil is the point in time when the maximum rate of global petroleum extraction is reached, after which the rate of production enters terminal decline. This concept is based on the observed production rates of individual oil wells, projected reserves and the combined production rate of a field...
- Sustainable energySustainable energySustainable energy is the provision of energy that meets the needs of the present without compromising the ability of future generations to meet their needs. Sustainable energy sources include all renewable energy sources, such as hydroelectricity, solar energy, wind energy, wave power, geothermal...
- The End of Energy ObesityThe End of Energy ObesityThe End of Energy Obesity: Breaking Today's Energy Addiction for a Prosperous and Secure Tomorrow by Calgary-based energy economist Peter Tertzakian outlines the unsustainable nature of current global energy demand growth and identifies potential solutions, many of which come unexpectedly from...
(book) - A Thousand Barrels a Second: The Coming Oil Break Point and the Challenges Facing an Energy Dependent World (book)
Regional:
- Asian brown cloudAsian brown cloudThe Asian brown cloud is a layer of air pollution that covers parts of South Asia, namely the northern Indian Ocean, India, and Pakistan. Viewed from satellite photos, the cloud appears as a giant brown stain hanging in the air over much of South Asia and the Indian Ocean every year between January...
Energy by country
- Energy use and conservation in the United KingdomEnergy use and conservation in the United KingdomEnergy use in the United Kingdom stood at 3,894.6 kilogrammes of oil equivalent per capita in 2005 compared to a world average of 1,778.0. In 2008, total energy consumed was 9.85 exajoules - around 2% of the estimated 474 EJ worldwide total...
- Energy use in the United StatesEnergy use in the United StatesThe United States is the 2nd largest energy consumer in terms of total use in 2010 . The U.S. ranks seventh in energy consumption per-capita after Canada and a number of small countries....
- Making Sweden an Oil-Free Society
Lists:
- List of countries by carbon dioxide emissions
- List of countries by electricity consumption
- List of countries by electricity production
- List of countries by energy consumption and production
- List of countries by energy intensity
- List of countries by greenhouse gas emissions
- List of countries by renewable electricity production
External links
- World Energy Outlook
- Official Energy Statistics from the US government
- Energy Statistics and News from the European Union
- Annual Energy Review 2006, DOE/EIA-0384(2006), by the U.S. Department of Energy's Energy Information AdministrationEnergy Information AdministrationThe U.S. Energy Information Administration is the statistical and analytical agency within the U.S. Department of Energy. EIA collects, analyzes, and disseminates independent and impartial energy information to promote sound policymaking, efficient markets, and public understanding of energy and...
(PDF) - Statistical Review of World Energy 2009, annual review by BP
- Energy Export Databrowser—A visual review of production and consumption trends for individual nations; data from the British Petroleum Statistical Review.
- Google - public data "Energy use (kg of oil equivalent per capita)"
- World Energy Consumption Figures