
Multivariate normal distribution
Encyclopedia
In probability theory
and statistics
, the multivariate normal distribution or multivariate Gaussian distribution, is a generalization of the one-dimensional (univariate
) normal distribution to higher dimensions. A random vector is said to be multivariate normally distributed if every linear combination
of its components has a univariate normal distribution. The multivariate normal distribution is often used to describe, at least approximately, any set of (possibly) correlated real-valued random variable
s each of which clusters around a mean value.
Probability theory
Probability theory is the branch of mathematics concerned with analysis of random phenomena. The central objects of probability theory are random variables, stochastic processes, and events: mathematical abstractions of non-deterministic events or measured quantities that may either be single...
and statistics
Statistics
Statistics is the study of the collection, organization, analysis, and interpretation of data. It deals with all aspects of this, including the planning of data collection in terms of the design of surveys and experiments....
, the multivariate normal distribution or multivariate Gaussian distribution, is a generalization of the one-dimensional (univariate
Univariate
In mathematics, univariate refers to an expression, equation, function or polynomial of only one variable. Objects of any of these types but involving more than one variable may be called multivariate...
) normal distribution to higher dimensions. A random vector is said to be multivariate normally distributed if every linear combination
Linear combination
In mathematics, a linear combination is an expression constructed from a set of terms by multiplying each term by a constant and adding the results...
of its components has a univariate normal distribution. The multivariate normal distribution is often used to describe, at least approximately, any set of (possibly) correlated real-valued random variable
Random variable
In probability and statistics, a random variable or stochastic variable is, roughly speaking, a variable whose value results from a measurement on some type of random process. Formally, it is a function from a probability space, typically to the real numbers, which is measurable functionmeasurable...
s each of which clusters around a mean value.
Notation and parametrization
The multivariate normal distribution of a k-dimensional random vector can be written in the following notation:-

or to make it explicitly known that X is k-dimensional,-

with k-dimensional mean vector
and k x k covariance matrixCovariance matrixIn probability theory and statistics, a covariance matrix is a matrix whose element in the i, j position is the covariance between the i th and j th elements of a random vector...
Definition
A random vector is said to have the multivariate normal distribution if it satisfies the following equivalent conditions.
- Every linear combination of its components Y = a1X1 + … + akXk is normally distributed. That is, for any constant vector , the random variable has a univariate normal distribution.
- There exists a random ℓ-vector Z, whose components are independent standard normal random variables, a k-vector μ, and a k×ℓ matrix A, such that . Here ℓ is the rankRank (linear algebra)The column rank of a matrix A is the maximum number of linearly independent column vectors of A. The row rank of a matrix A is the maximum number of linearly independent row vectors of A...
of the covariance matrixCovariance matrixIn probability theory and statistics, a covariance matrix is a matrix whose element in the i, j position is the covariance between the i th and j th elements of a random vector...
. Especially in the case of full rank, see the section below on Geometric Interpretation.
- There is a k-vector μ and a symmetric, nonnegative-definite k×k matrix Σ, such that the characteristic functionCharacteristic function (probability theory)In probability theory and statistics, the characteristic function of any random variable completely defines its probability distribution. Thus it provides the basis of an alternative route to analytical results compared with working directly with probability density functions or cumulative...
of X is
-
-

The covariance matrix is allowed to be singular (in which case the corresponding distribution has no density). This case arises frequently in statisticsStatisticsStatistics is the study of the collection, organization, analysis, and interpretation of data. It deals with all aspects of this, including the planning of data collection in terms of the design of surveys and experiments....
; for example, in the distribution of the vector of residualsErrors and residuals in statisticsIn statistics and optimization, statistical errors and residuals are two closely related and easily confused measures of the deviation of a sample from its "theoretical value"...
in the ordinary least squaresOrdinary least squaresIn statistics, ordinary least squares or linear least squares is a method for estimating the unknown parameters in a linear regression model. This method minimizes the sum of squared vertical distances between the observed responses in the dataset and the responses predicted by the linear...
regression. Note also that the Xi are in general not independent; they can be seen as the result of applying the matrix A to a collection of independent Gaussian variables Z.
Non-degenerate case
The multivariate normal distribution is said to be "non-degenerate" when the covariance matrix of the multivariate normal distribution is symmetric and positive definite. In this case the distribution has densityProbability density functionIn probability theory, a probability density function , or density of a continuous random variable is a function that describes the relative likelihood for this random variable to occur at a given point. The probability for the random variable to fall within a particular region is given by the...

where is the determinantDeterminantIn linear algebra, the determinant is a value associated with a square matrix. It can be computed from the entries of the matrix by a specific arithmetic expression, while other ways to determine its value exist as well...
of . Note how the equation above reduces to that of the univariate normal distribution if
  is a
is a  matrix (ie a real number).
Bivariate case
In the 2-dimensional nonsingular case , the probability density functionProbability density functionIn probability theory, a probability density function , or density of a continuous random variable is a function that describes the relative likelihood for this random variable to occur at a given point. The probability for the random variable to fall within a particular region is given by the...
of a vector is-

where ρ is the correlationCorrelationIn statistics, dependence refers to any statistical relationship between two random variables or two sets of data. Correlation refers to any of a broad class of statistical relationships involving dependence....
between X and Y. In this case,-

In the bivariate case, we also have a theorem that makes the first equivalent condition for multivariate normality less restrictive: it is sufficient to verify that countably many distinct linear combinations of X and Y are normal in order to conclude that the vector is bivariate normal.
Degenerate case
If the covariance matrix is not full rank, then the multivariate normal distribution is degenerate and does not have a density. More precisely, it does not have a density with respect to k-dimensional Lebesgue measure (which is the usual measure assumed in calculus-level probability courses). Only random vectors whose distributions are absolutely continuous with respect to a measure are said to have densities (with respect to that measure). To talk about densities but avoid dealing with measure-theoretic complications it can be simpler to restrict attention to a subset of
  of the coordinates of
  such that covariance matrix for this subset is positive definite; then the other coordinates may be thought of as an affine function of the selected coordinates.
To talk about densities meaningfully in the singular case, then, we must select a different base measure. Using the disintegration theoremDisintegration theoremIn mathematics, the disintegration theorem is a result in measure theory and probability theory. It rigorously defines the idea of a non-trivial "restriction" of a measure to a measure zero subset of the measure space in question. It is related to the existence of conditional probability measures...
we can define a restriction of Lebesgue measure to the -dimensional affine subspace of
  where the Gaussian distribution is supported, i.e.
  . With respect to this probability measure the distribution has density:
where is the generalized inverseGeneralized inverseIn mathematics, a generalized inverse or pseudoinverse of a matrix A is a matrix that has some properties of the inverse matrix of A but not necessarily all of them...
and det* is the pseudo-determinantPseudo-determinantIn linear algebra and statistics, the pseudo-determinant is the product of all non-zero eigenvalues of a square matrix. It coincides with the regular determinant when the matrix is non-singular.- Definition :...
.
Likelihood function
If the mean and variance matrix are unknown, a suitable log likelihood function for a single observation 'x' would be:

where x is a vector of real numbers. The complex case would be .
.
Cumulative distribution function
The cumulative distribution functionCumulative distribution functionIn probability theory and statistics, the cumulative distribution function , or just distribution function, describes the probability that a real-valued random variable X with a given probability distribution will be found at a value less than or equal to x. Intuitively, it is the "area so far"...
(cdf) F(x) of a random vector X is defined as the probability that all components of X are less than or equal to the corresponding values in the vector x. Though there is no closed form for F(x), there are a number of algorithms that estimate it numerically.
Normally distributed and independent
If X and Y are normally distributed and independentStatistical independenceIn probability theory, to say that two events are independent intuitively means that the occurrence of one event makes it neither more nor less probable that the other occurs...
, this implies they are "jointly normally distributed", i.e., the pair (X, Y) must have multivariate normal distribution. However, a pair of jointly normally distributed variables need not be independent.
Two normally distributed random variables need not be jointly bivariate normal
The fact that two random variables X and Y both have a normal distribution does not imply that the pair (X, Y) has a joint normal distribution. A simple example is one in which X has a normal distribution with expected value 0 and variance 1, and Y = X if |X| > c and Y = −X if |X| < c, where c > 0. There are similar counterexamples for more than two random variables.
\begin{bmatrix}
\mu_1 \\
\mu_2
\end{bmatrix}
\quad with sizes
 with sizes
then, the distribution of X1 conditional on is multivariate normal where

and covariance matrix
This matrix is the Schur complementSchur complementIn linear algebra and the theory of matrices,the Schur complement of a matrix block is defined as follows.Suppose A, B, C, D are respectivelyp×p, p×q, q×p...
of Σ22 in Σ. This means that to calculate the conditional covariance matrix, one inverts the overall covariance matrix, drops the rows and columns corresponding to the variables being conditioned upon, and then inverts back to get the conditional covariance matrix. Here is the generalized inverseGeneralized inverseIn mathematics, a generalized inverse or pseudoinverse of a matrix A is a matrix that has some properties of the inverse matrix of A but not necessarily all of them...
of
Note that knowing that alters the variance, though the new variance does not depend on the specific value of a; perhaps more surprisingly, the mean is shifted by ; compare this with the situation of not knowing the value of a, in which case X1 would have distribution
 .
.
An interesting fact derived in order to prove this result, is that the random vectors and
and  are independent.
The matrix Σ12Σ22− is known as the matrix of regressionRegression analysisIn statistics, regression analysis includes many techniques for modeling and analyzing several variables, when the focus is on the relationship between a dependent variable and one or more independent variables...
coefficients.
In the bivariate case the conditional distribution of Y given X is
where is the correlation coefficientPearson product-moment correlation coefficientIn statistics, the Pearson product-moment correlation coefficient is a measure of the correlation between two variables X and Y, giving a value between +1 and −1 inclusive...
between X and Y.
Bivariate conditional expectation
In the case

the following result holds
where the final ratio here is called the inverse Mills ratioInverse Mills ratioIn statistics, the inverse Mills ratio, named after John P. Mills, is the ratio of the probability density function to the cumulative distribution function of a distribution....
.
Marginal distributions
To obtain the marginal distribution over a subset of multivariate normal random variables, one only needs to drop the irrelevant variables (the variables that one wants to marginalize out) from the mean vector and the covariance matrix. The proof for this follows from the definitions of multivariate normal distributions and linear algebra.
Example
Let be multivariate normal random variables with mean vector and covariance matrix Σ (Standard parametrization for multivariate normal distribution). Then the joint distribution of is multivariate normal with mean vector and covariance matrix
 .
.
Affine transformation
If is an affine transformationAffine transformationIn geometry, an affine transformation or affine map or an affinity is a transformation which preserves straight lines. It is the most general class of transformations with this property...
of where c is an
  vector of constants and B is a constant
  matrix, then Y has a multivariate normal distribution with expected value and variance BΣBT i.e.,
  . In particular, any subset of the Xi has a marginal distribution that is also multivariate normal.
To see this, consider the following example: to extract the subset (X1, X2, X4)T, use
which extracts the desired elements directly.
Another corollary is that the distribution of , where b is a constant vector of the same length as X and the dot indicates a vector product, is univariate Gaussian with . This result follows by using

and considering only the first component of the product (the first row of B is the vector b). Observe how the positive-definiteness of Σ implies that the variance of the dot product must be positive.
An affine transformation of X such as 2X is not the same as the sum of two independent realisationsSum of normally distributed random variablesIn probability theory, calculation of the sum of normally distributed random variables is an instance of the arithmetic of random variables, which can be quite complex based on the probability distributions of the random variables involved and their relationships.-Independent random variables:If X...
of X.
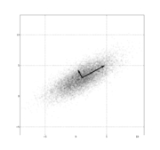
Geometric interpretation
The equidensity contours of a non-singular multivariate normal distribution are ellipsoids (i.e. linear transformations of hypersphereHypersphereIn mathematics, an n-sphere is a generalization of the surface of an ordinary sphere to arbitrary dimension. For any natural number n, an n-sphere of radius r is defined as the set of points in -dimensional Euclidean space which are at distance r from a central point, where the radius r may be any...
s) centered at the mean. The directions of the principal axes of the ellipsoids are given by the eigenvectors of the covariance matrix Σ. The squared relative lengths of the principal axes are given by the corresponding eigenvalues.
If is an eigendecomposition where the columns of U are unit eigenvectors and Λ is a diagonal matrixDiagonal matrixIn linear algebra, a diagonal matrix is a matrix in which the entries outside the main diagonal are all zero. The diagonal entries themselves may or may not be zero...
of the eigenvalues, then we have
Moreover, U can be chosen to be a rotation matrix, as inverting an axis does not have any effect on N(0, Λ), but inverting a column changes the sign of Us determinant. The distribution N(μ, Σ) is in effect N(0, I) scaled by Λ1/2, rotated by U and translated by μ.
Conversely, any choice of μ, full rank matrix U, and positive diagonal entries Λi yields a non-singular multivariate normal distribution. If any Λi is zero and U is square, the resulting covariance matrix UΛUT is singular. Geometrically this means that every contour ellipsoid is infinitely thin and has zero volume in n-dimensional space, as at least one of the principal axes has length of zero.
Correlations and independence
In general, random variables may be uncorrelated but highly dependent. But if a random vector has a multivariate normal distribution then any two or more of its components that are uncorrelated are independentStatistical independenceIn probability theory, to say that two events are independent intuitively means that the occurrence of one event makes it neither more nor less probable that the other occurs...
. This implies that any two or more of its components that are pairwise independentPairwise independenceIn probability theory, a pairwise independent collection of random variables is a set of random variables any two of which are independent. Any collection of mutually independent random variables is pairwise independent, but some pairwise independent collections are not mutually independent...
are independent.
But it is not true that two random variables that are (separately, marginally) normally distributed and uncorrelated are independent. Two random variables that are normally distributed may fail to be jointly normally distributed, i.e., the vector whose components they are may fail to have a multivariate normal distribution. For an example of two normally distributed random variables that are uncorrelated but not independent, see normally distributed and uncorrelated does not imply independentNormally distributed and uncorrelated does not imply independentIn probability theory, two random variables being uncorrelated does not imply their independence. In some contexts, uncorrelatedness implies at least pairwise independence ....
.
Higher moments
The kth-order momentsMoment (mathematics)In mathematics, a moment is, loosely speaking, a quantitative measure of the shape of a set of points. The "second moment", for example, is widely used and measures the "width" of a set of points in one dimension or in higher dimensions measures the shape of a cloud of points as it could be fit by...
of X are defined by

where
The central k-order central moments are given as follows
(a) If k is odd, .
(b) If k is even with , then

where the sum is taken over all allocations of the set into λ (unordered) pairs. That is, if you have a kth central moment, you will be summing the products of covariances (the -μ notation has been dropped in the interests of parsimony):

This yields terms in the sum (15 in the above case), each being the product of λ (in this case 3) covariances. For fourth order moments (four variables) there are three terms. For sixth-order moments there are 3 × 5 = 15 terms, and for eighth-order moments there are 3 × 5 × 7 = 105 terms.
The covariances are then determined by replacing the terms of the list by the corresponding terms of the list consisting of r1 ones, then r2 twos, etc.. To illustrate this, examine the following 4th-order central moment case:


where σij is the covariance of Xi and Xj. The idea with the above method is you first find the general case for a kth moment where you have k different X variables - and then you can simplify this accordingly. Say, you have
  then you simply let and realise that .
Kullback–Leibler divergence
The Kullback–Leibler divergenceKullback–Leibler divergenceIn probability theory and information theory, the Kullback–Leibler divergence is a non-symmetric measure of the difference between two probability distributions P and Q...
from to
to  , for non-singular matrices Σ0 and Σ1, is:

The logarithmLogarithmThe logarithm of a number is the exponent by which another fixed value, the base, has to be raised to produce that number. For example, the logarithm of 1000 to base 10 is 3, because 1000 is 10 to the power 3: More generally, if x = by, then y is the logarithm of x to base b, and is written...
must be taken to base eE (mathematical constant)The mathematical constant ' is the unique real number such that the value of the derivative of the function at the point is equal to 1. The function so defined is called the exponential function, and its inverse is the natural logarithm, or logarithm to base...
since the two terms following the logarithm are themselves base-e logarithms of expressions that are either factors of the density function or otherwise arise naturally. The equation therefore gives a result measured in natsNat (information)A nat is a logarithmic unit of information or entropy, based on natural logarithms and powers of e, rather than the powers of 2 and base 2 logarithms which define the bit. The nat is the natural unit for information entropy...
. Dividing the entire expression above by loge 2 yields the divergence in bitBitA bit is the basic unit of information in computing and telecommunications; it is the amount of information stored by a digital device or other physical system that exists in one of two possible distinct states...
s.
Estimation of parameters
The derivation of the maximum-likelihoodMaximum likelihoodIn statistics, maximum-likelihood estimation is a method of estimating the parameters of a statistical model. When applied to a data set and given a statistical model, maximum-likelihood estimation provides estimates for the model's parameters....
estimatorEstimatorIn statistics, an estimator is a rule for calculating an estimate of a given quantity based on observed data: thus the rule and its result are distinguished....
of the covariance matrix of a multivariate normal distribution is perhaps surprisingly subtle and elegant. See estimation of covariance matricesEstimation of covariance matricesIn statistics, sometimes the covariance matrix of a multivariate random variable is not known but has to be estimated. Estimation of covariance matrices then deals with the question of how to approximate the actual covariance matrix on the basis of a sample from the multivariate distribution...
.
In short, the probability density function (pdf) of an N-dimensional multivariate normal is

and the ML estimator of the covariance matrix from a sample of n observations is

which is simply the sample covariance matrix. This is a biased estimator whose expectation is

An unbiased sample covariance is

The Fisher information matrix for estimating the parameters of a multivariate normal distribution has a closed form expression. This can be used, for example, to compute the Cramér–Rao bound for parameter estimation in this setting. See Fisher information for more details.
Entropy
The differential entropyDifferential entropyDifferential entropy is a concept in information theory that extends the idea of entropy, a measure of average surprisal of a random variable, to continuous probability distributions.-Definition:...
of the multivariate normal distribution is
where is the determinantDeterminantIn linear algebra, the determinant is a value associated with a square matrix. It can be computed from the entries of the matrix by a specific arithmetic expression, while other ways to determine its value exist as well...
of the covariance matrix Σ.
Multivariate normality tests
Multivariate normality tests check a given set of data for similarity to the multivariate normal distribution. The null hypothesisNull hypothesisThe practice of science involves formulating and testing hypotheses, assertions that are capable of being proven false using a test of observed data. The null hypothesis typically corresponds to a general or default position...
is that the data setData setA data set is a collection of data, usually presented in tabular form. Each column represents a particular variable. Each row corresponds to a given member of the data set in question. Its values for each of the variables, such as height and weight of an object or values of random numbers. Each...
is similar to the normal distribution, therefore a sufficiently small p-valueP-valueIn statistical significance testing, the p-value is the probability of obtaining a test statistic at least as extreme as the one that was actually observed, assuming that the null hypothesis is true. One often "rejects the null hypothesis" when the p-value is less than the significance level α ,...
indicates non-normal data. Multivariate normality tests include the Cox-Small test
and Smith and Jain's adaptation of the Friedman-Rafsky test.
Mardia's test is based on multivariate extensions of skewnessSkewnessIn probability theory and statistics, skewness is a measure of the asymmetry of the probability distribution of a real-valued random variable. The skewness value can be positive or negative, or even undefined...
and kurtosisKurtosisIn probability theory and statistics, kurtosis is any measure of the "peakedness" of the probability distribution of a real-valued random variable...
measures. For a sample {x1, ..., xn} of p-dimensional vectors we compute-
Under the null hypothesis of multivariate normality, the statistic A will have approximately a chi-squared distribution with degrees of freedom, and B will be approximately standard normal N(0,1).
Mardia's kurtosis statistic is skewed and converges very slowly to the limiting normal distribution. For medium size samples , the parameters of the asymptotic distribution of the kurtosis statistic are modified For small sample tests (
 ) empirical critical values are used. Tables of critical values for both statistics are given by Rencher for d=2,3,4.
Mardia's tests are affine invariant but not consistent. For example, the multivariate skewness test is not consistent against
symmetric non-normal alternatives.
The BHEP test computes the norm of the difference between the empirical characteristic functionCharacteristic function (probability theory)In probability theory and statistics, the characteristic function of any random variable completely defines its probability distribution. Thus it provides the basis of an alternative route to analytical results compared with working directly with probability density functions or cumulative...
and the theoretical characteristic function of the normal distribution. Calculation of the norm is performed in the L2(μ)Lp spaceIn mathematics, the Lp spaces are function spaces defined using a natural generalization of the p-norm for finite-dimensional vector spaces...
space of square-integrable functions with respect to the Gaussian weighting function . The test statistic is
-

The limiting distribution of this test statistic is a weighted sum of chi-squared random variables, however in practice it is more convenient to compute the sample quantiles using the Monte-Carlo simulations.
A detailed survey of these and other test procedures is given by .
Drawing values from the distribution
A widely used method for drawing a random vector X from the N-dimensional multivariate normal distribution with mean vector μ and covariance matrixCovariance matrixIn probability theory and statistics, a covariance matrix is a matrix whose element in the i, j position is the covariance between the i th and j th elements of a random vector...
Σ works as follows:
- Find any real matrix A such that . When Σ is positive-definite, the Cholesky decompositionCholesky decompositionIn linear algebra, the Cholesky decomposition or Cholesky triangle is a decomposition of a Hermitian, positive-definite matrix into the product of a lower triangular matrix and its conjugate transpose. It was discovered by André-Louis Cholesky for real matrices...
is typically used. In the more general nonnegative-definite case, one can use the matrix A = UΛ½ obtained from a spectral decomposition Σ = UΛUT of Σ. - Let be a vector whose components are N independentStatistical independenceIn probability theory, to say that two events are independent intuitively means that the occurrence of one event makes it neither more nor less probable that the other occurs...
standard normal variates (which can be generated, for example, by using the Box–Muller transform). - Let X be . This has the desired distribution due to the affine transformation property.
See also
- Chi distribution, the pdfProbability density functionIn probability theory, a probability density function , or density of a continuous random variable is a function that describes the relative likelihood for this random variable to occur at a given point. The probability for the random variable to fall within a particular region is given by the...
of the 2-norm (or Euclidean norm) of a multivariate normally-distributed vector. - Complex normal distributionComplex normal distributionIn probability theory, the family of complex normal distributions consists of complex random variables whose real and imaginary parts are jointly normal. The complex normal family has three parameters: location parameter μ, covariance matrix Γ, and the relation matrix C...
, for the generalization to complex valued random variables. - Multivariate stable distribution extension of the multivariate normal distribution, when the index (exponent in the characteristic function) is between zero to two.
- Mahalanobis distanceMahalanobis distanceIn statistics, Mahalanobis distance is a distance measure introduced by P. C. Mahalanobis in 1936. It is based on correlations between variables by which different patterns can be identified and analyzed. It gauges similarity of an unknown sample set to a known one. It differs from Euclidean...
- Wishart distribution
Literature
- Find any real matrix A such that . When Σ is positive-definite, the Cholesky decomposition
-
-
-
-
-
-

