
Cumulative distribution function
Encyclopedia
Probability theory
Probability theory is the branch of mathematics concerned with analysis of random phenomena. The central objects of probability theory are random variables, stochastic processes, and events: mathematical abstractions of non-deterministic events or measured quantities that may either be single...
and statistics
Statistics
Statistics is the study of the collection, organization, analysis, and interpretation of data. It deals with all aspects of this, including the planning of data collection in terms of the design of surveys and experiments....
, the cumulative distribution function (CDF), or just distribution function, describes the probability that a real-valued random variable
Random variable
In probability and statistics, a random variable or stochastic variable is, roughly speaking, a variable whose value results from a measurement on some type of random process. Formally, it is a function from a probability space, typically to the real numbers, which is measurable functionmeasurable...
X with a given probability distribution
Probability distribution
In probability theory, a probability mass, probability density, or probability distribution is a function that describes the probability of a random variable taking certain values....
will be found at a value less than or equal to x. Intuitively, it is the "area so far" function of the probability distribution. Cumulative distribution functions are also used to specify the distribution of multivariate random variables.
Definition
For every real numberReal number
In mathematics, a real number is a value that represents a quantity along a continuum, such as -5 , 4/3 , 8.6 , √2 and π...
x, the cumulative distribution function of a real-valued random variable
Random variable
In probability and statistics, a random variable or stochastic variable is, roughly speaking, a variable whose value results from a measurement on some type of random process. Formally, it is a function from a probability space, typically to the real numbers, which is measurable functionmeasurable...
X is given by
where the right-hand side represents the probability
Probability
Probability is ordinarily used to describe an attitude of mind towards some proposition of whose truth we arenot certain. The proposition of interest is usually of the form "Will a specific event occur?" The attitude of mind is of the form "How certain are we that the event will occur?" The...
that the random variable X takes on a value less than or
equal to x. The probability that X lies in the interval
Interval (mathematics)
In mathematics, a interval is a set of real numbers with the property that any number that lies between two numbers in the set is also included in the set. For example, the set of all numbers satisfying is an interval which contains and , as well as all numbers between them...
(a, b

Here the notation (a, b
If treating several random variables X, Y, ... etc. the corresponding letters are used as subscripts while, if treating only one, the subscript is omitted. It is conventional to use a capital F for a cumulative distribution function, in contrast to the lower-case f used for probability density function
Probability density function
In probability theory, a probability density function , or density of a continuous random variable is a function that describes the relative likelihood for this random variable to occur at a given point. The probability for the random variable to fall within a particular region is given by the...
s and probability mass function
Probability mass function
In probability theory and statistics, a probability mass function is a function that gives the probability that a discrete random variable is exactly equal to some value...
s. This applies when discussing general distributions: some specific distributions have their own conventional notation, for example the normal distribution.
The CDF of a continuous random variable X can be defined in terms of its probability density function
Probability density function
In probability theory, a probability density function , or density of a continuous random variable is a function that describes the relative likelihood for this random variable to occur at a given point. The probability for the random variable to fall within a particular region is given by the...
ƒ as follows:
Note that in the definition above, the "less than or equal to" sign, "≤", is a convention, not a universally used one (e.g. Hungarian literature uses "<"), but is important for discrete distributions. The proper use of tables of the binomial and Poisson distribution
Poisson distribution
In probability theory and statistics, the Poisson distribution is a discrete probability distribution that expresses the probability of a given number of events occurring in a fixed interval of time and/or space if these events occur with a known average rate and independently of the time since...
s depend upon this convention. Moreover, important formulas like Levy's
Paul Pierre Lévy
Paul Pierre Lévy was a Jewish French mathematician who was active especially in probability theory, introducing martingales and Lévy flights...
inversion formula for the characteristic function also rely on the "less or equal" formulation.
In the case of a random variable X which has distribution having a discrete component at a value x0,

where F(x-) denotes the limit from the left of F at x0: i.e. lim F(y) as y increases towards x0.
Properties
Every cumulative distribution function F is (not necessarily strictly) monotone non-decreasing (see monotone increasing) and right-continuous.Furthermore,
Every function with these four properties is a CDF. The properties imply that all CDFs are càdlàg
Càdlàg
In mathematics, a càdlàg , RCLL , or corlol function is a function defined on the real numbers that is everywhere right-continuous and has left limits everywhere...
functions.
If X is a purely discrete random variable, then it attains values x1, x2, ... with probability pi = P(xi), and the CDF of X will be discontinuous at the points xi and constant in between:

If the CDF F of X is continuous
Continuous function
In mathematics, a continuous function is a function for which, intuitively, "small" changes in the input result in "small" changes in the output. Otherwise, a function is said to be "discontinuous". A continuous function with a continuous inverse function is called "bicontinuous".Continuity of...
, then X is a continuous random variable; if furthermore F is absolutely continuous
Absolute continuity
In mathematics, the relationship between the two central operations of calculus, differentiation and integration, stated by fundamental theorem of calculus in the framework of Riemann integration, is generalized in several directions, using Lebesgue integration and absolute continuity...
, then there exists a Lebesgue-integrable function f(x) such that

for all real numbers a and b. (The first of the two equalities displayed above would not be correct in general if we had not said that the distribution is continuous. Continuity of the distribution implies that P (X = a) = P (X = b) = 0, so the difference between "<" and "≤" ceases to be important in this context.) The function f is equal to the derivative
Derivative
In calculus, a branch of mathematics, the derivative is a measure of how a function changes as its input changes. Loosely speaking, a derivative can be thought of as how much one quantity is changing in response to changes in some other quantity; for example, the derivative of the position of a...
of F almost everywhere
Almost everywhere
In measure theory , a property holds almost everywhere if the set of elements for which the property does not hold is a null set, that is, a set of measure zero . In cases where the measure is not complete, it is sufficient that the set is contained within a set of measure zero...
, and it is called the probability density function
Probability density function
In probability theory, a probability density function , or density of a continuous random variable is a function that describes the relative likelihood for this random variable to occur at a given point. The probability for the random variable to fall within a particular region is given by the...
of the distribution of X.
Point probability
The "point probability" that X is exactly b can be found as
Kolmogorov–Smirnov and Kuiper's tests
The Kolmogorov–Smirnov test is based on cumulative distribution functions and can be used to test to see whether two empirical distributions are different or whether an empirical distribution is different from an ideal distribution. The closely related Kuiper's testKuiper's test
Kuiper's test is used in statistics to test that whether a given distribution, or family of distributions, is contradicted by evidence from a sample of data. It is named after Dutch mathematician Nicolaas Kuiper....
is useful if the domain of the distribution is cyclic as in day of the week. For instance we might use Kuiper's test to see if the number of tornadoes varies during the year or if sales of a product vary by day of the week or day of the month.
Complementary cumulative distribution function (tail distribution)
Sometimes, it is useful to study the opposite question and ask how often the random variable is above a particular level. This is called the complementary cumulative distribution function (ccdf) or simply the tail distribution or exceedance, and is defined as
This has applications in statistical
Statistics
Statistics is the study of the collection, organization, analysis, and interpretation of data. It deals with all aspects of this, including the planning of data collection in terms of the design of surveys and experiments....
hypothesis testing, for example, because one-sided P-value
P-value
In statistical significance testing, the p-value is the probability of obtaining a test statistic at least as extreme as the one that was actually observed, assuming that the null hypothesis is true. One often "rejects the null hypothesis" when the p-value is less than the significance level α ,...
is the probability of observing a test statistic at least as extreme as the one observed; hence, the one-sided P-value
P-value
In statistical significance testing, the p-value is the probability of obtaining a test statistic at least as extreme as the one that was actually observed, assuming that the null hypothesis is true. One often "rejects the null hypothesis" when the p-value is less than the significance level α ,...
is simply given by the ccdf.
In survival analysis
Survival analysis
Survival analysis is a branch of statistics which deals with death in biological organisms and failure in mechanical systems. This topic is called reliability theory or reliability analysis in engineering, and duration analysis or duration modeling in economics or sociology...
,
 is called the survival function
Survival function
The survival function, also known as a survivor function or reliability function, is a property of any random variable that maps a set of events, usually associated with mortality or failure of some system, onto time. It captures the probability that the system will survive beyond a specified time...
and denoted
 , while the term reliability function is common in engineering
Engineering
Engineering is the discipline, art, skill and profession of acquiring and applying scientific, mathematical, economic, social, and practical knowledge, in order to design and build structures, machines, devices, systems, materials and processes that safely realize improvements to the lives of...
.
Properties
- For a non-negative random variable having an expectation, Markov's inequalityMarkov's inequalityIn probability theory, Markov's inequality gives an upper bound for the probability that a non-negative function of a random variable is greater than or equal to some positive constant...
states that:
- As
 , and in fact
Proof: Assuming X has density function f, we have for any


Recognizing
 and rearranging terms:
as claimed.
Folded cumulative distribution
thus using two scales, one for the upslope and another for the downslope. This form of illustration emphasises the median and dispersion of the distribution or of the empirical results.
Examples
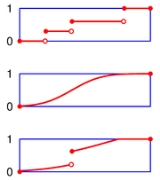
As an example, suppose X is uniformly distributedUniform distribution (continuous)
In probability theory and statistics, the continuous uniform distribution or rectangular distribution is a family of probability distributions such that for each member of the family, all intervals of the same length on the distribution's support are equally probable. The support is defined by...
on the unit interval [0, 1].
Then the CDF of X is given by
Suppose instead that X takes only the discrete values 0 and 1, with equal probability.
Then the CDF of X is given by
Inverse distribution function (quantile function)
If the CDF F is strictly increasing and continuous then is the unique real number
  such that
  .
.Unfortunately, the distribution does not, in general, have an inverse. One may define, for
 , the generalized inverse distribution function:
- Example 1: The median is
 .
. - Example 2: Put
 . Then we call
  the 95th percentile.
The inverse of the cdf is called the quantile function
Quantile function
In probability and statistics, the quantile function of the probability distribution of a random variable specifies, for a given probability, the value which the random variable will be at, or below, with that probability...
.
The inverse of the cdf can be used to translate results obtained for the uniform distribution to other distributions. Some useful properties of the inverse cdf are:
-
 is nondecreasing
 -

-

-
 if and only if
- If
 has a
has a  distribution then
  is distributed as
  . This is used in random number generationRandom number generationA random number generator ) is a computational or physical device designed to generate a sequence of numbers or symbols that lack any pattern, i.e. appear random....
using the inverse transform sampling-method. - If
 is a collection of independent
  -distributed random variables defined on the same sample space, then there exist random variables
  such that
  is distributed as
  and
and  with probability 1 for all
  .
.
Multivariate case
When dealing simultaneously with more than one random variable the joint cumulative distribution function can also be defined. For example, for a pair of random variables X,Y, the joint CDF is given by
where the right-hand side represents the probability
Probability
Probability is ordinarily used to describe an attitude of mind towards some proposition of whose truth we arenot certain. The proposition of interest is usually of the form "Will a specific event occur?" The attitude of mind is of the form "How certain are we that the event will occur?" The...
that the random variable X takes on a value less than or
equal to x and that Y takes on a value less than or
equal to y.
Every multivariate CDF is:
- Monotonically non-decreasing for each of its variables
- Right-continuous for each of its variables.
-
-
 and
and 
See also
- Descriptive statisticsDescriptive statisticsDescriptive statistics quantitatively describe the main features of a collection of data. Descriptive statistics are distinguished from inferential statistics , in that descriptive statistics aim to summarize a data set, rather than use the data to learn about the population that the data are...
- Empirical distribution functionEmpirical distribution functionIn statistics, the empirical distribution function, or empirical cdf, is the cumulative distribution function associated with the empirical measure of the sample. This cdf is a step function that jumps up by 1/n at each of the n data points. The empirical distribution function estimates the true...
- Cumulative frequency analysisCumulative frequency analysisCumulative frequency analysis is the applcation of estimation theory to exceedance probability . The complement, the non-exceedance probability concerns the frequency of occurrence of values of a phenomenon staying below a reference value. The phenomenon may be time or space dependent...
- Q-Q plotQ-Q plotIn statistics, a Q-Q plot is a probability plot, which is a graphical method for comparing two probability distributions by plotting their quantiles against each other. First, the set of intervals for the quantiles are chosen...
- Ogive
- Single crossing conditionSingle crossing conditionIn economics, the single-crossing condition or single-crossing property refers to how the probability distribution of outcomes changes as a function of an input and a parameter....