

Demographics of Ukraine
Encyclopedia
The Demographics of Ukraine is about the demographic
features of the population
of Ukraine
, including population growth, population density
, ethnicity
, education level, health, economic status, religious affiliations, and other aspects of the population.
The data in this article are based on the most recent Ukrainian Census
, which was carried out in 2001, the CIA World Factbook, and the State Statistics Committee of Ukraine.
, until 1939 for most of time were part of the Kingdom Galicia
and later the Polish Republic
. The detailed information for those territories is missing, for more information see Demographics of Poland
. The Crimean peninsula was changing hands as well, in 1897 it was a part of the Taurida Governorate
, but after the October Revolution
became part of the Russian SFSR, and later was turned under the administration of the Ukrainian SSR
. The territory of Budjak
(southern Bessarabia
) became a part of the Ukrainian SSR
in June 1940. The censuses of 1926 through 1989 were taken in the Ukrainian SSR
. The census of 1897 is taken with the correspondence to nine gubernias that included in the territory of today's Ukraine. The statistics of 1905 records are taken from www.statoids.com which provides a broad degree of historical explanation on the situation in the Imperial Russia. The census statistics of 1931 was estimated by the professor Zenon Kuzela
(1882–1952) from Berlin. His calculations are as of January 1, 1931. This ethnograph is mentioned in the encyclopedia of Ukraine as one of the sources only available due to lack of the official census. The 2001 census was the first official census of the independent republic of Ukraine. Its data is given as on January 1. The 2003-2009 stats were taken from the official web-site of www.ukrstat.gov.ua and represent the data as of February of each year for the real population.
77.8%, Russian
17.3%, Romanian
0.8% (including Moldovan
0.5%), Belarusian
0.6%, Crimean Tatar
0.5%, Bulgarian
0.4%, Hungarian 0.3%, Polish
0.3%, Jewish 0.2%, Greeks
0.2% and other 1.6% (including Muslim Bulgarians, otherwise known as Torbesh, old communities of Armenians
living on the Sea of Azov
, and a microcosm of Gotland
er Swedes of Gammalsvenskby
).
1.46% (2006 est.)
people living with HIV/AIDS
377,600 (2006 est.)
deaths
20,000 (2003 est.)
29.4%, Ukrainian Greek Catholic Church
14.1%, Ukrainian Autocephalous Orthodox Church
2.8%, Roman Catholic 1.7%, Protestant 2.4%, Islam
0.6%, Jewish 0.2%, other 2% (2008 est.)
67%, Russian
30%, Crimean Tatar
, Bulgarian-
, Romanian-
, Polish-
, Hungarian-
, Rusyn
-speaking minorities and small remnants of a Yiddish speaking group among the local Jews.
The below table gives the total population of various ethnic groups in Ukraine and the primary language, according to the 2000 census.
and Zakarpattia
, saw slight population increases of .3% and .5% respectively. A third western Ukrainian region, Volyn
, lost less than .1% of its population between 1989 and 2001. Collectively, between 1989 and 2001 the seven westernmost regions of Ukraine lost 167,500 people or 1.7% of their 1989 population. The total population of these regions in 2001 was 9,593,800.
Between 1989 and 2001, the population of Kiev
City increased by .3% due to positive net-migration. Outside the capital, the central, southern and eastern regions experienced a severe decline in population. Between 1989 and 2001, the Donetsk region
lost 491,300 people or 9.2% of its 1989 population, and neighbouring Luhansk region
lost 11% of its population. Chernihiv region
, in central Ukraine northeast of Kiev, lost 170,600 people or 12% of its 1989 population, the highest percentage loss in of any region in Ukraine. In southern Ukraine, Odessa region
lost 173,600 people, or 6.6% of its 1989 population. By 2001, Crimea's population declined by 29,900 people, representing only 1.4% of the 1989 population. However, this was due to the influx of approximately 200,000 Crimean Tatars
– a number equivalent to approximately 10% of Crimea's 1989 population - who arrived in Crimea after 1989 and whose population in that region increased by a factor of 6.4 from 38,000 to 243,400 between 1989 and 2001. Collectively, the net population loss in the regions of Ukraine outside the westernmost regions was 2,759,200 people or 6.6% of the 1989 population. The total population of these regions in 2001 was 39,186,100.
Thus, from 1989–2001 the pattern of population change was one of slight growth in Kiev, slight declines in western Ukraine, large declines in eastern, central and southern Ukraine and slight decline in Crimea due to a large influx of Crimean tatars.
|+ Natural population growth
| width="32%"|
| width="1%"|
| width="32%"|
| width="1%"|
| width="32%"|
| width="1%"|
|-
|All population, 2010
|
|Urban population, 2009
|
|Rural population, 2009
|
|}>
is one of the lowest in Europe. However, significant regional differences in birth rates may account for some of the demographic differences. In the third quarter of 2007, for instance, the highest birth rate among Ukrainian regions occurred in Volyn Oblast
, with a birth rate of 13.4/1,000 people, compared to the Ukrainian country-wide average of 9.6/1,000 people. Volyn's birthrate is higher than the average birth rate of any European country with the exceptions of Iceland and Albania. In 2007, for the first time since 1990, five Ukrainian regions (Zakarpattia Oblast
, Rivne Oblast
, Volyn Oblast
, Lviv Oblast
, and Kiev Oblast
) experienced more births than deaths. This demonstrates a positive trend of increasing birthrates in the last couple of years throughout Ukraine. The ratio of births to deaths in those regions in 2007 was 119%, 117%, 110%, 100.7%, and 108%, respectively. With the exception of Kiev region, all of the regions with more births than deaths were in the less industrially developed regions of western Ukraine. According to a spokesperson for Ukraine's Ministry of Justice, the overall ratio of births to deaths in Ukraine had improved from 1 to 1.7 in 2004-2005 to 1 to 1.4 in 2008. However, the worst birth to death ratios in the country were in the eastern and central oblasts of Donetsk, Luhansk, Cherkasy and Poltava. In these regions, for every birth there were 2.1 deaths.
Abortion behavior in the North, South, East and Center regions of Ukraine are relatively homogeneous while the Western region differs greatly. Overall, the abortion rate in western Ukraine is three times lower than in other regions; however this is not due to an increased use of modern contraceptive methods in the West, but simply due to the fact that pregnant women in the Western regions are more likely to keep their babies. Donetsk and Dniproptrovsk oblasts in eastern and central Ukraine have the country's highest rate of abortions.
The Southern and eastern Ukrainian regions also suffer from the highest rates of HIV and AIDS, which impacts life expectancy. In late 2000, 60% of all AIDS cases in Ukraine were concentrated in the Odessa, Dnipropetrovsk, and Donetsk regions. A major reason for this is the fact that the urbanized and industrialized regions in the East and South of Ukraine suffered most from the economic crisis in the 90s, which in turn led to the spread of unemployment, alcoholism, and drug abuse, thus setting the conditions for wider spread of the epidemic.
In terms of poverty rates, the western and southern regions of Ukraine (particularly rural areas within those regions) have the country's highest poverty rates while Ukraine's eastern regions have the lowest poverty rates. In 2001, 39 percent of Ukraine's population could be defined as poor when the World Bank's poverty threshold of a dollar per day per capita was used. According to these standards, 49 percent of rural western Ukrainians and 45 percent of urban western Ukrainians were poor. In southern Ukraine, the percentages of poor were 51 and 40 percent, respectively. In contrast, 35% of urban and rural Ukrainians were poor based on per capita income less than one dollar per day in the regions of Eastern Ukraine. When povery was measured according to the percentage of the population who spent 80% or more of their income on food, regional differences shrank somewhat. In the western regions of Ukraine, 28 percent of rural residents and 9 percent of urban residents spent 80% of their income or more on food. In Ukraine's eastern regions, 19 percent of rural and 11 percent of urban residents spent 80% or more of their income on food.
|+
| width="32%"|
| width="2%"|
| width="32%"|
| width="2%"|
| width="32%"|
|-
|Urbabization rate, 2011
|
|Population density, 2011
|
|Medium population of rural settlements, 2011
|}>
Member States. During the 1990s and early 2000s, Ukraine's sputtering economy and political instability contributed to rising emigration
, especially to nearby Poland
and Hungary
, but also to other States such as Italy
, Portugal
, Spain
, Turkey
, Israel
, Russia
and Canada
. Although estimates vary, approximately two to three million Ukrainian citizens are currently working abroad, most of them illegally, in construction, service, housekeeping, and agriculture industries.
Between 1991 and 2004, the government counted 2,537,400 individuals who emigrated; 1,897,500 moved to other post-Soviet states, and 639,900 moved to other, mainly Western, states.
By the early 2000s, Ukrainian embassies reported that 300,000 Ukrainian citizens were working in Poland, 200,000 in Italy, approximately 200,000 in the Czech Republic
, 150,000 in Portugal, 100,000 in Spain, 35,000 in Turkey, 20,000 in the United States
and small significant numbers in Austria
, Belgium
, France
, Germany
, Greece
, Sweden
, Switzerland
and the UK. The largest number of Ukrainian workers abroad, about one million, are in the Russian Federation. Since 1992, 232,072 persons born in Ukraine have emigrated to the US.
From the point of view of the economic impact on natives, more appropriate than the absolute numbers is the volume of immigration as a proportion of the native population. Portugal and the Czech Republic have the highest rate of Ukrainian emigrants as a proportion of the native population.
Ethnic groups in Ukraine
Demographics
Demographics are the most recent statistical characteristics of a population. These types of data are used widely in sociology , public policy, and marketing. Commonly examined demographics include gender, race, age, disabilities, mobility, home ownership, employment status, and even location...
features of the population
Population
A population is all the organisms that both belong to the same group or species and live in the same geographical area. The area that is used to define a sexual population is such that inter-breeding is possible between any pair within the area and more probable than cross-breeding with individuals...
of Ukraine
Ukraine
Ukraine is a country in Eastern Europe. It has an area of 603,628 km², making it the second largest contiguous country on the European continent, after Russia...
, including population growth, population density
Population density
Population density is a measurement of population per unit area or unit volume. It is frequently applied to living organisms, and particularly to humans...
, ethnicity
Ethnic group
An ethnic group is a group of people whose members identify with each other, through a common heritage, often consisting of a common language, a common culture and/or an ideology that stresses common ancestry or endogamy...
, education level, health, economic status, religious affiliations, and other aspects of the population.
The data in this article are based on the most recent Ukrainian Census
Ukrainian Census (2001)
The first Ukrainian Census was carried out by State Statistics Committee of Ukraine on 5 December 2001, twelve years after the last Soviet Union census in 1989....
, which was carried out in 2001, the CIA World Factbook, and the State Statistics Committee of Ukraine.
Historical Data
The historical information is taken out of Demoscope.ru. Please, note that territory of the modern Ukraine at the times listed above varied greatly. The western regions of Ukraine, west of Zbruch riverZbruch River
Zbruch River is a river in Western Ukraine, a left tributary of the Dniester.It flows within the Podolia Upland starting from the Avratinian Upland. Zbruch is the namesake of the Zbruch idol, a sculpture of a Slavic deity in the form of a column with a head with four faces, discovered in 1848 by...
, until 1939 for most of time were part of the Kingdom Galicia
Kingdom of Galicia and Lodomeria
The Kingdom of Galicia and Lodomeria was a crownland of the Habsburg Monarchy, the Austrian Empire, and Austria–Hungary from 1772 to 1918 .This historical region in eastern Central Europe is currently divided between Poland and Ukraine...
and later the Polish Republic
Second Polish Republic
The Second Polish Republic, Second Commonwealth of Poland or interwar Poland refers to Poland between the two world wars; a period in Polish history in which Poland was restored as an independent state. Officially known as the Republic of Poland or the Commonwealth of Poland , the Polish state was...
. The detailed information for those territories is missing, for more information see Demographics of Poland
Polish census of 1931
The Polish census of 1931 or Second General Census in Poland was the second census taken in Poland, performed on December 9, 1931 by the Main Bureau of Statistics...
. The Crimean peninsula was changing hands as well, in 1897 it was a part of the Taurida Governorate
Taurida Governorate
The Taurida Governorate or Government of Taurida was a historical governorate of the Russian Empire. It included the Crimean peninsula and the mainland between the lower Dnieper River and the coasts of the Black Sea and Sea of Azov It was formed after the defunct Taurida Oblast in was abolished in...
, but after the October Revolution
October Revolution
The October Revolution , also known as the Great October Socialist Revolution , Red October, the October Uprising or the Bolshevik Revolution, was a political revolution and a part of the Russian Revolution of 1917...
became part of the Russian SFSR, and later was turned under the administration of the Ukrainian SSR
Ukrainian SSR
The Ukrainian Soviet Socialist Republic or in short, the Ukrainian SSR was a sovereign Soviet Socialist state and one of the fifteen constituent republics of the Soviet Union lasting from its inception in 1922 to the breakup in 1991...
. The territory of Budjak
Budjak
Budjak or Budzhak is a historical region in the Odessa Oblast of Ukraine. Lying along the Black Sea between the Danube and Dniester rivers this multiethnic region was the southern part of Bessarabia...
(southern Bessarabia
Bessarabia
Bessarabia is a historical term for the geographic region in Eastern Europe bounded by the Dniester River on the east and the Prut River on the west....
) became a part of the Ukrainian SSR
Ukrainian SSR
The Ukrainian Soviet Socialist Republic or in short, the Ukrainian SSR was a sovereign Soviet Socialist state and one of the fifteen constituent republics of the Soviet Union lasting from its inception in 1922 to the breakup in 1991...
in June 1940. The censuses of 1926 through 1989 were taken in the Ukrainian SSR
Ukrainian SSR
The Ukrainian Soviet Socialist Republic or in short, the Ukrainian SSR was a sovereign Soviet Socialist state and one of the fifteen constituent republics of the Soviet Union lasting from its inception in 1922 to the breakup in 1991...
. The census of 1897 is taken with the correspondence to nine gubernias that included in the territory of today's Ukraine. The statistics of 1905 records are taken from www.statoids.com which provides a broad degree of historical explanation on the situation in the Imperial Russia. The census statistics of 1931 was estimated by the professor Zenon Kuzela
Zenon Kuzela
Zenon Frantsyskovych Kuzela was a prominent Ukrainian linguist, bibliographer, historian, journalist, civil activist....
(1882–1952) from Berlin. His calculations are as of January 1, 1931. This ethnograph is mentioned in the encyclopedia of Ukraine as one of the sources only available due to lack of the official census. The 2001 census was the first official census of the independent republic of Ukraine. Its data is given as on January 1. The 2003-2009 stats were taken from the official web-site of www.ukrstat.gov.ua and represent the data as of February of each year for the real population.
Before WW II
| Ethnic group |
census 19261 | census 19392 | ||
|---|---|---|---|---|
| Number | % | Number | % | |
| Ukrainians Ukrainians Ukrainians are an East Slavic ethnic group native to Ukraine, which is the sixth-largest nation in Europe. The Constitution of Ukraine applies the term 'Ukrainians' to all its citizens... |
23,218,860 | 80.0 | 23,667,509 | 76.5 |
| Russians Russians The Russian people are an East Slavic ethnic group native to Russia, speaking the Russian language and primarily living in Russia and neighboring countries.... |
2,677,166 | 9.2 | 4,175,299 | 13.5 |
| Jews Jews The Jews , also known as the Jewish people, are a nation and ethnoreligious group originating in the Israelites or Hebrews of the Ancient Near East. The Jewish ethnicity, nationality, and religion are strongly interrelated, as Judaism is the traditional faith of the Jewish nation... |
1,574,428 | 5.4 | 1,532,776 | 5.0 |
| Germans Germans The Germans are a Germanic ethnic group native to Central Europe. The English term Germans has referred to the German-speaking population of the Holy Roman Empire since the Late Middle Ages.... |
393,924 | 1.4 | 392,458 | 1.3 |
| Poles Poles thumb|right|180px|The state flag of [[Poland]] as used by Polish government and diplomatic authoritiesThe Polish people, or Poles , are a nation indigenous to Poland. They are united by the Polish language, which belongs to the historical Lechitic subgroup of West Slavic languages of Central Europe... |
476,435 | 1.6 | 357,710 | 1.2 |
| Moldavians | 257,794 | 0.9 | 230,698 | 0.8 |
| Belarusians Belarusians Belarusians ; are an East Slavic ethnic group who populate the majority of the Republic of Belarus. Introduced to the world as a new state in the early 1990s, the Republic of Belarus brought with it the notion of a re-emerging Belarusian ethnicity, drawn upon the lines of the Old Belarusian... |
75,842 | 0.3 | 158,174 | 0.5 |
| Greeks Greeks The Greeks, also known as the Hellenes , are a nation and ethnic group native to Greece, Cyprus and neighboring regions. They also form a significant diaspora, with Greek communities established around the world.... |
104,666 | 0.4 | 107,047 | 0.4 |
| Bulgarians Bulgarians The Bulgarians are a South Slavic nation and ethnic group native to Bulgaria and neighbouring regions. Emigration has resulted in immigrant communities in a number of other countries.-History and ethnogenesis:... |
99,278 | 0.3 | 83,838 | 0.3 |
| Tatars Tatars Tatars are a Turkic speaking ethnic group , numbering roughly 7 million.The majority of Tatars live in the Russian Federation, with a population of around 5.5 million, about 2 million of which in the republic of Tatarstan.Significant minority populations are found in Uzbekistan, Kazakhstan,... |
22,281 | 0.1 | 55,456 | 0.2 |
| Roma | 13,578 | 0.0 | 10,443 | 0.0 |
| Others | 103,935 | 0.4 | 174,810 | 0.6 |
| Total | 29,018,187 | 30,946,218 | ||
| 1 Source: http://demoscope.ru/weekly/ssp/ussr_nac_26.php. 2 Source: http://demoscope.ru/weekly/ssp/ussr_nac_39.php. | ||||
After WW II
UkrainianUkrainians
Ukrainians are an East Slavic ethnic group native to Ukraine, which is the sixth-largest nation in Europe. The Constitution of Ukraine applies the term 'Ukrainians' to all its citizens...
77.8%, Russian
Russians
The Russian people are an East Slavic ethnic group native to Russia, speaking the Russian language and primarily living in Russia and neighboring countries....
17.3%, Romanian
Romanians
The Romanians are an ethnic group native to Romania, who speak Romanian; they are the majority inhabitants of Romania....
0.8% (including Moldovan
Moldovans
Moldovans or Moldavians are the largest population group of Moldova...
0.5%), Belarusian
Belarusians
Belarusians ; are an East Slavic ethnic group who populate the majority of the Republic of Belarus. Introduced to the world as a new state in the early 1990s, the Republic of Belarus brought with it the notion of a re-emerging Belarusian ethnicity, drawn upon the lines of the Old Belarusian...
0.6%, Crimean Tatar
Crimean Tatars
Crimean Tatars or Crimeans are a Turkic ethnic group that originally resided in Crimea. They speak the Crimean Tatar language...
0.5%, Bulgarian
Bulgarians
The Bulgarians are a South Slavic nation and ethnic group native to Bulgaria and neighbouring regions. Emigration has resulted in immigrant communities in a number of other countries.-History and ethnogenesis:...
0.4%, Hungarian 0.3%, Polish
Poles
thumb|right|180px|The state flag of [[Poland]] as used by Polish government and diplomatic authoritiesThe Polish people, or Poles , are a nation indigenous to Poland. They are united by the Polish language, which belongs to the historical Lechitic subgroup of West Slavic languages of Central Europe...
0.3%, Jewish 0.2%, Greeks
Greeks
The Greeks, also known as the Hellenes , are a nation and ethnic group native to Greece, Cyprus and neighboring regions. They also form a significant diaspora, with Greek communities established around the world....
0.2% and other 1.6% (including Muslim Bulgarians, otherwise known as Torbesh, old communities of Armenians
Armenians
Armenian people or Armenians are a nation and ethnic group native to the Armenian Highland.The largest concentration is in Armenia having a nearly-homogeneous population with 97.9% or 3,145,354 being ethnic Armenian....
living on the Sea of Azov
Sea of Azov
The Sea of Azov , known in Classical Antiquity as Lake Maeotis, is a sea on the south of Eastern Europe. It is linked by the narrow Strait of Kerch to the Black Sea to the south and is bounded on the north by Ukraine mainland, on the east by Russia, and on the west by the Ukraine's Crimean...
, and a microcosm of Gotland
Gotland
Gotland is a county, province, municipality and diocese of Sweden; it is Sweden's largest island and the largest island in the Baltic Sea. At 3,140 square kilometers in area, the region makes up less than one percent of Sweden's total land area...
er Swedes of Gammalsvenskby
Gammalsvenskby
Verbivka is now part of the village of Zmiyivka in Beryslav Raion of Kherson Oblast, Ukraine which has a Swedish cultural heritage...
).
| Ethnic group |
census 19591 | census 19702 | census 19793 | census 19894 | census 20015 | |||||
|---|---|---|---|---|---|---|---|---|---|---|
| Number | % | Number | % | Number | % | Number | % | Number | % | |
| Ukrainians Ukrainians Ukrainians are an East Slavic ethnic group native to Ukraine, which is the sixth-largest nation in Europe. The Constitution of Ukraine applies the term 'Ukrainians' to all its citizens... |
32,158,493 | 76.8 | 35,283,857 | 74.9 | 36,488,951 | 73.6 | 37,419,053 | 72.7 | 37,451,693 | 77.5 |
| Russians Russians The Russian people are an East Slavic ethnic group native to Russia, speaking the Russian language and primarily living in Russia and neighboring countries.... |
7,090,813 | 16.9 | 9,126,331 | 19.4 | 10,471,602 | 21.1 | 11,355,582 | 22.1 | 8,334,141 | 17.2 |
| Belarusians Belarusians Belarusians ; are an East Slavic ethnic group who populate the majority of the Republic of Belarus. Introduced to the world as a new state in the early 1990s, the Republic of Belarus brought with it the notion of a re-emerging Belarusian ethnicity, drawn upon the lines of the Old Belarusian... |
290,890 | 0.7 | 385,847 | 0.8 | 406,098 | 0.8 | 440,045 | 0.9 | 275,763 | 0.6 |
| Moldavians | 241,650 | 0.6 | 265,902 | 0.6 | 293,576 | 0.6 | 324,525 | 0.6 | 258,619 | 0.5 |
| Crimean Tatars Crimean Tatars Crimean Tatars or Crimeans are a Turkic ethnic group that originally resided in Crimea. They speak the Crimean Tatar language... |
193 | 0.0 | 3,554 | 0.0 | 6,636 | 0.0 | 46,807 | 0.1 | 248,193 | 0.5 |
| Bulgarians Bulgarians The Bulgarians are a South Slavic nation and ethnic group native to Bulgaria and neighbouring regions. Emigration has resulted in immigrant communities in a number of other countries.-History and ethnogenesis:... |
219,419 | 0.5 | 234,390 | 0.5 | 238,217 | 0.5 | 233,800 | 0.5 | 204,574 | 0.4 |
| Hungarians | 149,229 | 0.4 | 157,731 | 0.3 | 164,373 | 0.3 | 163,111 | 0.3 | 156,566 | 0.3 |
| Romanians Romanians The Romanians are an ethnic group native to Romania, who speak Romanian; they are the majority inhabitants of Romania.... |
100,863 | 0.2 | 112,141 | 0.2 | 121,795 | 0.3 | 134,825 | 0.3 | 150,989 | 0.3 |
| Poles Poles thumb|right|180px|The state flag of [[Poland]] as used by Polish government and diplomatic authoritiesThe Polish people, or Poles , are a nation indigenous to Poland. They are united by the Polish language, which belongs to the historical Lechitic subgroup of West Slavic languages of Central Europe... |
363,297 | 0.9 | 295,107 | 0.6 | 258,309 | 0.5 | 219,179 | 0.4 | 144,130 | 0.3 |
| Jews Jews The Jews , also known as the Jewish people, are a nation and ethnoreligious group originating in the Israelites or Hebrews of the Ancient Near East. The Jewish ethnicity, nationality, and religion are strongly interrelated, as Judaism is the traditional faith of the Jewish nation... |
840,311 | 2.0 | 777,126 | 1.7 | 634,154 | 1.3 | 486,628 | 1.0 | 103,591 | 0.2 |
| Armenians Armenians Armenian people or Armenians are a nation and ethnic group native to the Armenian Highland.The largest concentration is in Armenia having a nearly-homogeneous population with 97.9% or 3,145,354 being ethnic Armenian.... |
28,024 | 0.1 | 33,439 | 0.1 | 38,646 | 0.1 | 54,200 | 0.1 | 99,894 | 0.2 |
| Greeks Greeks The Greeks, also known as the Hellenes , are a nation and ethnic group native to Greece, Cyprus and neighboring regions. They also form a significant diaspora, with Greek communities established around the world.... |
104,359 | 0.3 | 106,909 | 0.2 | 104,091 | 0.2 | 98,594 | 0.2 | 91,548 | 0.2 |
| Tatars Tatars Tatars are a Turkic speaking ethnic group , numbering roughly 7 million.The majority of Tatars live in the Russian Federation, with a population of around 5.5 million, about 2 million of which in the republic of Tatarstan.Significant minority populations are found in Uzbekistan, Kazakhstan,... |
61,334 | 0.2 | 72,658 | 0.2 | 83,906 | 0.2 | 86,875 | 0.2 | 73,304 | 0.2 |
| Romani | 22,515 | 0.1 | 30,091 | 0.1 | 34,411 | 0.1 | 47,917 | 0.1 | 47,587 | 0.1 |
| Azerbaijanis | 6,680 | 0.0 | 10,769 | 0.0 | 17,235 | 0.0 | 36,961 | 0.1 | 45,176 | 0.1 |
| Georgians Georgians The Georgians are an ethnic group that have originated in Georgia, where they constitute a majority of the population. Large Georgian communities are also present throughout Russia, European Union, United States, and South America.... |
11,574 | 0.0 | 14,650 | 0.0 | 16,301 | 0.0 | 23,540 | 0.1 | 34,199 | 0.1 |
| Germans Germans The Germans are a Germanic ethnic group native to Central Europe. The English term Germans has referred to the German-speaking population of the Holy Roman Empire since the Late Middle Ages.... |
23,243 | 0.1 | 29,871 | 0.1 | 34,139 | 0.1 | 37,849 | 0.1 | 33,302 | 0.1 |
| Gagauzs | 23,530 | 0.1 | 26,464 | 0.1 | 29,398 | 0.1 | 31,967 | 0.1 | 31,923 | 0.1 |
| Karaites | 3,301 | 0.0 | 2,596 | 0.0 | 1,845 | 0.0 | 1,404 | 0.0 | 1,196 | 0.0 |
| Others | 129,338 | 0.3 | 157,084 | 0.3 | 165,650 | 0.3 | 209,172 | 0.4 | 539,604 | 1.1 |
| Total | 41,869,046 | 47,126,517 | 49,609,333 | 51,452,034 | 48,416,000 | |||||
| 1 Source: http://demoscope.ru/weekly/ssp/sng_nac_59.php. 2 Source: http://demoscope.ru/weekly/ssp/sng_nac_70.php. 3 Source: http://demoscope.ru/weekly/ssp/sng_nac_79.php. 4 Source: http://demoscope.ru/weekly/ssp/sng_nac_89.php. 5 Source: http://2001.ukrcensus.gov.ua/. | ||||||||||
Vital statistics
| Average population (x 1000) | Live births | Deaths1 | Natural change | Crude birth rate (per 1000) | Crude death rate (per 1000) | Natural change (per 1000) | Fertility rates | |
|---|---|---|---|---|---|---|---|---|
| 1946 | 753 493 | |||||||
| 1947 | 712 994 | |||||||
| 1948 | 757 783 | |||||||
| 1949 | 911 641 | |||||||
| 1950 | 36 905 | 844 585 | 314 000 | 530 585 | 22.8 | 8.5 | 14.3 | 2,81 |
| 1951 | 37 569 | 858 052 | 321 000 | 529 000 | 22.8 | 8.6 | 14.2 | |
| 1952 | 38 141 | 846 434 | 318 000 | 523 000 | 22.2 | 8.4 | 13.8 | |
| 1953 | 38 678 | 795 652 | 315 000 | 476 000 | 20.6 | 8.2 | 12.4 | |
| 1954 | 39 131 | 845 128 | 316 000 | 526 000 | 21.6 | 8.1 | 13.5 | |
| 1955 | 39 506 | 792 696 | 297 000 | 499 000 | 20.1 | 7.5 | 12.6 | |
| 1956 | 40 082 | 822 569 | 289 000 | 535 000 | 20.5 | 7.2 | 13.3 | |
| 1957 | 40 800 | 847 781 | 302 000 | 548 000 | 20.8 | 7.4 | 13.4 | |
| 1958 | 41 512 | 873 483 | 286 000 | 587 500 | 21.0 | 6.9 | 14.2 | |
| 1959 | 42 155 | 880 552 | 308 000 | 572 600 | 20.9 | 7.3 | 13.6 | |
| 1960 | 42 469 | 878 768 | 296 171 | 582 597 | 20.7 | 7.0 | 13.7 | 2,24 |
| 1961 | 43 097 | 843 482 | 304 346 | 539 136 | 19.6 | 7.1 | 12.5 | 2,17 |
| 1962 | 43 559 | 823 151 | 331 454 | 491 697 | 18.9 | 7.6 | 11.3 | 2,14 |
| 1963 | 44 088 | 794 969 | 323 556 | 471 413 | 17.9 | 7.3 | 10.6 | 2,06 |
| 1964 | 44 664 | 741 668 | 315 340 | 426 328 | 16.5 | 7.0 | 9.5 | 1,96 |
| 1965 | 45 133 | 692 153 | 342 717 | 349 436 | 15.3 | 7.6 | 7.7 | 1,99 |
| 1966 | 45 548 | 713 492 | 344 850 | 368 642 | 15.6 | 7.5 | 8.1 | 2,02 |
| 1967 | 45 997 | 699 381 | 368 573 | 330 808 | 15.1 | 8.0 | 7.2 | 2,01 |
| 1968 | 46 408 | 693 064 | 374 440 | 318 624 | 14.9 | 8.0 | 6.8 | 1,99 |
| 1969 | 46 778 | 687 991 | 404 151 | 283 840 | 14.7 | 8.6 | 6.0 | 2,04 |
| 1970 | 47 127 | 719 213 | 418 679 | 300 534 | 15.2 | 8.9 | 6.4 | 2,10 |
| 1971 | 47 507 | 736 691 | 424 717 | 311 974 | 15.4 | 8.9 | 6.5 | 2,13 |
| 1972 | 47 903 | 745 696 | 443 038 | 302 658 | 15.5 | 9.2 | 6.3 | 2,08 |
| 1973 | 48 274 | 719 560 | 449 351 | 270 209 | 14.9 | 9.3 | 5.6 | 2,04 |
| 1974 | 48 571 | 736 616 | 455 970 | 280 646 | 15.1 | 9.4 | 5.8 | 2,04 |
| 1975 | 48 881 | 738 857 | 489 550 | 249 307 | 15.1 | 10.0 | 5.1 | 2,02 |
| 1976 | 49 151 | 747 069 | 500 584 | 246 485 | 15.2 | 10.2 | 5.0 | 1,99 |
| 1977 | 49 388 | 726 217 | 517 967 | 208 250 | 14.7 | 10.5 | 4.2 | 1,94 |
| 1978 | 49 578 | 732 187 | 529 681 | 202 506 | 14.7 | 10.7 | 4.1 | 1,96 |
| 1979 | 49 755 | 735 188 | 552 019 | 183 169 | 14.7 | 11.1 | 3.7 | 1,96 |
| 1980 | 50 044 | 742 489 | 568 243 | 174 246 | 14.8 | 11.4 | 3.5 | 1,95 |
| 1981 | 50 222 | 733 183 | 568 789 | 164 394 | 14.6 | 11.3 | 3.3 | 1,93 |
| 1982 | 50 388 | 745 591 | 568 231 | 177 360 | 14.8 | 11.3 | 3.5 | 1,98 |
| 1983 | 50 573 | 807 111 | 583 496 | 223 615 | 16.0 | 11.6 | 4.4 | 2,08 |
| 1984 | 50 768 | 792 035 | 610 338 | 181 697 | 15.6 | 12.0 | 3.6 | 2,11 |
| 1985 | 50 941 | 762 775 | 617 548 | 145 227 | 15.0 | 12.1 | 2.9 | 2,06 |
| 1986 | 51 143 | 792 574 | 565 150 | 227 424 | 15.5 | 11.1 | 4.4 | 2,11 |
| 1987 | 51 373 | 760 851 | 586 387 | 174 464 | 14.8 | 11.4 | 3.4 | 2,05 |
| 1988 | 51 593 | 744 056 | 600 725 | 143 331 | 14.4 | 11.6 | 2.8 | 2,03 |
| 1989 | 51 770 | 690 981 | 600 590 | 90 391 | 13.3 | 11.6 | 1.7 | 1,94 |
| 1990 | 51 891 | 657 202 | 629 602 | 27 600 | 12.7 | 12.1 | 0.5 | 1,85 |
| 1991 | 52 001 | 630 813 | 669 960 | -39 147 | 12.1 | 12.9 | -0.8 | 1,77 |
| 1992 | 52 151 | 596 785 | 697 110 | -100 325 | 11.4 | 13.4 | -1.9 | 1,67 |
| 1993 | 52 179 | 557 467 | 741 662 | -184 195 | 10.7 | 14.2 | -3.5 | 1,56 |
| 1994 | 51 921 | 521 545 | 764 669 | -243 124 | 10.0 | 14.7 | -4.7 | 1,47 |
| 1995 | 51 513 | 492 861 | 792 587 | -299 726 | 9.6 | 15.4 | -5.8 | 1,40 |
| 1996 | 51 058 | 467 211 | 776 717 | -309 506 | 9.2 | 15.2 | -6.1 | 1,33 |
| 1997 | 50 594 | 442 581 | 754 151 | -311 570 | 8.7 | 14.9 | -6.2 | 1,27 |
| 1998 | 50 144 | 419 238 | 719 954 | -300 716 | 8.4 | 14.4 | -6.0 | 1,21 |
| 1999 | 49 674 | 389 208 | 739 170 | -349 962 | 7.8 | 14.9 | -7.0 | 1,12 |
| 2000 | 49 177 | 385 126 | 758 082 | -372 956 | 7.8 | 15.4 | -7.6 | 1,11 |
| 2001 | 48 663 | 376 479 | 745 953 | -369 474 | 7.7 | 15.3 | -7.6 | 1,08 |
| 2002 | 48 203 | 390 687 | 754 911 | -364 224 | 8.1 | 15.7 | -7.6 | 1,13 |
| 2003 | 47 813 | 408 591 | 765 408 | -356 817 | 8.5 | 16.0 | -7.5 | 1,17 |
| 2004 | 47 452 | 427 259 | 761 263 | -334 004 | 9.0 | 16.0 | -7.0 | 1,22 |
| 2005 | 47 106 | 426 085 | 781 964 | -355 879 | 9.0 | 16.6 | -7.6 | 1,21 |
| 2006 | 46 788 | 460 368 | 758 093 | -297 725 | 9.8 | 16.2 | -6.4 | 1,31 |
| 2007 | 46 510 | 472 657 | 762 877 | -290 220 | 10.2 | 16.4 | -6.2 | 1,35 |
| 2008 | 46 258 | 510 588 | 754 462 | -243 874 | 11.0 | 16.3 | -5.3 | 1,46 |
| 2009 | 46 053 | 512 526 | 706 740 | -194 214 | 11.1 | 15.3 | -4.2 | 1,48 |
| 2010 | 45 871 | 497 689 | 698 235 | -200 546 | 10.8 | 15.2 | -4.4 | 1,44 |
| 1 Deaths 1950-1959 are estimates | ||||||||
Age structure
- 0–14 years: 13.9% (male 3,277,905/female 3,106,012)
- 15–64 years: 70% (male 15,443,818/female 16,767,931)
- 65 years and over: 16.1% (male 2,489,235/female 4,909,386) (2008 est.)
Sex ratio
- at birth: 1.06 male(s)/female
- under 15 years: 1.06 male(s)/female
- 15–64 years: 0.92 male(s)/female
- 65 years and over: 0.51 male(s)/female
- total population: 0.8375 male(s)/female (2008 est.)
Life expectancy at birth
- total population: 68.06 years
- male: 62.24 years
- female: 74.24 years (2008 est.)
HIV/AIDS
adult prevalence rate1.46% (2006 est.)
people living with HIV/AIDS
377,600 (2006 est.)
deaths
20,000 (2003 est.)
Religions
Ukrainian Orthodox Church - Kiev Patriarchy 39.8%, Ukrainian Orthodox Church (Moscow Patriarchate)Ukrainian Orthodox Church (Moscow Patriarchate)
The Ukrainian Orthodox Church is an autonomous Church of Eastern Orthodoxy in Ukraine, under the ecclesiastic jurisdiction of the Moscow Patriarchate...
29.4%, Ukrainian Greek Catholic Church
Ukrainian Greek Catholic Church
The Ukrainian Greek Catholic Church , Ukrainska Hreko-Katolytska Tserkva), is the largest Eastern Rite Catholic sui juris particular church in full communion with the Holy See, and is directly subject to the Pope...
14.1%, Ukrainian Autocephalous Orthodox Church
Ukrainian Autocephalous Orthodox Church
The Ukrainian Autocephalous Orthodox Church is one of the three major Orthodox Churches in Ukraine. Close to ten percent of the Christian population claim to be members of the UAOC. The other Churches are the Ukrainian Orthodox Church-Kiev Patriarchate and the Ukrainian Russophile Orthodox...
2.8%, Roman Catholic 1.7%, Protestant 2.4%, Islam
Islam
Islam . The most common are and . : Arabic pronunciation varies regionally. The first vowel ranges from ~~. The second vowel ranges from ~~~...
0.6%, Jewish 0.2%, other 2% (2008 est.)
Languages
UkrainianUkrainian language
Ukrainian is a language of the East Slavic subgroup of the Slavic languages. It is the official state language of Ukraine. Written Ukrainian uses a variant of the Cyrillic alphabet....
67%, Russian
Russian language
Russian is a Slavic language used primarily in Russia, Belarus, Uzbekistan, Kazakhstan, Tajikistan and Kyrgyzstan. It is an unofficial but widely spoken language in Ukraine, Moldova, Latvia, Turkmenistan and Estonia and, to a lesser extent, the other countries that were once constituent republics...
30%, Crimean Tatar
Crimean Tatar language
The Crimean Tatar language is the language of the Crimean Tatars. It is a Turkic language spoken in Crimea, Central Asia , and the Crimean Tatar diasporas in Turkey, Romania, Bulgaria...
, Bulgarian-
Bulgarian language
Bulgarian is an Indo-European language, a member of the Slavic linguistic group.Bulgarian, along with the closely related Macedonian language, demonstrates several linguistic characteristics that set it apart from all other Slavic languages such as the elimination of case declension, the...
, Romanian-
Romanian language
Romanian Romanian Romanian (or Daco-Romanian; obsolete spellings Rumanian, Roumanian; self-designation: română, limba română ("the Romanian language") or românește (lit. "in Romanian") is a Romance language spoken by around 24 to 28 million people, primarily in Romania and Moldova...
, Polish-
Polish language
Polish is a language of the Lechitic subgroup of West Slavic languages, used throughout Poland and by Polish minorities in other countries...
, Hungarian-
Hungarian language
Hungarian is a Uralic language, part of the Ugric group. With some 14 million speakers, it is one of the most widely spoken non-Indo-European languages in Europe....
, Rusyn
Rusyn language
Rusyn , also known in English as Ruthenian, is an East Slavic language variety spoken by the Rusyns of Central Europe. Some linguists treat it as a distinct language and it has its own ISO 639-3 code; others treat it as a dialect of Ukrainian...
-speaking minorities and small remnants of a Yiddish speaking group among the local Jews.
The below table gives the total population of various ethnic groups in Ukraine and the primary language, according to the 2000 census.
| Group | Pop | Native | Ukrainian | Russian | Other |
|---|---|---|---|---|---|
| Ukrainians Ukrainians Ukrainians are an East Slavic ethnic group native to Ukraine, which is the sixth-largest nation in Europe. The Constitution of Ukraine applies the term 'Ukrainians' to all its citizens... |
37541693 | 31970728 | x | 5544729 | 532 |
| Russians Russians The Russian people are an East Slavic ethnic group native to Russia, speaking the Russian language and primarily living in Russia and neighboring countries.... |
8334141 | 7993832 | 328152 | x | 402 |
| Belarusians Belarusians Belarusians ; are an East Slavic ethnic group who populate the majority of the Republic of Belarus. Introduced to the world as a new state in the early 1990s, the Republic of Belarus brought with it the notion of a re-emerging Belarusian ethnicity, drawn upon the lines of the Old Belarusian... |
275763 | 54573 | 48202 | 172251 | x |
| Moldavians Moldovans Moldovans or Moldavians are the largest population group of Moldova... |
258619 | 181124 | 27775 | 45607 | 22 |
| Crimean Tatars Crimean Tatars Crimean Tatars or Crimeans are a Turkic ethnic group that originally resided in Crimea. They speak the Crimean Tatar language... |
248193 | 228373 | 184 | 15208 | 43 |
| Bulgarians Bulgarians The Bulgarians are a South Slavic nation and ethnic group native to Bulgaria and neighbouring regions. Emigration has resulted in immigrant communities in a number of other countries.-History and ethnogenesis:... |
204574 | 131237 | 10277 | 62067 | 9 |
| Hungarians | 156566 | 149431 | 5367 | 1513 | 14 |
| Romanians Romanians The Romanians are an ethnic group native to Romania, who speak Romanian; they are the majority inhabitants of Romania.... |
150989 | 138522 | 9367 | 2297 | 4 |
| Poles Poles thumb|right|180px|The state flag of [[Poland]] as used by Polish government and diplomatic authoritiesThe Polish people, or Poles , are a nation indigenous to Poland. They are united by the Polish language, which belongs to the historical Lechitic subgroup of West Slavic languages of Central Europe... |
144130 | 18660 | 102268 | 22495 | 390 |
| Jews Jews The Jews , also known as the Jewish people, are a nation and ethnoreligious group originating in the Israelites or Hebrews of the Ancient Near East. The Jewish ethnicity, nationality, and religion are strongly interrelated, as Judaism is the traditional faith of the Jewish nation... |
103591 | 3213 | 13924 | 85964 | 16 |
| Armenians Armenians Armenian people or Armenians are a nation and ethnic group native to the Armenian Highland.The largest concentration is in Armenia having a nearly-homogeneous population with 97.9% or 3,145,354 being ethnic Armenian.... |
99894 | 50363 | 5798 | 43105 | 11 |
| Greeks Greeks The Greeks, also known as the Hellenes , are a nation and ethnic group native to Greece, Cyprus and neighboring regions. They also form a significant diaspora, with Greek communities established around the world.... |
91548 | 5829 | 4359 | 80992 | 9 |
| Tatars Tatars Tatars are a Turkic speaking ethnic group , numbering roughly 7 million.The majority of Tatars live in the Russian Federation, with a population of around 5.5 million, about 2 million of which in the republic of Tatarstan.Significant minority populations are found in Uzbekistan, Kazakhstan,... |
73304 | 25770 | 3310 | 43060 | 6 |
| Roma people (Gypsies) | 47587 | 21266 | 10039 | 6378 | 6 |
| Azerbaijanis | 45176 | 23958 | 3224 | 16968 | 36 |
| Georgians Georgians The Georgians are an ethnic group that have originated in Georgia, where they constitute a majority of the population. Large Georgian communities are also present throughout Russia, European Union, United States, and South America.... |
34199 | 12539 | 2818 | 18589 | 15 |
| Germans Germans The Germans are a Germanic ethnic group native to Central Europe. The English term Germans has referred to the German-speaking population of the Holy Roman Empire since the Late Middle Ages.... |
33302 | 4056 | 7360 | 21549 | 20 |
| Gagauzs | 31923 | 22822 | 1102 | 7232 | 2 |
| Koreans | 12711 | 2223 | 700 | 9662 | 0 |
| Uzbeks Uzbeks The Uzbeks are a Turkic ethnic group in Central Asia. They comprise the majority population of Uzbekistan, and large populations can also be found in Afghanistan, Tajikstan, Kyrgyzstan, Turkmenistan, Kazakhstan, Russia, Pakistan, Mongolia and the Xinjiang Uyghur Autonomous Region of China... |
12353 | 3604 | 1818 | 5996 | 0 |
| Chuvash Chuvash people The Chuvash people are a Turkic ethnic group, native to an area stretching from the Volga Region to Siberia. Most of them live in Republic of Chuvashia and surrounding areas, although Chuvash communities may be found throughout all Russia.- Etymology :... |
10593 | 2268 | 564 | 7636 | 1 |
| Mordvinians | 9331 | 1473 | 646 | 7168 | 0 |
| Turks Turkish people Turkish people, also known as the "Turks" , are an ethnic group primarily living in Turkey and in the former lands of the Ottoman Empire where Turkish minorities had been established in Bulgaria, Cyprus, Bosnia and Herzegovina, Georgia, Greece, Kosovo, Macedonia, and Romania... |
8844 | 7923 | 133 | 567 | 0 |
| Lithuanians Lithuanians Lithuanians are the Baltic ethnic group native to Lithuania, where they number around 2,765,600 people. Another million or more make up the Lithuanian diaspora, largely found in countries such as the United States, Brazil, Canada, Colombia, Russia, United Kingdom and Ireland. Their native language... |
7207 | 1932 | 1029 | 4182 | 4 |
| Arabs | 6575 | 4071 | 897 | 1235 | 0 |
| Slovaks Slovaks The Slovaks, Slovak people, or Slovakians are a West Slavic people that primarily inhabit Slovakia and speak the Slovak language, which is closely related to the Czech language.Most Slovaks today live within the borders of the independent Slovakia... |
6397 | 2633 | 2665 | 335 | 0 |
| Czechs | 5917 | 1190 | 2503 | 2144 | 2 |
| Kazakhs Kazakhs The Kazakhs are a Turkic people of the northern parts of Central Asia .... |
5526 | 1041 | 822 | 3470 | 11 |
| Latvians Latvians Latvians or Letts are the indigenous Baltic people of Latvia.-History:Latvians occasionally refer to themselves by the ancient name of Latvji, which may have originated from the word Latve which is a name of the river that presumably flowed through what is now eastern Latvia... |
5079 | 957 | 872 | 3188 | 1 |
| Ossetians Ossetians The Ossetians are an Iranic ethnic group of the Caucasus Mountains, eponymous of the region known as Ossetia.They speak Ossetic, an Iranian language of the Eastern branch, with most also fluent in Russian as a second language.... |
4834 | 1150 | 401 | 3110 | 4 |
| Udmurts | 4712 | 729 | 380 | 3515 | 0 |
| Lezghinians | 4349 | 1507 | 330 | 2341 | 4 |
| Tadjiks | 4255 | 1521 | 488 | 1983 | 0 |
| Bashkirs Bashkirs The Bashkirs are a Turkic people indigenous to Bashkortostan extending on both parts of the Ural mountains, on the place where Europe meets Asia. Groups of Bashkirs also live in the republic of Tatarstan, Perm Krai, Chelyabinsk, Orenburg, Tyumen, Sverdlovsk, Kurgan, Samara and Saratov Oblasts of... |
4253 | 843 | 336 | 2920 | 0 |
| Mari people | 4130 | 1059 | 264 | 2758 | 7 |
| Thai Thai people The Thai people, or Siamese, are the main ethnic group of Thailand and are part of the larger Tai ethnolinguistic peoples found in Thailand and adjacent countries in Southeast Asia as well as southern China. Their language is the Thai language, which is classified as part of the Kradai family of... |
3850 | 3641 | 29 | 164 | 0 |
| Turkmens | 3709 | 719 | 1079 | 1392 | 0 |
| Albanians Albanians Albanians are a nation and ethnic group native to Albania and neighbouring countries. They speak the Albanian language. More than half of all Albanians live in Albania and Kosovo... |
3308 | 1740 | 301 | 1181 | 0 |
| Assyrians Assyrian people The Assyrian people are a distinct ethnic group whose origins lie in ancient Mesopotamia... |
3143 | 883 | 408 | 1730 | 0 |
| Chechens | 2877 | 1581 | 212 | 977 | 0 |
| Estonians Estonians Estonians are a Finnic people closely related to the Finns and inhabiting, primarily, the country of Estonia. They speak a Finnic language known as Estonian... |
2868 | 416 | 321 | 2107 | 4 |
| Chinese people Chinese people The term Chinese people may refer to any of the following:*People with Han Chinese ethnicity .... |
2213 | 1817 | 73 | 307 | 0 |
| Kurds | 2088 | 1173 | 236 | 396 | 0 |
| Darghins | 1610 | 409 | 199 | 955 | 0 |
| Komis | 1545 | 330 | 127 | 1046 | 0 |
| Karelians Karelians The Karelians are a Baltic-Finnic ethnic group living mostly in the Republic of Karelia and in other north-western parts of the Russian Federation. The historic homeland of Karelians includes also parts of present-day Eastern Finland and the formerly Finnish territory of Ladoga Karelia... |
1522 | 96 | 145 | 1244 | 1 |
| Avars Caucasian Avars Avars or Caucasian Avars are a modern people of Caucasus, mainly of Dagestan, in which they are the predominant group. The Caucasian Avar language belongs to the Northeast Caucasian language family .... |
1496 | 582 | 121 | 761 | 0 |
| Indo-Pakistanis | 1483 | 1092 | 26 | 192 | 0 |
| Abkhazians | 1458 | 317 | 268 | 797 | 0 |
| Karaites | 1196 | 72 | 160 | 931 | 0 |
| Komi-Permians | 1165 | 160 | 79 | 898 | 1 |
| Kyrgyz people | 1128 | 208 | 221 | 617 | 19 |
| Laks | 1019 | 199 | 271 | 514 | 13 |
| Afghanis | 1008 | 551 | 60 | 213 | 0 |
| other | 3228 | 1027 | 144 | 790 | 0 |
| NA | 188639 | 0 | 1108 | 1844 | 1 |
Literacy
- definition: age 15 and over can read and write
- total population: 99.3%
- male: 99.7%
- female: 99.2% (2001 census)
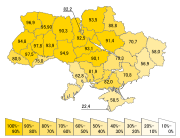
Regional Differences in Population Change
Between the Soviet census of 1989 and the Ukrainian census of 2001, Ukraine's population declined from 51,706,600 to 48,457,020, a loss of 2,926,700 people or 5.7% of the 1989 population. However, this trend has been quite uneven and varied regionally. Two regions in western Ukraine — RivneRivne Oblast
Rivne Oblast is an oblast of Ukraine. Its administrative center is Rivne. The area of the region is 20,100 km²; its population is 1.2 million...
and Zakarpattia
Zakarpattia Oblast
The Zakarpattia Oblast is an administrative oblast located in southwestern Ukraine. Its administrative center is the city of Uzhhorod...
, saw slight population increases of .3% and .5% respectively. A third western Ukrainian region, Volyn
Volyn Oblast
Volyn Oblast is an oblast in north-western Ukraine. Its administrative center is Lutsk. Kovel is the westernmost town and the last station in Ukraine of the rail line running from Kiev to Warsaw.-History:...
, lost less than .1% of its population between 1989 and 2001. Collectively, between 1989 and 2001 the seven westernmost regions of Ukraine lost 167,500 people or 1.7% of their 1989 population. The total population of these regions in 2001 was 9,593,800.
Between 1989 and 2001, the population of Kiev
Kiev
Kiev or Kyiv is the capital and the largest city of Ukraine, located in the north central part of the country on the Dnieper River. The population as of the 2001 census was 2,611,300. However, higher numbers have been cited in the press....
City increased by .3% due to positive net-migration. Outside the capital, the central, southern and eastern regions experienced a severe decline in population. Between 1989 and 2001, the Donetsk region
Donetsk Oblast
Donetsk Oblast is an oblast of eastern Ukraine. Its administrative center is Donetsk. Historically, the province is an important part of the Donbas region...
lost 491,300 people or 9.2% of its 1989 population, and neighbouring Luhansk region
Luhansk Oblast
Luhansk Oblast ) is the easternmost oblast of Ukraine. Its administrative center is Luhansk. The oblast was established in 1938 and bore the name Voroshilovgrad Oblast in honor of Kliment Voroshilov....
lost 11% of its population. Chernihiv region
Chernihiv Oblast
Chernihiv Oblast is an oblast of northern Ukraine. The administrative center of the oblast is the city of Chernihiv.-Geography:The total area of the province is around 31,900 km²....
, in central Ukraine northeast of Kiev, lost 170,600 people or 12% of its 1989 population, the highest percentage loss in of any region in Ukraine. In southern Ukraine, Odessa region
Odessa Oblast
Odesa Oblast, also written as Odessa Oblast , is the southernmost and largest oblast of south-western Ukraine. The administrative center of the oblast is the city of Odessa.-History:...
lost 173,600 people, or 6.6% of its 1989 population. By 2001, Crimea's population declined by 29,900 people, representing only 1.4% of the 1989 population. However, this was due to the influx of approximately 200,000 Crimean Tatars
Crimean Tatars
Crimean Tatars or Crimeans are a Turkic ethnic group that originally resided in Crimea. They speak the Crimean Tatar language...
– a number equivalent to approximately 10% of Crimea's 1989 population - who arrived in Crimea after 1989 and whose population in that region increased by a factor of 6.4 from 38,000 to 243,400 between 1989 and 2001. Collectively, the net population loss in the regions of Ukraine outside the westernmost regions was 2,759,200 people or 6.6% of the 1989 population. The total population of these regions in 2001 was 39,186,100.
Thus, from 1989–2001 the pattern of population change was one of slight growth in Kiev, slight declines in western Ukraine, large declines in eastern, central and southern Ukraine and slight decline in Crimea due to a large influx of Crimean tatars.
| width="32%"|
| width="1%"|
| width="32%"|
| width="1%"|
| width="32%"|
| width="1%"|
|-
|All population, 2010
|
|Urban population, 2009
|
|Rural population, 2009
|
|}>
Regional Differences in Birth and Fertility Rates
Ukraine's total fertility rateTotal Fertility Rate
The total fertility rate of a population is the average number of children that would be born to a woman over her lifetime if she were to experience the exact current age-specific fertility rates through her lifetime, and she...
is one of the lowest in Europe. However, significant regional differences in birth rates may account for some of the demographic differences. In the third quarter of 2007, for instance, the highest birth rate among Ukrainian regions occurred in Volyn Oblast
Volyn Oblast
Volyn Oblast is an oblast in north-western Ukraine. Its administrative center is Lutsk. Kovel is the westernmost town and the last station in Ukraine of the rail line running from Kiev to Warsaw.-History:...
, with a birth rate of 13.4/1,000 people, compared to the Ukrainian country-wide average of 9.6/1,000 people. Volyn's birthrate is higher than the average birth rate of any European country with the exceptions of Iceland and Albania. In 2007, for the first time since 1990, five Ukrainian regions (Zakarpattia Oblast
Zakarpattia Oblast
The Zakarpattia Oblast is an administrative oblast located in southwestern Ukraine. Its administrative center is the city of Uzhhorod...
, Rivne Oblast
Rivne Oblast
Rivne Oblast is an oblast of Ukraine. Its administrative center is Rivne. The area of the region is 20,100 km²; its population is 1.2 million...
, Volyn Oblast
Volyn Oblast
Volyn Oblast is an oblast in north-western Ukraine. Its administrative center is Lutsk. Kovel is the westernmost town and the last station in Ukraine of the rail line running from Kiev to Warsaw.-History:...
, Lviv Oblast
Lviv Oblast
Lviv Oblast is an oblast in western Ukraine. The administrative center of the oblast is the city of Lviv.-History:The oblast was created as part of the Ukrainian Soviet Socialist Republic on December 4, 1939...
, and Kiev Oblast
Kiev Oblast
Kyiv Oblast, sometimes written as Kiev Oblast is an oblast in central Ukraine.The administrative center of the oblast is the city of Kyiv , also being the capital of Ukraine...
) experienced more births than deaths. This demonstrates a positive trend of increasing birthrates in the last couple of years throughout Ukraine. The ratio of births to deaths in those regions in 2007 was 119%, 117%, 110%, 100.7%, and 108%, respectively. With the exception of Kiev region, all of the regions with more births than deaths were in the less industrially developed regions of western Ukraine. According to a spokesperson for Ukraine's Ministry of Justice, the overall ratio of births to deaths in Ukraine had improved from 1 to 1.7 in 2004-2005 to 1 to 1.4 in 2008. However, the worst birth to death ratios in the country were in the eastern and central oblasts of Donetsk, Luhansk, Cherkasy and Poltava. In these regions, for every birth there were 2.1 deaths.
Abortion behavior in the North, South, East and Center regions of Ukraine are relatively homogeneous while the Western region differs greatly. Overall, the abortion rate in western Ukraine is three times lower than in other regions; however this is not due to an increased use of modern contraceptive methods in the West, but simply due to the fact that pregnant women in the Western regions are more likely to keep their babies. Donetsk and Dniproptrovsk oblasts in eastern and central Ukraine have the country's highest rate of abortions.
Regional Differences and Death Rates and Health
Death rates also vary widely by region; Eastern and southern Ukraine have the highest death rates in the country, and the life expectancy for children born in Chernigov, Dnepropetrovsk, Donetsk, Kherson, Kirovograd, Lugansk, Nikolaev, and Odessa regions is 1.5 years lower than the national average. Ukraine had a suicide rate of 29.6 per 100,000 population in 1998, a significant increase from the suicide rate of 19 per 100,000 in 1988. Suicides are more frequent in the industrially developed regions and in the rural areas of the country than in the cities; In western Ukraine, the suicide rate was lower than the national average at 11.1 per 100,000.The Southern and eastern Ukrainian regions also suffer from the highest rates of HIV and AIDS, which impacts life expectancy. In late 2000, 60% of all AIDS cases in Ukraine were concentrated in the Odessa, Dnipropetrovsk, and Donetsk regions. A major reason for this is the fact that the urbanized and industrialized regions in the East and South of Ukraine suffered most from the economic crisis in the 90s, which in turn led to the spread of unemployment, alcoholism, and drug abuse, thus setting the conditions for wider spread of the epidemic.
Regional Differences in Income
In terms of income, the rural western and central regions of Ukraine are the poorest while Kiev and the industrialized eastern regions of Ukraine are the wealthiest. In December 2010 the average monthly income in Ukraine was 2629 hryvnias. The poorest regions in Ukraine, Volyn and Chernihiv, had monthly incomes of 1995 and 1951 hryvnias, respectively. In contrast, the monthly income in the city of Kiev was 4174 hryvnias per month, the city of Sevastopol 2712 hryvnias per month, and in Kiev region was 2647 per month. Outside of the capital and the city of Sevastopol, the wealthiest regions were Donetsk and Luhansk, whose monthly incomes were 2654 and 2631 hryvnias per month, respectively.In terms of poverty rates, the western and southern regions of Ukraine (particularly rural areas within those regions) have the country's highest poverty rates while Ukraine's eastern regions have the lowest poverty rates. In 2001, 39 percent of Ukraine's population could be defined as poor when the World Bank's poverty threshold of a dollar per day per capita was used. According to these standards, 49 percent of rural western Ukrainians and 45 percent of urban western Ukrainians were poor. In southern Ukraine, the percentages of poor were 51 and 40 percent, respectively. In contrast, 35% of urban and rural Ukrainians were poor based on per capita income less than one dollar per day in the regions of Eastern Ukraine. When povery was measured according to the percentage of the population who spent 80% or more of their income on food, regional differences shrank somewhat. In the western regions of Ukraine, 28 percent of rural residents and 9 percent of urban residents spent 80% of their income or more on food. In Ukraine's eastern regions, 19 percent of rural and 11 percent of urban residents spent 80% or more of their income on food.
Urbanization
| width="32%"|
| width="2%"|
| width="32%"|
| width="2%"|
| width="32%"|
|-
|Urbabization rate, 2011
|
|Population density, 2011
|
|Medium population of rural settlements, 2011
|}>
Migration
Ukraine is the major source of migrants in many of the European UnionEuropean Union
The European Union is an economic and political union of 27 independent member states which are located primarily in Europe. The EU traces its origins from the European Coal and Steel Community and the European Economic Community , formed by six countries in 1958...
Member States. During the 1990s and early 2000s, Ukraine's sputtering economy and political instability contributed to rising emigration
Emigration
Emigration is the act of leaving one's country or region to settle in another. It is the same as immigration but from the perspective of the country of origin. Human movement before the establishment of political boundaries or within one state is termed migration. There are many reasons why people...
, especially to nearby Poland
Poland
Poland , officially the Republic of Poland , is a country in Central Europe bordered by Germany to the west; the Czech Republic and Slovakia to the south; Ukraine, Belarus and Lithuania to the east; and the Baltic Sea and Kaliningrad Oblast, a Russian exclave, to the north...
and Hungary
Hungary
Hungary , officially the Republic of Hungary , is a landlocked country in Central Europe. It is situated in the Carpathian Basin and is bordered by Slovakia to the north, Ukraine and Romania to the east, Serbia and Croatia to the south, Slovenia to the southwest and Austria to the west. The...
, but also to other States such as Italy
Italy
Italy , officially the Italian Republic languages]] under the European Charter for Regional or Minority Languages. In each of these, Italy's official name is as follows:;;;;;;;;), is a unitary parliamentary republic in South-Central Europe. To the north it borders France, Switzerland, Austria and...
, Portugal
Portugal
Portugal , officially the Portuguese Republic is a country situated in southwestern Europe on the Iberian Peninsula. Portugal is the westernmost country of Europe, and is bordered by the Atlantic Ocean to the West and South and by Spain to the North and East. The Atlantic archipelagos of the...
, Spain
Spain
Spain , officially the Kingdom of Spain languages]] under the European Charter for Regional or Minority Languages. In each of these, Spain's official name is as follows:;;;;;;), is a country and member state of the European Union located in southwestern Europe on the Iberian Peninsula...
, Turkey
Turkey
Turkey , known officially as the Republic of Turkey , is a Eurasian country located in Western Asia and in East Thrace in Southeastern Europe...
, Israel
Israel
The State of Israel is a parliamentary republic located in the Middle East, along the eastern shore of the Mediterranean Sea...
, Russia
Russia
Russia or , officially known as both Russia and the Russian Federation , is a country in northern Eurasia. It is a federal semi-presidential republic, comprising 83 federal subjects...
and Canada
Canada
Canada is a North American country consisting of ten provinces and three territories. Located in the northern part of the continent, it extends from the Atlantic Ocean in the east to the Pacific Ocean in the west, and northward into the Arctic Ocean...
. Although estimates vary, approximately two to three million Ukrainian citizens are currently working abroad, most of them illegally, in construction, service, housekeeping, and agriculture industries.
Between 1991 and 2004, the government counted 2,537,400 individuals who emigrated; 1,897,500 moved to other post-Soviet states, and 639,900 moved to other, mainly Western, states.
By the early 2000s, Ukrainian embassies reported that 300,000 Ukrainian citizens were working in Poland, 200,000 in Italy, approximately 200,000 in the Czech Republic
Czech Republic
The Czech Republic is a landlocked country in Central Europe. The country is bordered by Poland to the northeast, Slovakia to the east, Austria to the south, and Germany to the west and northwest....
, 150,000 in Portugal, 100,000 in Spain, 35,000 in Turkey, 20,000 in the United States
United States
The United States of America is a federal constitutional republic comprising fifty states and a federal district...
and small significant numbers in Austria
Austria
Austria , officially the Republic of Austria , is a landlocked country of roughly 8.4 million people in Central Europe. It is bordered by the Czech Republic and Germany to the north, Slovakia and Hungary to the east, Slovenia and Italy to the south, and Switzerland and Liechtenstein to the...
, Belgium
Belgium
Belgium , officially the Kingdom of Belgium, is a federal state in Western Europe. It is a founding member of the European Union and hosts the EU's headquarters, and those of several other major international organisations such as NATO.Belgium is also a member of, or affiliated to, many...
, France
France
The French Republic , The French Republic , The French Republic , (commonly known as France , is a unitary semi-presidential republic in Western Europe with several overseas territories and islands located on other continents and in the Indian, Pacific, and Atlantic oceans. Metropolitan France...
, Germany
Germany
Germany , officially the Federal Republic of Germany , is a federal parliamentary republic in Europe. The country consists of 16 states while the capital and largest city is Berlin. Germany covers an area of 357,021 km2 and has a largely temperate seasonal climate...
, Greece
Greece
Greece , officially the Hellenic Republic , and historically Hellas or the Republic of Greece in English, is a country in southeastern Europe....
, Sweden
Sweden
Sweden , officially the Kingdom of Sweden , is a Nordic country on the Scandinavian Peninsula in Northern Europe. Sweden borders with Norway and Finland and is connected to Denmark by a bridge-tunnel across the Öresund....
, Switzerland
Switzerland
Switzerland name of one of the Swiss cantons. ; ; ; or ), in its full name the Swiss Confederation , is a federal republic consisting of 26 cantons, with Bern as the seat of the federal authorities. The country is situated in Western Europe,Or Central Europe depending on the definition....
and the UK. The largest number of Ukrainian workers abroad, about one million, are in the Russian Federation. Since 1992, 232,072 persons born in Ukraine have emigrated to the US.
From the point of view of the economic impact on natives, more appropriate than the absolute numbers is the volume of immigration as a proportion of the native population. Portugal and the Czech Republic have the highest rate of Ukrainian emigrants as a proportion of the native population.
See also
- Health in UkraineHealth in Ukraine-Demographic decline:Ukraine is considered to be in a demographic crisis due to its high death rate and a low birth rate. The current Ukrainian birth rate is 11 births/1,000 population, and the death rate is 16.3 deaths/1,000 population...
- Aging of EuropeAging of EuropeThe Ageing of Europe, also known as the greying of Europe, is a demographic phenomenon in Europe characterized by a decrease in fertility, a decrease in mortality rate, and a higher life expectancy among Europeans.-Overall trends:...
- Demographic history of Crimea
Ethnic groups in Ukraine
External links
- State Committee for Statistics of Ukraine, official web site (can be properly viewed only in Internet Explorer)
- Trafficking in and enslavement of women Follow-up to the Fourth World Conference on Women, 2–13 March 1998
- Migration News, 2001 University of California, Davis
- The demographic situation in Ukraine: present state. tendencies, and predictions, Razumkov CentreRazumkov CentreRazumkov Centre , or fully the Ukrainian Centre for Economic and Political Studies named after Olexander Razumkov , is a Ukrainian non-governmental public policy think tank....
- On the status of observance and protection of the rights of Ukrainian citizens abroad the Special Report of the Ukrainian Parliament Commissioner for Human Rights
- News on Trafficking of Ukrainian Women, 2000-01 Trafficking in Women from Ukraine Research Project, University of Rhode Island
- Caught Between East and West, Ukraine Struggles with Its Migration Policy By Olena Malynovska, National Institute for International Security Problems, Kyiv, January 2006
- Emigration from Ukraine, Oct 23rd 2003 The EconomistThe EconomistThe Economist is an English-language weekly news and international affairs publication owned by The Economist Newspaper Ltd. and edited in offices in the City of Westminster, London, England. Continuous publication began under founder James Wilson in September 1843...
(subscription required)