
Control chart
Encyclopedia
Control charts, also known as Shewhart charts or process-behaviour charts, in statistical process control
are tools used to determine whether or not a manufacturing or business process
is in a state of statistical control.
that allows significant change to be differentiated from the natural variability of the process.
The control chart can be seen as part of an objective and disciplined approach that enables correct decisions regarding control of the process, including whether or not to change process control parameters. Process parameters should never be adjusted for a process that is in control, as this will result in degraded process performance. A process that is stable but operating outside of desired limits (e.g. scrap rates may be in statistical control but above desired limits) needs to be improved through a deliberate effort to understand the causes of current performance and fundamentally improve the process.
The control chart is one of the seven basic tools of quality control
.
while working for Bell Labs
in the 1920s. The company's engineers had been seeking to improve the reliability of their telephony
transmission systems. Because amplifier
s and other equipment had to be buried underground, there was a business need to reduce the frequency of failures and repairs. By 1920 the engineers had already realized the importance of reducing variation in a manufacturing process. Moreover, they had realized that continual process-adjustment in reaction to non-conformance actually increased variation and degraded quality. Shewhart framed the problem in terms of Common- and special-causes of variation and, on May 16, 1924, wrote an internal memo introducing the control chart as a tool for distinguishing between the two. Dr. Shewhart's boss, George Edwards, recalled: "Dr. Shewhart prepared a little memorandum only about a page in length. About a third of that page was given over to a simple diagram which we would all recognize today as a schematic control chart. That diagram, and the short text which preceded and followed it, set forth all of the essential principles and considerations which are involved in what we know today as process quality control." Shewhart stressed that bringing a production process into a state of statistical control, where there is only common-cause variation, and keeping it in control, is necessary to predict future output and to manage a process economically.
Dr. Shewhart created the basis for the control chart and the concept of a state of statistical control by carefully designed experiments. While Dr. Shewhart drew from pure mathematical statistical theories, he understood data from physical processes typically produce a "normal distribution curve" (a Gaussian distribution, also commonly referred to as a "bell curve
"). He discovered that observed variation in manufacturing data did not always behave the same way as data in nature (Brownian motion
of particles). Dr. Shewhart concluded that while every process displays variation, some processes display controlled variation that is natural to the process, while others display uncontrolled variation that is not present in the process causal system at all times.
In 1924 or 1925, Shewhart's innovation came to the attention of W. Edwards Deming
, then working at the Hawthorne facility. Deming later worked at the United States Department of Agriculture
and then became the mathematical advisor to the United States Census Bureau
. Over the next half a century, Deming
became the foremost champion and proponent of Shewhart's work. After the defeat of Japan
at the close of World War II
, Deming
served as statistical consultant to the Supreme Commander of the Allied Powers
. His ensuing involvement in Japanese life, and long career as an industrial consultant there, spread Shewhart's thinking, and the use of the control chart, widely in Japanese manufacturing industry throughout the 1950s and 1960s.
The chart may have other optional features, including:
, a control chart "signaling" the presence of a special-cause requires immediate investigation.
This makes the control limits very important decision aids. The control limits tell you about process behavior and have no intrinsic relationship to any specification targets or engineering tolerance. In practice, the process mean (and hence the center line) may not coincide with the specified value (or target) of the quality characteristic because the process' design simply cannot deliver the process characteristic at the desired level.
Control charts limit specification limits
or targets because of the tendency of those involved with the process (e.g., machine operators) to focus on performing to specification when in fact the least-cost course of action is to keep process variation as low as possible. Attempting to make a process whose natural center is not the same as the target perform to target specification increases process variability and increases costs significantly and is the cause of much inefficiency in operations. Process capability
studies do examine the relationship between the natural process limits (the control limits) and specifications, however.
The purpose of control charts is to allow simple detection of events that are indicative of actual process change. This simple decision can be difficult where the process characteristic is continuously varying; the control chart provides statistically objective criteria of change. When change is detected and considered good its cause should be identified and possibly become the new way of working, where the change is bad then its cause should be identified and eliminated.
The purpose in adding warning limits or subdividing the control chart into zones is to provide early notification if something is amiss. Instead of immediately launching a process improvement effort to determine whether special causes are present, the Quality Engineer may temporarily increase the rate at which samples are taken from the process output until it's clear that the process is truly in control. Note that with three-sigma limits, common-cause variations result in signals less than once out of every twenty-two points for skewed processes and about once out of every three hundred seventy (1/370.4) points for normally-distributed processes. The two-sigma warning levels will be reached about once for every twenty-two (1/21.98) plotted points in normally-distributed data. (For example, the means of sufficiently large samples drawn from practically any underlying distribution whose variance exists are normally distributed, according to the Central Limit Theorem.)
Shewhart summarized the conclusions by saying:
Though he initially experimented with limits based on probability distribution
s, Shewhart ultimately wrote:
The control chart is intended as a heuristic. Deming
insisted that it is not a hypothesis test and is not motivated by the Neyman-Pearson lemma. He contended that the disjoint nature of population and sampling frame
in most industrial situations compromised the use of conventional statistical techniques. Deming
's intention was to seek insights into the cause system of a process ...under a wide range of unknowable circumstances, future and past.... He claimed that, under such conditions, 3-sigma limits provided ... a rational and economic guide to minimum economic loss... from the two errors:
(error) required is that of the common-cause variation in the process. Hence, the usual estimator
, in terms of sample variance, is not used as this estimates the total squared-error loss from both common- and special-causes of variation.
An alternative method is to use the relationship between the range
of a sample and its standard deviation
derived by Leonard H. C. Tippett
, an estimator which tends to be less influenced by the extreme observations which typify special-causes.
There has been particular controversy as to how long a run of observations, all on the same side of the centre line, should count as a signal, with 6, 7, 8 and 9 all being advocated by various writers.
The most important principle for choosing a set of rules is that the choice be made before the data is inspected. Choosing rules once the data have been seen tends to increase the Type I error rate owing to testing effects suggested by the data
.
and against Shewhart's spirit, adopted control charts, replacing 3-sigma limits with limits based on percentile
s of the normal distribution. This move continues to be represented by John Oakland and others but has been widely deprecated by writers in the Shewhart-Deming tradition.
It is known that even when a process is in control (that is, no special causes are present in the system), there is approximately a 0.27% probability of a point exceeding 3-sigma control limits. So, even an in control process plotted on a properly constructed control chart will eventually signal the possible presence of a special cause, even though one may not have actually occurred. For a Shewhart control chart using 3-sigma limits, this false alarm occurs on average once every 1/0.0027 or 370.4 observations. Therefore, the in-control average run length (or in-control ARL) of a Shewhart chart is 370.4.
Meanwhile, if a special cause does occur, it may not be of sufficient magnitude for the chart to produce an immediate alarm condition. If a special cause occurs, one can describe that cause by measuring the change in the mean and/or variance of the process in question. When those changes are quantified, it is possible to determine the out-of-control ARL for the chart.
It turns out that Shewhart charts are quite good at detecting large changes in the process mean or variance, as their out-of-control ARLs are fairly short in these cases. However, for smaller changes (such as a 1- or 2-sigma change in the mean), the Shewhart chart does not detect these changes efficiently. Other types of control charts have been developed, such as the EWMA chart
, the CUSUM
chart and the real-time contrasts chart, which detect smaller changes more efficiently by making use of information from observations collected prior to the most recent data point.
Most control charts work best for numeric data with Gaussian assumptions. The real-time contrasts chart was proposed able to handle process data with complex characteristics, e.g. high-dimensional, mix numerical and categorical, missing-valued, non-Gaussian, non-linear relationship.
. However, the principle is itself controversial and supporters of control charts further argue that, in general, it is impossible to specify a likelihood function
for a process not in statistical control, especially where knowledge about the cause system of the process is weak.
Some authors have criticised the use of average run lengths (ARLs) for comparing control chart performance, because that average usually follows a geometric distribution, which has high variability and difficulties.
Some authors have criticized that most control charts focus on numeric data. Nowadays, process data can be much more complex, e.g. non-Gaussian, mix numerical and categorical, missing-valued.
! Chart
! Process observation
! Process observations relationships
! Process observations type
! Size of shift to detect>
 and R chart
Quality characteristic measurement within one subgroup
Independent
Variables
Large (≥ 1.5σ)
 and s chart
Quality characteristic measurement within one subgroup
Independent
Variables
Large (≥ 1.5σ)
Shewhart individuals control chart (ImR chart or XmR chart)
Quality characteristic measurement for one observation
Independent
Variables†
Large (≥ 1.5σ)
Three-way chart
Quality characteristic measurement within one subgroup
Independent
Variables
Large (≥ 1.5σ)
p-chart
Fraction nonconforming within one subgroup
Independent
Attributes†
Large (≥ 1.5σ)
np-chart
Number nonconforming within one subgroup
Independent
Attributes†
Large (≥ 1.5σ)
c-chart
Number of nonconformances within one subgroup
Independent
Attributes†
Large (≥ 1.5σ)
u-chart
Nonconformances per unit within one subgroup
Independent
Attributes†
Large (≥ 1.5σ)
EWMA chart
Exponentially weighted moving average of quality characteristic measurement within one subgroup
Independent
Attributes or variables
Small (< 1.5σ)
CUSUM
chart
Cumulative sum of quality characteristic measurement within one subgroup
Independent
Attributes or variables
Small (< 1.5σ)
Time series
model
Quality characteristic measurement within one subgroup
Autocorrelated
Attributes or variables
N/A
Regression control chart
Quality characteristic measurement within one subgroup
Dependent of process control variables
Variables
Large (≥ 1.5σ)
Real-time contrasts chart
Sliding window of quality characteristic measurement within one subgroup
Independent
Attributes or variables
Small (< 1.5σ)
†Some practitioners also recommend the use of Individuals charts for attribute data, particularly when the assumptions of either binomially-distributed data (p- and np-charts) or Poisson-distributed data (u- and c-charts) are violated. Two primary justifications are given for this practice. First, normality is not necessary for statistical control, so the Individuals chart may be used with non-normal data. Second, attribute charts derive the measure of dispersion directly from the mean proportion (by assuming a probability distribution), while Individuals charts derive the measure of dispersion from the data, independent of the mean, making Individuals charts more robust than attributes charts to violations of the assumptions about the distribution of the underlying population. It is sometimes noted that the substitution of the Individuals chart works best for large counts, when the binomial and Poisson distribution
s approximate a normal distribution. i.e. when the number of trials for p- and np-charts or for u- and c-charts.
Critics of this approach argue that control charts should not be used then their underlying assumptions are violated, such as when process data is neither normally distributed nor binomially (or Poisson) distributed. Such processes are not in control and should be improved before the application of control charts. Additionally, application of the charts in the presence of such deviations increases the type I and type II error
rates of the control charts, and may make the chart of little practical use.
Statistical process control
Statistical process control is the application of statistical methods to the monitoring and control of a process to ensure that it operates at its full potential to produce conforming product. Under SPC, a process behaves predictably to produce as much conforming product as possible with the least...
are tools used to determine whether or not a manufacturing or business process
Business process
A business process or business method is a collection of related, structured activities or tasks that produce a specific service or product for a particular customer or customers...
is in a state of statistical control.
Overview
If analysis of the control chart indicates that the process is currently under control (i.e. is stable, with variation only coming from sources common to the process) then no corrections or changes to process control parameters are needed or desirable. In addition, data from the process can be used to predict the future performance of the process. If the chart indicates that the process being monitored is not in control, analysis of the chart can help determine the sources of variation, which can then be eliminated to bring the process back into control. A control chart is a specific kind of run chartRun Chart
A run chart, also known as a run-sequence plot is a graph that displays observed data in a time sequence. Often, the data displayed represent some aspect of the output or performance of a manufacturing or other business process.- Overview :...
that allows significant change to be differentiated from the natural variability of the process.
The control chart can be seen as part of an objective and disciplined approach that enables correct decisions regarding control of the process, including whether or not to change process control parameters. Process parameters should never be adjusted for a process that is in control, as this will result in degraded process performance. A process that is stable but operating outside of desired limits (e.g. scrap rates may be in statistical control but above desired limits) needs to be improved through a deliberate effort to understand the causes of current performance and fundamentally improve the process.
The control chart is one of the seven basic tools of quality control
Quality control
Quality control, or QC for short, is a process by which entities review the quality of all factors involved in production. This approach places an emphasis on three aspects:...
.
History
The control chart was invented by Walter A. ShewhartWalter A. Shewhart
Walter Andrew Shewhart March 18, 1891 - March 11, 1967) was an American physicist, engineer and statistician, sometimes known as the father of statistical quality control.W...
while working for Bell Labs
Bell Labs
Bell Laboratories is the research and development subsidiary of the French-owned Alcatel-Lucent and previously of the American Telephone & Telegraph Company , half-owned through its Western Electric manufacturing subsidiary.Bell Laboratories operates its...
in the 1920s. The company's engineers had been seeking to improve the reliability of their telephony
Telephony
In telecommunications, telephony encompasses the general use of equipment to provide communication over distances, specifically by connecting telephones to each other....
transmission systems. Because amplifier
Amplifier
Generally, an amplifier or simply amp, is a device for increasing the power of a signal.In popular use, the term usually describes an electronic amplifier, in which the input "signal" is usually a voltage or a current. In audio applications, amplifiers drive the loudspeakers used in PA systems to...
s and other equipment had to be buried underground, there was a business need to reduce the frequency of failures and repairs. By 1920 the engineers had already realized the importance of reducing variation in a manufacturing process. Moreover, they had realized that continual process-adjustment in reaction to non-conformance actually increased variation and degraded quality. Shewhart framed the problem in terms of Common- and special-causes of variation and, on May 16, 1924, wrote an internal memo introducing the control chart as a tool for distinguishing between the two. Dr. Shewhart's boss, George Edwards, recalled: "Dr. Shewhart prepared a little memorandum only about a page in length. About a third of that page was given over to a simple diagram which we would all recognize today as a schematic control chart. That diagram, and the short text which preceded and followed it, set forth all of the essential principles and considerations which are involved in what we know today as process quality control." Shewhart stressed that bringing a production process into a state of statistical control, where there is only common-cause variation, and keeping it in control, is necessary to predict future output and to manage a process economically.
Dr. Shewhart created the basis for the control chart and the concept of a state of statistical control by carefully designed experiments. While Dr. Shewhart drew from pure mathematical statistical theories, he understood data from physical processes typically produce a "normal distribution curve" (a Gaussian distribution, also commonly referred to as a "bell curve
Bell curve
Bell curve can refer to:* A Gaussian function, a specific kind of function whose graph is a bell-shaped curve* Normal distribution, whose density function is a Gaussian function...
"). He discovered that observed variation in manufacturing data did not always behave the same way as data in nature (Brownian motion
Brownian motion
Brownian motion or pedesis is the presumably random drifting of particles suspended in a fluid or the mathematical model used to describe such random movements, which is often called a particle theory.The mathematical model of Brownian motion has several real-world applications...
of particles). Dr. Shewhart concluded that while every process displays variation, some processes display controlled variation that is natural to the process, while others display uncontrolled variation that is not present in the process causal system at all times.
In 1924 or 1925, Shewhart's innovation came to the attention of W. Edwards Deming
W. Edwards Deming
William Edwards Deming was an American statistician, professor, author, lecturer and consultant. He is perhaps best known for his work in Japan...
, then working at the Hawthorne facility. Deming later worked at the United States Department of Agriculture
United States Department of Agriculture
The United States Department of Agriculture is the United States federal executive department responsible for developing and executing U.S. federal government policy on farming, agriculture, and food...
and then became the mathematical advisor to the United States Census Bureau
United States Census Bureau
The United States Census Bureau is the government agency that is responsible for the United States Census. It also gathers other national demographic and economic data...
. Over the next half a century, Deming
W. Edwards Deming
William Edwards Deming was an American statistician, professor, author, lecturer and consultant. He is perhaps best known for his work in Japan...
became the foremost champion and proponent of Shewhart's work. After the defeat of Japan
Japan
Japan is an island nation in East Asia. Located in the Pacific Ocean, it lies to the east of the Sea of Japan, China, North Korea, South Korea and Russia, stretching from the Sea of Okhotsk in the north to the East China Sea and Taiwan in the south...
at the close of World War II
World War II
World War II, or the Second World War , was a global conflict lasting from 1939 to 1945, involving most of the world's nations—including all of the great powers—eventually forming two opposing military alliances: the Allies and the Axis...
, Deming
W. Edwards Deming
William Edwards Deming was an American statistician, professor, author, lecturer and consultant. He is perhaps best known for his work in Japan...
served as statistical consultant to the Supreme Commander of the Allied Powers
SCAP
SCAP may refer to:* Société de Constructions Automobiles* Security Content Automation Protocol* Separation of Content and Presentation* Shackled City Adventure Path* SREBP cleavage activating protein...
. His ensuing involvement in Japanese life, and long career as an industrial consultant there, spread Shewhart's thinking, and the use of the control chart, widely in Japanese manufacturing industry throughout the 1950s and 1960s.
Chart details
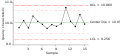
A control chart consists of:- Points representing a statistic (e.g., a mean, range, proportion) of measurements of a quality characteristic in samples taken from the process at different times [the data]
- The mean of this statistic using all the samples is calculated (e.g., the mean of the means, mean of the ranges, mean of the proportions)
- A center line is drawn at the value of the mean of the statistic
- The standard error (e.g., standard deviation/sqrt(n) for the mean) of the statistic is also calculated using all the samples
- Upper and lower control limits (sometimes called "natural process limits") that indicate the threshold at which the process output is considered statistically 'unlikely' are drawn typically at 3 standard errors from the center line
The chart may have other optional features, including:
- Upper and lower warning limits, drawn as separate lines, typically two standard errors above and below the center line
- Division into zones, with the addition of rules governing frequencies of observations in each zone
- Annotation with events of interest, as determined by the Quality Engineer in charge of the process's quality
Chart usage
If the process is in control (and the process statistic is normal), 99.7300% of all the points will fall between the control limits. Any observations outside the limits, or systematic patterns within, suggest the introduction of a new (and likely unanticipated) source of variation, known as a special-cause variation. Since increased variation means increased quality costsQuality costs
The concept of quality costs is a means to quantify the total cost of quality-related efforts and deficiencies. It was first described by Armand V. Feigenbaum in a 1956 Harvard Business Review article....
, a control chart "signaling" the presence of a special-cause requires immediate investigation.
This makes the control limits very important decision aids. The control limits tell you about process behavior and have no intrinsic relationship to any specification targets or engineering tolerance. In practice, the process mean (and hence the center line) may not coincide with the specified value (or target) of the quality characteristic because the process' design simply cannot deliver the process characteristic at the desired level.
Control charts limit specification limits
Specification (technical standard)
A specification is an explicit set of requirements to be satisfied by a material, product, or service. Should a material, product or service fail to meet one or more of the applicable specifications, it may be referred to as being out of specification;the abbreviation OOS may also be used...
or targets because of the tendency of those involved with the process (e.g., machine operators) to focus on performing to specification when in fact the least-cost course of action is to keep process variation as low as possible. Attempting to make a process whose natural center is not the same as the target perform to target specification increases process variability and increases costs significantly and is the cause of much inefficiency in operations. Process capability
Process capability
A process is a unique combination of tools, materials, methods, and people engaged in producing a measurable output; for example a manufacturing line for machine parts...
studies do examine the relationship between the natural process limits (the control limits) and specifications, however.
The purpose of control charts is to allow simple detection of events that are indicative of actual process change. This simple decision can be difficult where the process characteristic is continuously varying; the control chart provides statistically objective criteria of change. When change is detected and considered good its cause should be identified and possibly become the new way of working, where the change is bad then its cause should be identified and eliminated.
The purpose in adding warning limits or subdividing the control chart into zones is to provide early notification if something is amiss. Instead of immediately launching a process improvement effort to determine whether special causes are present, the Quality Engineer may temporarily increase the rate at which samples are taken from the process output until it's clear that the process is truly in control. Note that with three-sigma limits, common-cause variations result in signals less than once out of every twenty-two points for skewed processes and about once out of every three hundred seventy (1/370.4) points for normally-distributed processes. The two-sigma warning levels will be reached about once for every twenty-two (1/21.98) plotted points in normally-distributed data. (For example, the means of sufficiently large samples drawn from practically any underlying distribution whose variance exists are normally distributed, according to the Central Limit Theorem.)
Choice of limits
Shewhart set 3-sigma (3-standard error) limits on the following basis.- The coarse result of Chebyshev's inequalityChebyshev's inequalityIn probability theory, Chebyshev’s inequality guarantees that in any data sample or probability distribution,"nearly all" values are close to the mean — the precise statement being that no more than 1/k2 of the distribution’s values can be more than k standard deviations away from the mean...
that, for any probability distributionProbability distributionIn probability theory, a probability mass, probability density, or probability distribution is a function that describes the probability of a random variable taking certain values....
, the probabilityProbabilityProbability is ordinarily used to describe an attitude of mind towards some proposition of whose truth we arenot certain. The proposition of interest is usually of the form "Will a specific event occur?" The attitude of mind is of the form "How certain are we that the event will occur?" The...
of an outcome greater than k standard deviationStandard deviationStandard deviation is a widely used measure of variability or diversity used in statistics and probability theory. It shows how much variation or "dispersion" there is from the average...
s from the meanMeanIn statistics, mean has two related meanings:* the arithmetic mean .* the expected value of a random variable, which is also called the population mean....
is at most 1/k2. - The finer result of the Vysochanskii-Petunin inequalityVysochanskiï-Petunin inequalityIn probability theory, the Vysochanskij–Petunin inequality gives a lower bound for the probability that a random variable with finite variance lies within a certain number of standard deviations of the variable's mean, or equivalently an upper bound for the probability that it lies further away....
, that for any unimodalMonotonic functionIn mathematics, a monotonic function is a function that preserves the given order. This concept first arose in calculus, and was later generalized to the more abstract setting of order theory....
probability distributionProbability distributionIn probability theory, a probability mass, probability density, or probability distribution is a function that describes the probability of a random variable taking certain values....
, the probabilityProbabilityProbability is ordinarily used to describe an attitude of mind towards some proposition of whose truth we arenot certain. The proposition of interest is usually of the form "Will a specific event occur?" The attitude of mind is of the form "How certain are we that the event will occur?" The...
of an outcome greater than k standard deviationStandard deviationStandard deviation is a widely used measure of variability or diversity used in statistics and probability theory. It shows how much variation or "dispersion" there is from the average...
s from the meanMeanIn statistics, mean has two related meanings:* the arithmetic mean .* the expected value of a random variable, which is also called the population mean....
is at most 4/(9k2). - The empirical investigation of sundry probability distributionProbability distributionIn probability theory, a probability mass, probability density, or probability distribution is a function that describes the probability of a random variable taking certain values....
s reveals that at least 99% of observations occurred within three standard deviationStandard deviationStandard deviation is a widely used measure of variability or diversity used in statistics and probability theory. It shows how much variation or "dispersion" there is from the average...
s of the meanMeanIn statistics, mean has two related meanings:* the arithmetic mean .* the expected value of a random variable, which is also called the population mean....
.
Shewhart summarized the conclusions by saying:
... the fact that the criterion which we happen to use has a fine ancestry in highbrow statistical theorems does not justify its use. Such justification must come from empirical evidence that it works. As the practical engineer might say, the proof of the pudding is in the eating.
Though he initially experimented with limits based on probability distribution
Probability distribution
In probability theory, a probability mass, probability density, or probability distribution is a function that describes the probability of a random variable taking certain values....
s, Shewhart ultimately wrote:
Some of the earliest attempts to characterize a state of statistical control were inspired by the belief that there existed a special form of frequency function f and it was early argued that the normal law characterized such a state. When the normal law was found to be inadequate, then generalized functional forms were tried. Today, however, all hopes of finding a unique functional form f are blasted.
The control chart is intended as a heuristic. Deming
W. Edwards Deming
William Edwards Deming was an American statistician, professor, author, lecturer and consultant. He is perhaps best known for his work in Japan...
insisted that it is not a hypothesis test and is not motivated by the Neyman-Pearson lemma. He contended that the disjoint nature of population and sampling frame
Sampling frame
In statistics, a sampling frame is the source material or device from which a sample is drawn. It is a list of all those within a population who can be sampled, and may include individuals, households or institutions....
in most industrial situations compromised the use of conventional statistical techniques. Deming
W. Edwards Deming
William Edwards Deming was an American statistician, professor, author, lecturer and consultant. He is perhaps best known for his work in Japan...
's intention was to seek insights into the cause system of a process ...under a wide range of unknowable circumstances, future and past.... He claimed that, under such conditions, 3-sigma limits provided ... a rational and economic guide to minimum economic loss... from the two errors:
- Ascribe a variation or a mistake to a special cause (assignable cause) when in fact the cause belongs to the system (common cause). (Also known as a Type I errorType I and type II errorsIn statistical test theory the notion of statistical error is an integral part of hypothesis testing. The test requires an unambiguous statement of a null hypothesis, which usually corresponds to a default "state of nature", for example "this person is healthy", "this accused is not guilty" or...
) - Ascribe a variation or a mistake to the system (common causes) when in fact the cause was a special cause (assignable cause). (Also known as a Type II errorType I and type II errorsIn statistical test theory the notion of statistical error is an integral part of hypothesis testing. The test requires an unambiguous statement of a null hypothesis, which usually corresponds to a default "state of nature", for example "this person is healthy", "this accused is not guilty" or...
)
Calculation of standard deviation
As for the calculation of control limits, the standard deviationStandard deviation
Standard deviation is a widely used measure of variability or diversity used in statistics and probability theory. It shows how much variation or "dispersion" there is from the average...
(error) required is that of the common-cause variation in the process. Hence, the usual estimator
Estimator
In statistics, an estimator is a rule for calculating an estimate of a given quantity based on observed data: thus the rule and its result are distinguished....
, in terms of sample variance, is not used as this estimates the total squared-error loss from both common- and special-causes of variation.
An alternative method is to use the relationship between the range
Range (statistics)
In the descriptive statistics, the range is the length of the smallest interval which contains all the data. It is calculated by subtracting the smallest observation from the greatest and provides an indication of statistical dispersion.It is measured in the same units as the data...
of a sample and its standard deviation
Standard deviation
Standard deviation is a widely used measure of variability or diversity used in statistics and probability theory. It shows how much variation or "dispersion" there is from the average...
derived by Leonard H. C. Tippett
Leonard Henry Caleb Tippett
Leonard Henry Caleb Tippett was an English physicist and statistician.Born in London, Tippett graduated in physics in the early 1920s at Imperial College. He studied for his Master of Science in statistics under Professor Karl Pearson at the Galton Laboratory, University College London and R. A....
, an estimator which tends to be less influenced by the extreme observations which typify special-causes.
Rules for detecting signals
The most common sets are:- The Western Electric rulesWestern Electric rulesIn Statistical Process Control, the Western Electric Rules are decision rules for detecting "out-of-control" or non-random conditions on control charts. Locations of the observations relative to the control chart control limits and centerline indicate whether the process in question should be...
- The WheelerDonald J. WheelerDonald J. Wheeler is an American author, statistician and expert in quality control.Wheeler graduated from the University of Texas in 1966 and holds M.S. and Ph.D. degrees in statistics from Southern Methodist University. From 1970 to 1982 he taught in the Statistics Department at the University of...
rules (equivalent to the Western Electric zone tests) - The Nelson rulesNelson rulesNelson rules are a method in process control of determining if some measured variable is out of control . Rules, for detecting "out-of-control" or non-random conditions were first postulated by Walter A. Shewhart in the 1920s...
There has been particular controversy as to how long a run of observations, all on the same side of the centre line, should count as a signal, with 6, 7, 8 and 9 all being advocated by various writers.
The most important principle for choosing a set of rules is that the choice be made before the data is inspected. Choosing rules once the data have been seen tends to increase the Type I error rate owing to testing effects suggested by the data
Testing hypotheses suggested by the data
In statistics, hypotheses suggested by the data, if tested using the data set that suggested them, are likely to be accepted even when they are not true...
.
Alternative bases
In 1935, the British Standards Institution, under the influence of Egon PearsonEgon Pearson
Egon Sharpe Pearson, CBE FRS was the only son of Karl Pearson, and like his father, a leading British statistician....
and against Shewhart's spirit, adopted control charts, replacing 3-sigma limits with limits based on percentile
Percentile
In statistics, a percentile is the value of a variable below which a certain percent of observations fall. For example, the 20th percentile is the value below which 20 percent of the observations may be found...
s of the normal distribution. This move continues to be represented by John Oakland and others but has been widely deprecated by writers in the Shewhart-Deming tradition.
Performance of control charts
When a point falls outside of the limits established for a given control chart, those responsible for the underlying process are expected to determine whether a special cause has occurred. If one has, it is appropriate to determine if the results with the special cause are better than or worse than results from common causes alone. If worse, then that cause should be eliminated if possible. If better, it may be appropriate to intentionally retain the special cause within the system producing the results.It is known that even when a process is in control (that is, no special causes are present in the system), there is approximately a 0.27% probability of a point exceeding 3-sigma control limits. So, even an in control process plotted on a properly constructed control chart will eventually signal the possible presence of a special cause, even though one may not have actually occurred. For a Shewhart control chart using 3-sigma limits, this false alarm occurs on average once every 1/0.0027 or 370.4 observations. Therefore, the in-control average run length (or in-control ARL) of a Shewhart chart is 370.4.
Meanwhile, if a special cause does occur, it may not be of sufficient magnitude for the chart to produce an immediate alarm condition. If a special cause occurs, one can describe that cause by measuring the change in the mean and/or variance of the process in question. When those changes are quantified, it is possible to determine the out-of-control ARL for the chart.
It turns out that Shewhart charts are quite good at detecting large changes in the process mean or variance, as their out-of-control ARLs are fairly short in these cases. However, for smaller changes (such as a 1- or 2-sigma change in the mean), the Shewhart chart does not detect these changes efficiently. Other types of control charts have been developed, such as the EWMA chart
EWMA chart
In statistical quality control, the EWMA chart is a type of control chart used to monitor either variables or attributes-type data using the monitored business or industrial process's entire history of output...
, the CUSUM
CUSUM
In statistical quality control, the CUSUM is a sequential analysis technique due to E. S. Page of the University of Cambridge. It is typically used for monitoring change detection...
chart and the real-time contrasts chart, which detect smaller changes more efficiently by making use of information from observations collected prior to the most recent data point.
Most control charts work best for numeric data with Gaussian assumptions. The real-time contrasts chart was proposed able to handle process data with complex characteristics, e.g. high-dimensional, mix numerical and categorical, missing-valued, non-Gaussian, non-linear relationship.
Criticisms
Several authors have criticised the control chart on the grounds that it violates the likelihood principleLikelihood principle
In statistics,the likelihood principle is a controversial principle of statistical inference which asserts that all of the information in a sample is contained in the likelihood function....
. However, the principle is itself controversial and supporters of control charts further argue that, in general, it is impossible to specify a likelihood function
Likelihood function
In statistics, a likelihood function is a function of the parameters of a statistical model, defined as follows: the likelihood of a set of parameter values given some observed outcomes is equal to the probability of those observed outcomes given those parameter values...
for a process not in statistical control, especially where knowledge about the cause system of the process is weak.
Some authors have criticised the use of average run lengths (ARLs) for comparing control chart performance, because that average usually follows a geometric distribution, which has high variability and difficulties.
Some authors have criticized that most control charts focus on numeric data. Nowadays, process data can be much more complex, e.g. non-Gaussian, mix numerical and categorical, missing-valued.
Types of charts
! Process observation
! Process observations relationships
! Process observations type
! Size of shift to detect>
and R chart and s chartEWMA chart
In statistical quality control, the EWMA chart is a type of control chart used to monitor either variables or attributes-type data using the monitored business or industrial process's entire history of output...
CUSUM
In statistical quality control, the CUSUM is a sequential analysis technique due to E. S. Page of the University of Cambridge. It is typically used for monitoring change detection...
chart
Time series
In statistics, signal processing, econometrics and mathematical finance, a time series is a sequence of data points, measured typically at successive times spaced at uniform time intervals. Examples of time series are the daily closing value of the Dow Jones index or the annual flow volume of the...
model
Regression control chart
In statistical quality control, the regression control chart allows for monitoring a change in a process where two or more variables are correlated. The change in a dependent variable can be detected and compensatory change in the independent variable can be recommended...
†Some practitioners also recommend the use of Individuals charts for attribute data, particularly when the assumptions of either binomially-distributed data (p- and np-charts) or Poisson-distributed data (u- and c-charts) are violated. Two primary justifications are given for this practice. First, normality is not necessary for statistical control, so the Individuals chart may be used with non-normal data. Second, attribute charts derive the measure of dispersion directly from the mean proportion (by assuming a probability distribution), while Individuals charts derive the measure of dispersion from the data, independent of the mean, making Individuals charts more robust than attributes charts to violations of the assumptions about the distribution of the underlying population. It is sometimes noted that the substitution of the Individuals chart works best for large counts, when the binomial and Poisson distribution
Poisson distribution
In probability theory and statistics, the Poisson distribution is a discrete probability distribution that expresses the probability of a given number of events occurring in a fixed interval of time and/or space if these events occur with a known average rate and independently of the time since...
s approximate a normal distribution. i.e. when the number of trials for p- and np-charts or for u- and c-charts.
Critics of this approach argue that control charts should not be used then their underlying assumptions are violated, such as when process data is neither normally distributed nor binomially (or Poisson) distributed. Such processes are not in control and should be improved before the application of control charts. Additionally, application of the charts in the presence of such deviations increases the type I and type II error
Type I and type II errors
In statistical test theory the notion of statistical error is an integral part of hypothesis testing. The test requires an unambiguous statement of a null hypothesis, which usually corresponds to a default "state of nature", for example "this person is healthy", "this accused is not guilty" or...
rates of the control charts, and may make the chart of little practical use.
See also
- Common cause and special causeCommon cause and special causeCommon- and special-causes are the two distinct origins of variation in a process, as defined in the statistical thinking and methods of Walter A. Shewhart and W. Edwards Deming...
- Analytic and enumerative statistical studiesAnalytic and enumerative statistical studiesAnalytic and enumerative statistical studies are two types of scientific studies:In any statistical study the ultimate aim is to provide a rational basis for action. Enumerative and analytic studies differ by where the action is taken...
- W. Edwards DemingW. Edwards DemingWilliam Edwards Deming was an American statistician, professor, author, lecturer and consultant. He is perhaps best known for his work in Japan...
- Statistical process controlStatistical process controlStatistical process control is the application of statistical methods to the monitoring and control of a process to ensure that it operates at its full potential to produce conforming product. Under SPC, a process behaves predictably to produce as much conforming product as possible with the least...
- Total Quality ManagementTotal Quality ManagementTotal quality management or TQM is an integrative philosophy of management for continuously improving the quality of products and processes....
- Six SigmaSix SigmaSix Sigma is a business management strategy originally developed by Motorola, USA in 1986. , it is widely used in many sectors of industry.Six Sigma seeks to improve the quality of process outputs by identifying and removing the causes of defects and minimizing variability in manufacturing and...
- Process capabilityProcess capabilityA process is a unique combination of tools, materials, methods, and people engaged in producing a measurable output; for example a manufacturing line for machine parts...
- Seven Basic Tools of Quality
External links
- Note: Before adding your company's link, please read WP:Spam#External link spamming and WP:External links#Links normally to be avoided.