

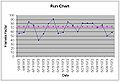
Run Chart
Encyclopedia
Overview
Run sequence plots are an easy way to graphically summarize an univariateUnivariate
In mathematics, univariate refers to an expression, equation, function or polynomial of only one variable. Objects of any of these types but involving more than one variable may be called multivariate...
data set. A common assumption of univariate
Univariate
In mathematics, univariate refers to an expression, equation, function or polynomial of only one variable. Objects of any of these types but involving more than one variable may be called multivariate...
data sets is that they behave like:
- random drawings;
- from a fixed distribution;
- with a common location; and
- with a common scale.
With run sequence plots, shifts in location and scale are typically quite evident. Also, outliers can easily be detected.
Run charts are analyzed to find anomalies in data that suggest shifts in a process over time or special factors that may be influencing the variability of a process. Typical factors considered include unusually long "runs" of data points above or below the average line, the total number of such runs in the data set, and unusually long series of consecutive increases or decreases.
Run charts are similar in some regards to the control chart
Control chart
Control charts, also known as Shewhart charts or process-behaviour charts, in statistical process control are tools used to determine whether or not a manufacturing or business process is in a state of statistical control.- Overview :...
s used in statistical process control
Statistical process control
Statistical process control is the application of statistical methods to the monitoring and control of a process to ensure that it operates at its full potential to produce conforming product. Under SPC, a process behaves predictably to produce as much conforming product as possible with the least...
, but do not show the control limits of the process. They are therefore simpler to produce, but do not allow for the full range of analytic techniques supported by control charts.