
Nelson rules
Encyclopedia
Nelson rules are a method in process control
of determining if some measured variable is out of control (unpredictable versus consistent). Rules, for detecting "out-of-control" or non-random conditions were first postulated by Walter A. Shewhart
in the 1920s. The Nelson rules were first published in the October 1984 issue of the Journal of Quality Technology in an article by Lloyd S Nelson .
The rules are applied to a control chart
on which the magnitude of some variable
is plotted against time. The rules are based around the mean
value and the standard deviation
of the samples.
The above eight rules apply to a chart of a variable value.
A second chart, the moving range
chart, can also used but only with rules 1, 2, 3 and 4. Such a chart plots a graph of the maximum value - minimum value of N adjacent points against the time sample of the range.
An example moving range: if N = 3 and values are 1, 3, 5, 3, 3, 2, 4, 5 then the sets of adjacent points are (1,3,5) (3,5,3) (5,3,3) (3,3,2) (3,2,4) (2,4,5) resulting in moving range values of (5-1) (5-3) (5-3) (3-2) (4-2) (5-2) = 4, 2, 2, 1, 2, 3.
Applying these rules indicates when a potential "out of control" situation has arisen. However there will always be some false alerts and the more rules applied the more will occur. For some processes, it may be beneficial to omit one or more rules. Equally there may be some missing alerts where some specific "out of control" situation is not detected. Empirically, the detection accuracy is good.
Process control
Process control is a statistics and engineering discipline that deals with architectures, mechanisms and algorithms for maintaining the output of a specific process within a desired range...
of determining if some measured variable is out of control (unpredictable versus consistent). Rules, for detecting "out-of-control" or non-random conditions were first postulated by Walter A. Shewhart
Walter A. Shewhart
Walter Andrew Shewhart March 18, 1891 - March 11, 1967) was an American physicist, engineer and statistician, sometimes known as the father of statistical quality control.W...
in the 1920s. The Nelson rules were first published in the October 1984 issue of the Journal of Quality Technology in an article by Lloyd S Nelson .
The rules are applied to a control chart
Control chart
Control charts, also known as Shewhart charts or process-behaviour charts, in statistical process control are tools used to determine whether or not a manufacturing or business process is in a state of statistical control.- Overview :...
on which the magnitude of some variable
Variable (mathematics)
In mathematics, a variable is a value that may change within the scope of a given problem or set of operations. In contrast, a constant is a value that remains unchanged, though often unknown or undetermined. The concepts of constants and variables are fundamental to many areas of mathematics and...
is plotted against time. The rules are based around the mean
Mean
In statistics, mean has two related meanings:* the arithmetic mean .* the expected value of a random variable, which is also called the population mean....
value and the standard deviation
Standard deviation
Standard deviation is a widely used measure of variability or diversity used in statistics and probability theory. It shows how much variation or "dispersion" there is from the average...
of the samples.
| Rule | Description | Chart Example | Problem Indicated |
|---|---|---|---|
| |
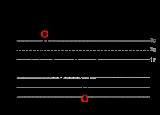
One point is more than 3 standard deviations from the mean. | 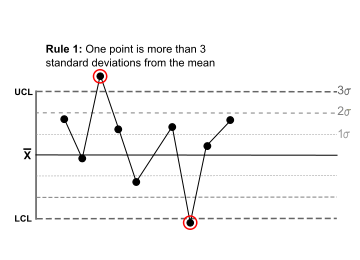 |
One sample (two shown in this case) is grossly out of control. |
| |
Nine (or more) points in a row are on the same side of the mean. | 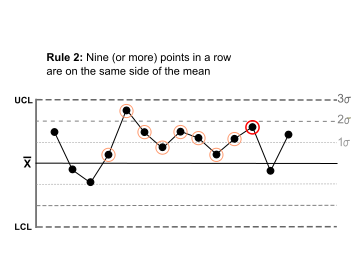 |
Some prolonged bias exists. |
| |
Six (or more) points in a row are continually increasing (or decreasing). | 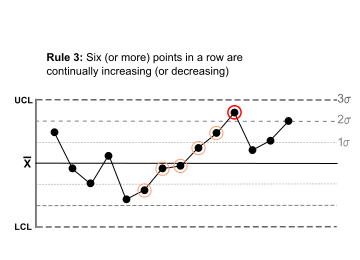 |
A trend Trend estimation Trend estimation is a statistical technique to aid interpretation of data. When a series of measurements of a process are treated as a time series, trend estimation can be used to make and justify statements about tendencies in the data... exists. |
| |
Fourteen (or more) points in a row alternate in direction, increasing then decreasing. | 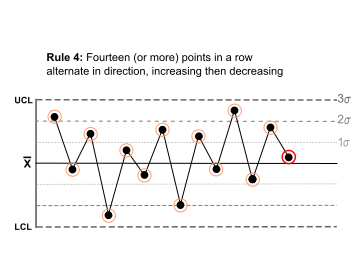 |
This much oscillation Oscillation (mathematics) In mathematics, oscillation is the behaviour of a sequence of real numbers or a real-valued function, which does not converge, but also does not diverge to +∞ or −∞; that is, oscillation is the failure to have a limit, and is also a quantitative measure for that.Oscillation is defined as the... is beyond noise. This is directional and the position of the mean and size of the standard deviation do not affect this rule. |
| |
Two (or three) out of three points in a row are more than 2 standard deviations from the mean in the same direction. | 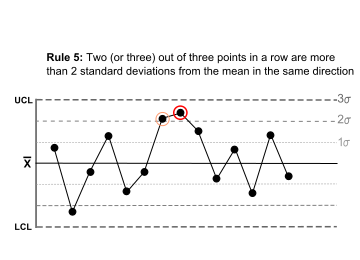 |
There is a medium tendency for samples to be mediumly out of control. The side of the mean for the third point is unspecified. |
| |
Four (or five) out of five points in a row are more than 1 standard deviation from the mean in the same direction. | 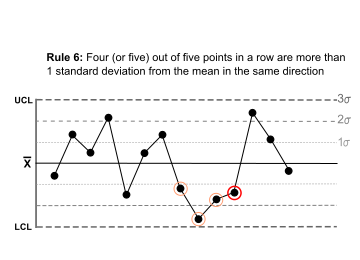 |
There is a strong tendency for samples to be slightly out of control. The side of the mean for the fifth point is unspecified. |
| |
Fifteen points in a row are all within 1 standard deviation of the mean on either side of the mean. | 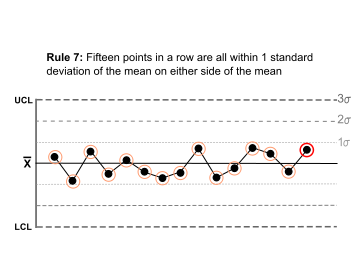 |
With 1 standard deviation, greater variation would be expected. |
| |
Eight points in a row exist with none within 1 standard deviation of the mean and the points are in both directions from the mean. | 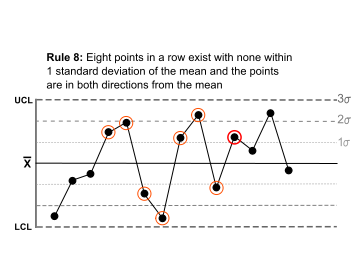 |
Jumping from above to below whilst missing the first standard deviation band is rarely random. |
The above eight rules apply to a chart of a variable value.
A second chart, the moving range
Range (statistics)
In the descriptive statistics, the range is the length of the smallest interval which contains all the data. It is calculated by subtracting the smallest observation from the greatest and provides an indication of statistical dispersion.It is measured in the same units as the data...
chart, can also used but only with rules 1, 2, 3 and 4. Such a chart plots a graph of the maximum value - minimum value of N adjacent points against the time sample of the range.
An example moving range: if N = 3 and values are 1, 3, 5, 3, 3, 2, 4, 5 then the sets of adjacent points are (1,3,5) (3,5,3) (5,3,3) (3,3,2) (3,2,4) (2,4,5) resulting in moving range values of (5-1) (5-3) (5-3) (3-2) (4-2) (5-2) = 4, 2, 2, 1, 2, 3.
Applying these rules indicates when a potential "out of control" situation has arisen. However there will always be some false alerts and the more rules applied the more will occur. For some processes, it may be beneficial to omit one or more rules. Equally there may be some missing alerts where some specific "out of control" situation is not detected. Empirically, the detection accuracy is good.
See also
- Common cause and special causeCommon cause and special causeCommon- and special-causes are the two distinct origins of variation in a process, as defined in the statistical thinking and methods of Walter A. Shewhart and W. Edwards Deming...
- Statistical process controlStatistical process controlStatistical process control is the application of statistical methods to the monitoring and control of a process to ensure that it operates at its full potential to produce conforming product. Under SPC, a process behaves predictably to produce as much conforming product as possible with the least...
- Western Electric rulesWestern Electric rulesIn Statistical Process Control, the Western Electric Rules are decision rules for detecting "out-of-control" or non-random conditions on control charts. Locations of the observations relative to the control chart control limits and centerline indicate whether the process in question should be...
- American Society for QualityAmerican Society for QualityAmerican Society for Quality , formerly known as American Society for Quality Control , is a knowledge-based global community of quality control experts, with nearly 85,000 members dedicated to the promotion and advancement of quality tools, principles, and practices in their workplaces and in...
, Quality Tools