
Western Electric rules
Encyclopedia
In Statistical Process Control
, the Western Electric Rules are decision rules
for detecting "out-of-control" or non-random conditions on control chart
s. Locations of the observations relative to the control chart control limits (typically at ±3 standard deviation
s) and centerline indicate whether the process in question should be investigated for assignable causes. The Western Electric Rules were codified by a specially-appointed committee of the manufacturing division of the Western Electric Company and appeared in the first edition of its Statistical Quality Control Handbook in 1956. Their purpose was to ensure that line workers and engineers interpret control charts in a uniform way.
To achieve this, the rules divide the chart into zones, measured in units of standard deviation
(σ) between the centerline and control limits, as follows:
Zones A, B, and C are sometimes called the three sigma zone, two sigma zone, and one sigma zone, respectively.
There are four basic rules that deal with appraising runs of observations within the various zones:
These rules are evaluated for one side of the center line (one half of the control band) at a time (e.g., first the centerline to the upper control limit, then the centerline to the lower control limit).
Data satisfying any of these conditions as indicated by the control chart provide the justification for investigating the process to discover whether assignable causes are present and can be removed. Note that there is always a possibility of false positives: Assuming observations are normally distributed, one expects Rule 1 to be triggered by chance one out of every 370 observations on average. The false alarm rate rises to one out of every 91.75 observations when evaluating all four rules.
s with symmetric control limits. The handbook provides additional guidelines for control charts where the control limits are not symmetrical, as for R charts and p-charts.
For and R charts (which plot the behavior of the subgroup range), the Handbook recommends using the zone rules above for subgroups of sufficient size (five or more). For small sample subgroups, the Handbook recommends:
For other control charts based on skewed distributions, the Handbook recommends:
Statistical process control
Statistical process control is the application of statistical methods to the monitoring and control of a process to ensure that it operates at its full potential to produce conforming product. Under SPC, a process behaves predictably to produce as much conforming product as possible with the least...
, the Western Electric Rules are decision rules
Decision rules
A set of decision rules is the verbal equivalent of a graphical decision tree, which specifies class membership based on a hierarchical sequence of decisions...
for detecting "out-of-control" or non-random conditions on control chart
Control chart
Control charts, also known as Shewhart charts or process-behaviour charts, in statistical process control are tools used to determine whether or not a manufacturing or business process is in a state of statistical control.- Overview :...
s. Locations of the observations relative to the control chart control limits (typically at ±3 standard deviation
Standard deviation
Standard deviation is a widely used measure of variability or diversity used in statistics and probability theory. It shows how much variation or "dispersion" there is from the average...
s) and centerline indicate whether the process in question should be investigated for assignable causes. The Western Electric Rules were codified by a specially-appointed committee of the manufacturing division of the Western Electric Company and appeared in the first edition of its Statistical Quality Control Handbook in 1956. Their purpose was to ensure that line workers and engineers interpret control charts in a uniform way.
Motivation
The rules attempt to distinguish unnatural patterns from natural patterns based on several criteria:- The absence of points near the centerline (identified as a mixture pattern)
- The absence of points near the control limits (identified as a stratification pattern)
- The presence of points outside the control limits (identified as an instability pattern)
- Other unnatural patterns (systematic (autocorrelative), repetition, trend patterns)
To achieve this, the rules divide the chart into zones, measured in units of standard deviation
Standard deviation
Standard deviation is a widely used measure of variability or diversity used in statistics and probability theory. It shows how much variation or "dispersion" there is from the average...
(σ) between the centerline and control limits, as follows:
| Zone | Region |
|---|---|
| Zone A | Within 2σ of the centerline and the control limit (3σ) |
| Zone B | Within 1σ and 2σ of the centerline |
| Zone C | Within 1σ of the centerline |
Zones A, B, and C are sometimes called the three sigma zone, two sigma zone, and one sigma zone, respectively.
Zone rules
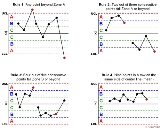
The most important of the Western Electric rules are the zone rules, designed to detect process instability—and the presence of assignable causes.There are four basic rules that deal with appraising runs of observations within the various zones:
| Rule | Description | Chart Example |
|---|---|---|
| |
Any single data point falls outside the 3σ limit from the centerline (i.e., any point that falls outside Zone A, beyond either the upper or lower control limit) | |
| |
Two out of three consecutive points fall beyond the 2σ limit (in zone A or beyond), on the same side of the centerline | |
| |
Four out of five consecutive points fall beyond the 1σ limit (in zone B or beyond), on the same side of the centerline | |
| |
Nine consecutive points fall on the same side of the centerline (in zone C or beyond) |
These rules are evaluated for one side of the center line (one half of the control band) at a time (e.g., first the centerline to the upper control limit, then the centerline to the lower control limit).
Data satisfying any of these conditions as indicated by the control chart provide the justification for investigating the process to discover whether assignable causes are present and can be removed. Note that there is always a possibility of false positives: Assuming observations are normally distributed, one expects Rule 1 to be triggered by chance one out of every 370 observations on average. The false alarm rate rises to one out of every 91.75 observations when evaluating all four rules.
Asymmetric control limits
The zone rules presented above apply to control chartControl chart
Control charts, also known as Shewhart charts or process-behaviour charts, in statistical process control are tools used to determine whether or not a manufacturing or business process is in a state of statistical control.- Overview :...
s with symmetric control limits. The handbook provides additional guidelines for control charts where the control limits are not symmetrical, as for R charts and p-charts.
For
and R charts (which plot the behavior of the subgroup range), the Handbook recommends using the zone rules above for subgroups of sufficient size (five or more). For small sample subgroups, the Handbook recommends:| Small-sample R chart rules |
|---|
| Any single data point falling above the +3σ limit |
| Two consecutive points falling above the +2σ limit (in the upper zone A or above) |
| Three consecutive points falling above the +1σ limit (in the upper zone B or above) |
| Seven consecutive points falling above the centerline (in the upper zone C or above) |
| Ten consecutive points falling below the centerline (in the lower zone C or below) |
| Six consecutive points falling below the -1σ limit (in the lower zone B or below) |
| Four consecutive points falling below the -2σ limit (in the lower zone A) |
For other control charts based on skewed distributions, the Handbook recommends:
- Finding the probabilities associated with each zone
- Devising tests that should result in the desired sensitivity to the presence of assignable causes
Other unnatural patterns
The Handbook also identifies patterns that require consideration of both the upper and lower halves of the control chart together for identification:| Pattern | Description | Rule |
|---|---|---|
| Stratification | Variation small relative to control limits | Fifteen consecutive points fall within ±1σ (zone C) |
| Mixture | The tendency to avoid the centerline | Eight consecutive points on both sides of the centerline with no points falling in zone C. |
| Systematic | Negative autocorrelation Autocorrelation Autocorrelation is the cross-correlation of a signal with itself. Informally, it is the similarity between observations as a function of the time separation between them... —a long series of observations that alternate high-low-high-low |
(No rule given) |
| Repetition | The tendency of one chart to follow the same pattern as its predecessor | (No rule given) |
| Trend | Sustained drift or shift in the long-term mean | A series of out-of-control points in the lower zones followed by a series of out-of-control points in the upper zones or vice versa A series of points without a change in direction |