
Likelihood function
Encyclopedia
In statistics
, a likelihood function (often simply the likelihood) is a function of the parameters
of a statistical model
, defined as follows: the likelihood of a set of parameter values given some observed outcomes is equal to the probability of those observed outcomes given those parameter values. Likelihood functions play a key role in statistical inference
, especially methods of estimating a parameter from a set of statistic
s.
In non-technical parlance, "likelihood" is usually a synonym for "probability
" but in statistical usage, a clear technical distinction is made. One may ask "If I were to flip a fair coin 100 times, what is the probability of it landing heads-up every time?" or "Given that I have flipped a coin 100 times and it has landed heads-up 100 times, what is the likelihood that the coin is fair?" but it would be improper to switch "likelihood" and "probability" in the two sentences.
Likelihood and probability can thus be seen to relate to the arrow of causality. With probability, a known initial causal state (the parameter) is causing an unknown result (that is, an instance from a set of possible worlds that is the effect (the outcome)). Probability is then a number (a "measure") that describes how often that result is expected to be seen. With likelihood, on the other hand, there is no mystery as to the outcome. But we don't know the initial causal state--which parameter value, which initial world caused the outcome. Likelihood is then a number, a measure, that describes "how likely it is that this result came from that initial causal state of affairs". Likelihoods deal with evidential reasoning
.
If a probability distribution depends on a parameter, one may on the one hand consider—for a given value of the parameter—the probability (density) of the different outcomes, and on the other hand consider—for a given outcome—the probability (density) this outcome has occurred for different values of the parameter. The first approach interprets the probability distribution as a function of the outcome, given a fixed parameter value, while the second interprets it as a function of the parameter, given a fixed outcome. In the latter case the function is called the "likelihood function" of the parameter, and indicates how likely a parameter value is in light of the observed outcome.
Because probability starts from a single, known initial world, it has no need for priors--the start is known to 100%. Fan-out is only considered from one source. Probability is thus well-behaved and well-founded. All possible (mutually excusive) outcomes' probabilities sum to one--a fundamental result that is used for all kinds of computations.
Likelihood, on the other hand, is a heuristic that compares apples against oranges. It compares joint probabilities taken from different possible-world fan-outs, while ignoring the prior probability that that starting possible world exists in the first place. This only yields rigorously valid results when all the starting possible worlds have equally likely priors (e.g., from the maximum entropy assumption). So since this heuristic is not well-founded, the resulting likelihood sets for a particular outcome are not well-behaved either. All possible sources' likelihoods for a given outcome could sum to any number between 0 and N, where N is the number of discrete sources.
Likelihood is thus a handy measure for guessing which, of a set of uncertainly-known possible causes, was the actual cause that produced a certainly-known effect. It is most useful in the statistics of natural processes, when purposeful agents are not involved.

considered as a function of θ, is called the likelihood function (of θ, given the outcome x of X). Sometimes the probability on the value x of X for the parameter value θ is written as , but should not be considered as a conditional probability, because θ is a parameter and not a random variable.
f depending on a parameter θ. Then the function

considered as a function of θ, is called the likelihood function (of θ, given the outcome x of X). Sometimes the density function for the value x of X for the parameter value θ is written as , but should not be considered as a conditional probability density.
The actual value of a likelihood function bears no meaning. Its use lies in comparing one value with another. E.g., one value of the parameter may be more likely than another, given the outcome of the sample. Or a specific value will be most likely: the maximum likelihood estimate. Comparison may also be performed in considering the quotient of two likelihood values. That's why generally, is permitted to be any positive multiple of the above defined function
  . More precisely, then, a likelihood function is any representative from an equivalence class of functions,
where the constant of proportionality α > 0 is not permitted to depend upon θ, and is required to be the same for all likelihood functions used in any one comparison. In particular, the numerical value (θ | x) alone is immaterial; all that matters are maximum values of
  , or likelihood ratio
s, such as those of the form

that are invariant with respect to the constant of proportionality α.
A. W. F. Edwards
defined support to be the natural logarithm
of the likelihood ratio, and the support function as the natural logarithm of the likelihood function (the same as the log-likelihood; see below). However, there is potential for confusion with the mathematical meaning of 'support'
, and this terminology is not widely used outside Edwards' main applied field of phylogenetics
.
For more about making inferences via likelihood functions, see also the method of maximum likelihood
, and likelihood-ratio test
ing.
of the likelihood function, called the log-likelihood, than in terms of the likelihood function itself. Because the logarithm is a monotonically increasing function, the logarithm of a function achieves its maximum value at the same points as the function itself, and hence the log-likelihood can be used in place of the likelihood in maximum likelihood
estimation and related techniques. Finding the maximum of a function often involves taking the derivative
of a function and solving for the parameter being maximized, and this is often easier when the function being maximized is a log-likelihood rather than the original likelihood function.
For example, some likelihood functions are for the parameters that explain a collection of statistically independent observations. In such a situation, the likelihood function factors into a product of individual likelihood functions. The logarithm of this product is a sum of individual logarithms, and the derivative
of a sum of terms is often easier to compute than the derivative of a product. In addition, several common distributions have likelihood functions that contain products of factors involving exponentiation
. The logarithm of such a function is a sum of products, again easier to differentiate than the original function.
As an example, consider the gamma distribution, whose likelihood function is
and suppose we wish to find the maximum likelihood estimate of β for a single observed value x. This function looks rather daunting. Its logarithm, however, is much simpler to work with:

The partial derivative
with respect to β is simply
If there are a number of independent random samples x1,…,xn, then the joint log-likelihood will be the sum of individual log-likelihoods, and the derivative of this sum will be the sum of individual derivatives:

Setting that equal to zero and solving for β yields

where denotes the maximum-likelihood estimate and
  is the sample mean of the observations.
s (or probability mass function
s in the case of discrete distributions)

where θ is the parameter, the likelihood function is
written
where x is the observed outcome of an experiment. In other words, when f(x | θ) is viewed as a function of x with θ fixed, it is a probability density function, and when viewed as a function of θ with x fixed, it is a likelihood function.
Note: This is not the same as the probability that those parameters are the right ones, given the observed sample. Attempting to interpret the likelihood of a hypothesis given observed evidence as the probability of the hypothesis is a common error, with potentially disastrous real-world consequences in medicine, engineering or jurisprudence. See prosecutor's fallacy
for an example of this.
From a geometric standpoint, if we consider f (x, θ) as a function of two variables then the family of probability distributions can be viewed as level curves parallel to the x-axis, while the family of likelihood functions are the orthogonal level curves parallel to the θ-axis.
instead of a probability in specifying the likelihood function above may be justified in a simple way. Suppose that, instead of an exact observation, x, the observation is the value in a short interval (xj−1, xj), with length Δj, where the subscripts refer to a predefined set of intervals. Then the probability of getting this observation (of being in interval j) is approximately

where x* can be any point in interval j. Then, recalling that the likelihood function is defined up to a multiplicative constant, it is just as valid to say that the likelihood function is approximately

and then, on considering the lengths of the intervals to decrease to zero,


where can be any point in interval j. Then, on considering the lengths of the intervals to decrease to zero, the likelihood function for a observation from the discrete component is

where k is the index of the discrete probability mass corresponding to observation x.
The fact that the likelihood function can be defined in a way that includes contributions that are not commensurate (the density and the probability mass) arises from the way in which the likelihood function is defined up to a constant of proportionality, where this "constant" can change with the observation x, but not with the parameter θ.

 Let
Let  be the probability that a certain coin lands heads up (H) when tossed. So, the probability of getting two heads in two tosses (HH) is
  . If
. If  , then the probability of seeing two heads is 0.25.
In symbols, we can say the above as:

Another way of saying this is to reverse it and say that "the likelihood that , given the observation HH, is 0.25"; that is:

But this is not the same as saying that the probability that , given the observation HH, is 0.25.
Notice that the likelihood that , given the observation HH, is 1. But it is clearly not true that the probability that
  , given the observation HH, is 1. Two heads in a row hardly proves that the coin always comes up heads. In fact, two heads in a row is possible for any
  .
.
The likelihood function is not a probability density function
. Notice that the integral of a likelihood function is not in general 1. In this example, the integral of the likelihood over the interval [0, 1] in is 1/3, demonstrating that the likelihood function cannot be interpreted as a probability density function for
  .
.

where the Iverson bracket [n ≤ N] is 1 when n ≤ N and 0 otherwise.
When considered a function of n for fixed N this is the probability distribution, but when considered a function of N for fixed n this is a likelihood function. The maximum likelihood
estimate for N is N0 = n (by contrast, the unbiased estimate is 2n − 1).
This likelihood function is not a probability distribution, because the total
is a divergent series
.
Suppose, however, that you pick two tickets rather than one.
The probability of the outcome {n1, n2}, where n1 < n2, is
When considered a function of N for fixed n2, this is a likelihood function. The maximum likelihood
estimate for N is N0 = n2.
This time the total

is a convergent series, and so this likelihood function can be normalized into a probability distribution.
If you pick 3 or more tickets, the likelihood function has a well defined mean value, which is larger than the maximum likelihood estimate. If you pick 4 or more tickets, the likelihood function has a well defined standard deviation
too.
estimate for θ is . Relative plausibilities of other θ values may be found by comparing the likelihood of those other values with the likelihood of
  . The relative likelihood of θ is defined as
  .
.
A 10% likelihood region for θ is
and more generally, a p% likelihood region for θ is defined to be
If θ is a single real parameter, a p% likelihood region will typically comprise an interval of real values. In that case, the region is called a likelihood interval.
Likelihood intervals can be compared to confidence interval
s. If θ is a single real parameter, then under certain conditions, a 14.7% likelihood interval for θ will be the same as a 95% confidence interval. In a slightly different formulation suited to the use of log-likelihoods, the e−2 likelihood interval is the same as the 0.954 confidence interval (under certain conditions).
The idea of basing an interval estimate on the relative likelihood goes back to Fisher in 1956 and has been by many authors since then. If a likelihood interval is specifically to be interpreted as a confidence interval
, then this idea is immediately related to the likelihood ratio test which can be used to define appropriate intervals for parameters. This approach can be used to define the critical points for the likelihood ratio statistic to achieve the required coverage level for a confidence interval. However a likelihood interval can be used as such, having been determined in a well-defined way, without claiming any particular coverage probability
.
, or more usually, AICc (Akaike Information Criterion with correction). Suppose that, for some dataset, we have two statistical models, M1 and M2, with fixed parameters. Also suppose that AICc(M1) ≤ AICc(M2). Then the relative likelihood of M2 with respect to M1 is defined to be
To see that this is a generalization of the earlier definition, suppose that we have some model M with a (possibly multivariate) parameter θ. Then for any θ, set M2 = M(θ), and also set M1 = M( ). The general definition now gives the same result as the earlier definition.
These approaches are useful because standard likelihood methods can become unreliable or fail entirely when there are many nuisance parameters or when the nuisance parameters are high-dimensional. This is particularly true when the nuisance parameters can be considered to be "missing data"; they represent a non-negligible fraction of the number of observations and this fraction does not decrease when the sample size increases. Often these approaches can be used to derive closed-form formulae for statistical tests when direct use of maximum likelihood requires iterative numerical methods. These approaches find application in some specialized topics such as sequential analysis
.
One example occurs in 2×2 tables, where conditioning on all four marginal totals leads to a conditional likelihood based on the non-central hypergeometric distribution. This form of conditioning is also the basis for Fisher's exact test
.
s, where considering a likelihood for the residuals only after fitting the fixed effects leads to residual maximum likelihood estimation of the variance components.
(The function is the parameter value which maximizes the likelihood given the value of the other parameters.)
This procedure is called concentration of the parameters and results in the concentrated likelihood function, also occasionally known as the maximized likelihood function, but most often called the profile likelihood function.
For example, consider a regression analysis
model with normally distributed errors
. The most likely value of the error variance
is the variance of the residuals
. The residuals depend on all other parameters. Hence the variance parameter can be written as a function of the other parameters.
Unlike conditional and marginal likelihoods, profile likelihood methods can always be used, even when the profile likelihood cannot be written down explicitly. However, the profile likelihood is not a true likelihood, as it is not based directly on a probability distribution, and this leads to some less satisfactory properties. Attempts have been made to improve this, resulting in modified profile likelihood.
The idea of profile likelihood can also be used to compute confidence interval
s that often have better small-sample properties than those based on asymptotic standard errors
calculated from the full likelihood. In the case of parameter estimation in partially observed systems, the profile likelihood can be also used for identifiability
analysis. An implementation is available in the MATLAB Toolbox PottersWheel
.
in Aeropagitica: "when greatest likelihoods are brought that such things are truly and really in those persons to whom they are ascribed".
In Danish, "likelihood" was used by Thorvald N. Thiele
in 1889.
In English, "likelihood" appears in many writings by Charles Sanders Peirce, where model
-based inference (usually abduction
but sometimes including induction
) is distinguished from statistical procedures based on objective
randomization
. Peirce's preference for randomization-based inference is discussed in "Illustrations of the Logic of Science" (1877–1878) and "A Theory of Probable Inference" (1883)".
Like Thiele, Peirce considers the likelihood for a binomial distribution. Peirce uses the logarithm of the odds-ratio throughout his career. Peirce's propensity for using the log odds is discussed by Stephen Stigler
.
In Great Britain, "likelihood" was popularized in mathematical statistics by R.A. Fisher in 1922: "On the mathematical foundations of theoretical statistics". In that paper, Fisher also uses the term "method of maximum likelihood". Fisher argues against inverse probability
as a basis for statistical inferences, and instead proposes inferences based on likelihood functions. Fisher's use of "likelihood" fixed the terminology that is used by statisticians throughout the world.
Statistics
Statistics is the study of the collection, organization, analysis, and interpretation of data. It deals with all aspects of this, including the planning of data collection in terms of the design of surveys and experiments....
, a likelihood function (often simply the likelihood) is a function of the parameters
Statistical parameter
A statistical parameter is a parameter that indexes a family of probability distributions. It can be regarded as a numerical characteristic of a population or a model....
of a statistical model
Statistical model
A statistical model is a formalization of relationships between variables in the form of mathematical equations. A statistical model describes how one or more random variables are related to one or more random variables. The model is statistical as the variables are not deterministically but...
, defined as follows: the likelihood of a set of parameter values given some observed outcomes is equal to the probability of those observed outcomes given those parameter values. Likelihood functions play a key role in statistical inference
Statistical inference
In statistics, statistical inference is the process of drawing conclusions from data that are subject to random variation, for example, observational errors or sampling variation...
, especially methods of estimating a parameter from a set of statistic
Statistic
A statistic is a single measure of some attribute of a sample . It is calculated by applying a function to the values of the items comprising the sample which are known together as a set of data.More formally, statistical theory defines a statistic as a function of a sample where the function...
s.
In non-technical parlance, "likelihood" is usually a synonym for "probability
Probability
Probability is ordinarily used to describe an attitude of mind towards some proposition of whose truth we arenot certain. The proposition of interest is usually of the form "Will a specific event occur?" The attitude of mind is of the form "How certain are we that the event will occur?" The...
" but in statistical usage, a clear technical distinction is made. One may ask "If I were to flip a fair coin 100 times, what is the probability of it landing heads-up every time?" or "Given that I have flipped a coin 100 times and it has landed heads-up 100 times, what is the likelihood that the coin is fair?" but it would be improper to switch "likelihood" and "probability" in the two sentences.
Likelihood and probability can thus be seen to relate to the arrow of causality. With probability, a known initial causal state (the parameter) is causing an unknown result (that is, an instance from a set of possible worlds that is the effect (the outcome)). Probability is then a number (a "measure") that describes how often that result is expected to be seen. With likelihood, on the other hand, there is no mystery as to the outcome. But we don't know the initial causal state--which parameter value, which initial world caused the outcome. Likelihood is then a number, a measure, that describes "how likely it is that this result came from that initial causal state of affairs". Likelihoods deal with evidential reasoning
Evidential reasoning
Evidential reason or evidential reasoning may refer to:* Probabilistic logic, a combination of the capacity of probability theory to handle uncertainty with the capacity of deductive logic to exploit structure...
.
If a probability distribution depends on a parameter, one may on the one hand consider—for a given value of the parameter—the probability (density) of the different outcomes, and on the other hand consider—for a given outcome—the probability (density) this outcome has occurred for different values of the parameter. The first approach interprets the probability distribution as a function of the outcome, given a fixed parameter value, while the second interprets it as a function of the parameter, given a fixed outcome. In the latter case the function is called the "likelihood function" of the parameter, and indicates how likely a parameter value is in light of the observed outcome.
Because probability starts from a single, known initial world, it has no need for priors--the start is known to 100%. Fan-out is only considered from one source. Probability is thus well-behaved and well-founded. All possible (mutually excusive) outcomes' probabilities sum to one--a fundamental result that is used for all kinds of computations.
Likelihood, on the other hand, is a heuristic that compares apples against oranges. It compares joint probabilities taken from different possible-world fan-outs, while ignoring the prior probability that that starting possible world exists in the first place. This only yields rigorously valid results when all the starting possible worlds have equally likely priors (e.g., from the maximum entropy assumption). So since this heuristic is not well-founded, the resulting likelihood sets for a particular outcome are not well-behaved either. All possible sources' likelihoods for a given outcome could sum to any number between 0 and N, where N is the number of discrete sources.
Likelihood is thus a handy measure for guessing which, of a set of uncertainly-known possible causes, was the actual cause that produced a certainly-known effect. It is most useful in the statistics of natural processes, when purposeful agents are not involved.
Definition
For the definition of the likelihood function, one has to distinguish between discrete and continuous probability distributions.Discrete probability distribution
Let X be a random variable with a discrete probability distribution p depending on a parameter θ. Then the functionconsidered as a function of θ, is called the likelihood function (of θ, given the outcome x of X). Sometimes the probability on the value x of X for the parameter value θ is written as
, but should not be considered as a conditional probability, because θ is a parameter and not a random variable.Continuous probability distribution
Let X be a random variable with a continuous probability distribution with density functionProbability density function
In probability theory, a probability density function , or density of a continuous random variable is a function that describes the relative likelihood for this random variable to occur at a given point. The probability for the random variable to fall within a particular region is given by the...
f depending on a parameter θ. Then the function
considered as a function of θ, is called the likelihood function (of θ, given the outcome x of X). Sometimes the density function for the value x of X for the parameter value θ is written as
, but should not be considered as a conditional probability density.The actual value of a likelihood function bears no meaning. Its use lies in comparing one value with another. E.g., one value of the parameter may be more likely than another, given the outcome of the sample. Or a specific value will be most likely: the maximum likelihood estimate. Comparison may also be performed in considering the quotient of two likelihood values. That's why generally,
is permitted to be any positive multiple of the above defined function . More precisely, then, a likelihood function is any representative from an equivalence class of functions,where the constant of proportionality α > 0 is not permitted to depend upon θ, and is required to be the same for all likelihood functions used in any one comparison. In particular, the numerical value
(θ | x) alone is immaterial; all that matters are maximum values of , or likelihood ratioRatio
In mathematics, a ratio is a relationship between two numbers of the same kind , usually expressed as "a to b" or a:b, sometimes expressed arithmetically as a dimensionless quotient of the two which explicitly indicates how many times the first number contains the second In mathematics, a ratio is...
s, such as those of the form
that are invariant with respect to the constant of proportionality α.
A. W. F. Edwards
A. W. F. Edwards
Anthony William Fairbank Edwards is a British statistician, geneticist, and evolutionary biologist, sometimes called Fisher's Edwards. He is a Life Fellow of Gonville and Caius College and retired Professor of Biometry at the University of Cambridge, and holds both the ScD and LittD degrees. A...
defined support to be the natural logarithm
Natural logarithm
The natural logarithm is the logarithm to the base e, where e is an irrational and transcendental constant approximately equal to 2.718281828...
of the likelihood ratio, and the support function as the natural logarithm of the likelihood function (the same as the log-likelihood; see below). However, there is potential for confusion with the mathematical meaning of 'support'
Support (mathematics)
In mathematics, the support of a function is the set of points where the function is not zero, or the closure of that set . This concept is used very widely in mathematical analysis...
, and this terminology is not widely used outside Edwards' main applied field of phylogenetics
Phylogenetics
In biology, phylogenetics is the study of evolutionary relatedness among groups of organisms , which is discovered through molecular sequencing data and morphological data matrices...
.
For more about making inferences via likelihood functions, see also the method of maximum likelihood
Maximum likelihood
In statistics, maximum-likelihood estimation is a method of estimating the parameters of a statistical model. When applied to a data set and given a statistical model, maximum-likelihood estimation provides estimates for the model's parameters....
, and likelihood-ratio test
Likelihood-ratio test
In statistics, a likelihood ratio test is a statistical test used to compare the fit of two models, one of which is a special case of the other . The test is based on the likelihood ratio, which expresses how many times more likely the data are under one model than the other...
ing.
Log-likelihood
For many applications involving likelihood functions, it is more convenient to work in terms of the natural logarithmNatural logarithm
The natural logarithm is the logarithm to the base e, where e is an irrational and transcendental constant approximately equal to 2.718281828...
of the likelihood function, called the log-likelihood, than in terms of the likelihood function itself. Because the logarithm is a monotonically increasing function, the logarithm of a function achieves its maximum value at the same points as the function itself, and hence the log-likelihood can be used in place of the likelihood in maximum likelihood
Maximum likelihood
In statistics, maximum-likelihood estimation is a method of estimating the parameters of a statistical model. When applied to a data set and given a statistical model, maximum-likelihood estimation provides estimates for the model's parameters....
estimation and related techniques. Finding the maximum of a function often involves taking the derivative
Derivative
In calculus, a branch of mathematics, the derivative is a measure of how a function changes as its input changes. Loosely speaking, a derivative can be thought of as how much one quantity is changing in response to changes in some other quantity; for example, the derivative of the position of a...
of a function and solving for the parameter being maximized, and this is often easier when the function being maximized is a log-likelihood rather than the original likelihood function.
For example, some likelihood functions are for the parameters that explain a collection of statistically independent observations. In such a situation, the likelihood function factors into a product of individual likelihood functions. The logarithm of this product is a sum of individual logarithms, and the derivative
Derivative
In calculus, a branch of mathematics, the derivative is a measure of how a function changes as its input changes. Loosely speaking, a derivative can be thought of as how much one quantity is changing in response to changes in some other quantity; for example, the derivative of the position of a...
of a sum of terms is often easier to compute than the derivative of a product. In addition, several common distributions have likelihood functions that contain products of factors involving exponentiation
Exponentiation
Exponentiation is a mathematical operation, written as an, involving two numbers, the base a and the exponent n...
. The logarithm of such a function is a sum of products, again easier to differentiate than the original function.
As an example, consider the gamma distribution, whose likelihood function is
and suppose we wish to find the maximum likelihood estimate of β for a single observed value x. This function looks rather daunting. Its logarithm, however, is much simpler to work with:
The partial derivative
Partial derivative
In mathematics, a partial derivative of a function of several variables is its derivative with respect to one of those variables, with the others held constant...
with respect to β is simply
If there are a number of independent random samples x1,…,xn, then the joint log-likelihood will be the sum of individual log-likelihoods, and the derivative of this sum will be the sum of individual derivatives:
Setting that equal to zero and solving for β yields
where
denotes the maximum-likelihood estimate and is the sample mean of the observations.Likelihood function of a parameterized model
Among many applications, we consider here one of broad theoretical and practical importance. Given a parameterized family of probability density functionProbability density function
In probability theory, a probability density function , or density of a continuous random variable is a function that describes the relative likelihood for this random variable to occur at a given point. The probability for the random variable to fall within a particular region is given by the...
s (or probability mass function
Probability mass function
In probability theory and statistics, a probability mass function is a function that gives the probability that a discrete random variable is exactly equal to some value...
s in the case of discrete distributions)
where θ is the parameter, the likelihood function is
written
where x is the observed outcome of an experiment. In other words, when f(x | θ) is viewed as a function of x with θ fixed, it is a probability density function, and when viewed as a function of θ with x fixed, it is a likelihood function.
Note: This is not the same as the probability that those parameters are the right ones, given the observed sample. Attempting to interpret the likelihood of a hypothesis given observed evidence as the probability of the hypothesis is a common error, with potentially disastrous real-world consequences in medicine, engineering or jurisprudence. See prosecutor's fallacy
Prosecutor's fallacy
The prosecutor's fallacy is a fallacy of statistical reasoning made in law where the context in which the accused has been brought to court is falsely assumed to be irrelevant to judging how confident a jury can be in evidence against them with a statistical measure of doubt...
for an example of this.
From a geometric standpoint, if we consider f (x, θ) as a function of two variables then the family of probability distributions can be viewed as level curves parallel to the x-axis, while the family of likelihood functions are the orthogonal level curves parallel to the θ-axis.
Likelihoods for continuous distributions
The use of the probability densityProbability density
Probability density may refer to:* Probability density function in probability theory* The product of the probability amplitude with its complex conjugate in quantum mechanics...
instead of a probability in specifying the likelihood function above may be justified in a simple way. Suppose that, instead of an exact observation, x, the observation is the value in a short interval (xj−1, xj), with length Δj, where the subscripts refer to a predefined set of intervals. Then the probability of getting this observation (of being in interval j) is approximately
where x* can be any point in interval j. Then, recalling that the likelihood function is defined up to a multiplicative constant, it is just as valid to say that the likelihood function is approximately
and then, on considering the lengths of the intervals to decrease to zero,
Likelihoods for mixed continuous–discrete distributions
The above can be extended in a simple way to allow consideration of distributions which contain both discrete and continuous components. Suppose that the distribution consists of a number of discrete probability masses pk(θ) and a density f(x | θ), where the sum of all the ps added to the integral of f is always one. Assuming that it is possible to distinguish an observation corresponding to one of the discrete probability masses from one which corresponds to the density component, the likelihood function for an observation from the continuous component can be dealt with as above by setting the interval length short enough to exclude any of the discrete masses. For an observation from the discrete component, the probability can either be written down directly or treated within the above context by saying that the probability of getting an observation in an interval that does contain a discrete component (of being in interval j which contains discrete component k) is approximatelywhere
can be any point in interval j. Then, on considering the lengths of the intervals to decrease to zero, the likelihood function for a observation from the discrete component iswhere k is the index of the discrete probability mass corresponding to observation x.
The fact that the likelihood function can be defined in a way that includes contributions that are not commensurate (the density and the probability mass) arises from the way in which the likelihood function is defined up to a constant of proportionality, where this "constant" can change with the observation x, but not with the parameter θ.
Example 1
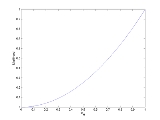
be the probability that a certain coin lands heads up (H) when tossed. So, the probability of getting two heads in two tosses (HH) is . If , then the probability of seeing two heads is 0.25.In symbols, we can say the above as:
Another way of saying this is to reverse it and say that "the likelihood that
, given the observation HH, is 0.25"; that is:But this is not the same as saying that the probability that
, given the observation HH, is 0.25.Notice that the likelihood that
, given the observation HH, is 1. But it is clearly not true that the probability that , given the observation HH, is 1. Two heads in a row hardly proves that the coin always comes up heads. In fact, two heads in a row is possible for any .The likelihood function is not a probability density function
Probability density function
In probability theory, a probability density function , or density of a continuous random variable is a function that describes the relative likelihood for this random variable to occur at a given point. The probability for the random variable to fall within a particular region is given by the...
. Notice that the integral of a likelihood function is not in general 1. In this example, the integral of the likelihood over the interval [0, 1] in
is 1/3, demonstrating that the likelihood function cannot be interpreted as a probability density function for .Example 2
Consider a jar containing N lottery tickets numbered from 1 through N. If you pick a ticket randomly then you get positive integer n, with probability 1/N if n ≤ N and with probability zero if n > N. This can be writtenwhere the Iverson bracket [n ≤ N] is 1 when n ≤ N and 0 otherwise.
When considered a function of n for fixed N this is the probability distribution, but when considered a function of N for fixed n this is a likelihood function. The maximum likelihood
Maximum likelihood
In statistics, maximum-likelihood estimation is a method of estimating the parameters of a statistical model. When applied to a data set and given a statistical model, maximum-likelihood estimation provides estimates for the model's parameters....
estimate for N is N0 = n (by contrast, the unbiased estimate is 2n − 1).
This likelihood function is not a probability distribution, because the total
is a divergent series
Divergent series
In mathematics, a divergent series is an infinite series that is not convergent, meaning that the infinite sequence of the partial sums of the series does not have a limit....
.
Suppose, however, that you pick two tickets rather than one.
The probability of the outcome {n1, n2}, where n1 < n2, is
When considered a function of N for fixed n2, this is a likelihood function. The maximum likelihood
Maximum likelihood
In statistics, maximum-likelihood estimation is a method of estimating the parameters of a statistical model. When applied to a data set and given a statistical model, maximum-likelihood estimation provides estimates for the model's parameters....
estimate for N is N0 = n2.
This time the total
is a convergent series, and so this likelihood function can be normalized into a probability distribution.
If you pick 3 or more tickets, the likelihood function has a well defined mean value, which is larger than the maximum likelihood estimate. If you pick 4 or more tickets, the likelihood function has a well defined standard deviation
Standard deviation
Standard deviation is a widely used measure of variability or diversity used in statistics and probability theory. It shows how much variation or "dispersion" there is from the average...
too.
Relative likelihood function
Suppose that the maximum likelihoodMaximum likelihood
In statistics, maximum-likelihood estimation is a method of estimating the parameters of a statistical model. When applied to a data set and given a statistical model, maximum-likelihood estimation provides estimates for the model's parameters....
estimate for θ is
. Relative plausibilities of other θ values may be found by comparing the likelihood of those other values with the likelihood of . The relative likelihood of θ is defined as .A 10% likelihood region for θ is
and more generally, a p% likelihood region for θ is defined to be
If θ is a single real parameter, a p% likelihood region will typically comprise an interval of real values. In that case, the region is called a likelihood interval.
Likelihood intervals can be compared to confidence interval
Confidence interval
In statistics, a confidence interval is a particular kind of interval estimate of a population parameter and is used to indicate the reliability of an estimate. It is an observed interval , in principle different from sample to sample, that frequently includes the parameter of interest, if the...
s. If θ is a single real parameter, then under certain conditions, a 14.7% likelihood interval for θ will be the same as a 95% confidence interval. In a slightly different formulation suited to the use of log-likelihoods, the e−2 likelihood interval is the same as the 0.954 confidence interval (under certain conditions).
The idea of basing an interval estimate on the relative likelihood goes back to Fisher in 1956 and has been by many authors since then. If a likelihood interval is specifically to be interpreted as a confidence interval
Confidence interval
In statistics, a confidence interval is a particular kind of interval estimate of a population parameter and is used to indicate the reliability of an estimate. It is an observed interval , in principle different from sample to sample, that frequently includes the parameter of interest, if the...
, then this idea is immediately related to the likelihood ratio test which can be used to define appropriate intervals for parameters. This approach can be used to define the critical points for the likelihood ratio statistic to achieve the required coverage level for a confidence interval. However a likelihood interval can be used as such, having been determined in a well-defined way, without claiming any particular coverage probability
Coverage probability
In statistics, the coverage probability of a confidence interval is the proportion of the time that the interval contains the true value of interest. For example, suppose our interest is in the mean number of months that people with a particular type of cancer remain in remission following...
.
Relative likelihood of models
The definition of relative likelihood can also be generalized to compare different (fitted) statistical models. This generalization is based on Akaike information criterionAkaike information criterion
The Akaike information criterion is a measure of the relative goodness of fit of a statistical model. It was developed by Hirotsugu Akaike, under the name of "an information criterion" , and was first published by Akaike in 1974...
, or more usually, AICc (Akaike Information Criterion with correction). Suppose that, for some dataset, we have two statistical models, M1 and M2, with fixed parameters. Also suppose that AICc(M1) ≤ AICc(M2). Then the relative likelihood of M2 with respect to M1 is defined to be
- exp((AICc(M1)−AICc(M2))/2)
To see that this is a generalization of the earlier definition, suppose that we have some model M with a (possibly multivariate) parameter θ. Then for any θ, set M2 = M(θ), and also set M1 = M(
). The general definition now gives the same result as the earlier definition.Likelihoods that eliminate nuisance parameters
In many cases, the likelihood is a function of more than one parameter but interest focuses on the estimation of only one, or at most a few of them, with the others being considered as nuisance parameters. Several alternative approaches have been developed to eliminate such nuisance parameters so that a likelihood can be written as a function of only the parameter (or parameters) of interest; the main approaches being marginal, conditional and profile likelihoods.These approaches are useful because standard likelihood methods can become unreliable or fail entirely when there are many nuisance parameters or when the nuisance parameters are high-dimensional. This is particularly true when the nuisance parameters can be considered to be "missing data"; they represent a non-negligible fraction of the number of observations and this fraction does not decrease when the sample size increases. Often these approaches can be used to derive closed-form formulae for statistical tests when direct use of maximum likelihood requires iterative numerical methods. These approaches find application in some specialized topics such as sequential analysis
Sequential analysis
In statistics, sequential analysis or sequential hypothesis testing is statistical analysis where the sample size is not fixed in advance. Instead data are evaluated as they are collected, and further sampling is stopped in accordance with a pre-defined stopping rule as soon as significant results...
.
Conditional likelihood
Sometimes it is possible to find a sufficient statistic for the nuisance parameters, and conditioning on this statistic results in a likelihood which does not depend on the nuisance parameters.One example occurs in 2×2 tables, where conditioning on all four marginal totals leads to a conditional likelihood based on the non-central hypergeometric distribution. This form of conditioning is also the basis for Fisher's exact test
Fisher's exact test
Fisher's exact test is a statistical significance test used in the analysis of contingency tables where sample sizes are small. It is named after its inventor, R. A...
.
Marginal likelihood
Sometimes we can remove the nuisance parameters by considering a likelihood based on only part of the information in the data, for example by using the set of ranks rather than the numerical values. Another example occurs in linear mixed modelMixed model
A mixed model is a statistical model containing both fixed effects and random effects, that is mixed effects. These models are useful in a wide variety of disciplines in the physical, biological and social sciences....
s, where considering a likelihood for the residuals only after fitting the fixed effects leads to residual maximum likelihood estimation of the variance components.
Profile likelihood
It is often possible to write some parameters as functions of other parameters, thereby reducing the number of independent parameters.(The function is the parameter value which maximizes the likelihood given the value of the other parameters.)
This procedure is called concentration of the parameters and results in the concentrated likelihood function, also occasionally known as the maximized likelihood function, but most often called the profile likelihood function.
For example, consider a regression analysis
Regression analysis
In statistics, regression analysis includes many techniques for modeling and analyzing several variables, when the focus is on the relationship between a dependent variable and one or more independent variables...
model with normally distributed errors
Errors and residuals in statistics
In statistics and optimization, statistical errors and residuals are two closely related and easily confused measures of the deviation of a sample from its "theoretical value"...
. The most likely value of the error variance
Variance
In probability theory and statistics, the variance is a measure of how far a set of numbers is spread out. It is one of several descriptors of a probability distribution, describing how far the numbers lie from the mean . In particular, the variance is one of the moments of a distribution...
is the variance of the residuals
Errors and residuals in statistics
In statistics and optimization, statistical errors and residuals are two closely related and easily confused measures of the deviation of a sample from its "theoretical value"...
. The residuals depend on all other parameters. Hence the variance parameter can be written as a function of the other parameters.
Unlike conditional and marginal likelihoods, profile likelihood methods can always be used, even when the profile likelihood cannot be written down explicitly. However, the profile likelihood is not a true likelihood, as it is not based directly on a probability distribution, and this leads to some less satisfactory properties. Attempts have been made to improve this, resulting in modified profile likelihood.
The idea of profile likelihood can also be used to compute confidence interval
Confidence interval
In statistics, a confidence interval is a particular kind of interval estimate of a population parameter and is used to indicate the reliability of an estimate. It is an observed interval , in principle different from sample to sample, that frequently includes the parameter of interest, if the...
s that often have better small-sample properties than those based on asymptotic standard errors
Standard error (statistics)
The standard error is the standard deviation of the sampling distribution of a statistic. The term may also be used to refer to an estimate of that standard deviation, derived from a particular sample used to compute the estimate....
calculated from the full likelihood. In the case of parameter estimation in partially observed systems, the profile likelihood can be also used for identifiability
Identifiability
In statistics, identifiability is a property which a model must satisfy in order for inference to be possible. We say that the model is identifiable if it is theoretically possible to learn the true value of this model’s underlying parameter after obtaining an infinite number of observations from it...
analysis. An implementation is available in the MATLAB Toolbox PottersWheel
PottersWheel
PottersWheel is a MATLAB toolbox for mathematical modeling of time-dependent dynamical systems that can be expressed as chemical reaction networks or ordinary differential equations . It allows the automatic calibration of model parameters by fitting the model to experimental measurements...
.
Partial likelihood
A partial likelihood is a factor component of the likelihood function that isolates the parameters of interest. It is a key component of the proportional hazards model.Historical remarks
In English, "likelihood" has been distinguished as being related to but weaker than "probability" since its earliest uses. The comparison of hypotheses by evaluating likelihoods has been used for centuries, for example by John MiltonJohn Milton
John Milton was an English poet, polemicist, a scholarly man of letters, and a civil servant for the Commonwealth of England under Oliver Cromwell...
in Aeropagitica: "when greatest likelihoods are brought that such things are truly and really in those persons to whom they are ascribed".
In Danish, "likelihood" was used by Thorvald N. Thiele
Thorvald N. Thiele
Thorvald Nicolai Thiele was a Danish astronomer, actuary and mathematician, most notable for his work in statistics, interpolation and the three-body problem. He was the first to propose a mathematical theory of Brownian motion...
in 1889.
In English, "likelihood" appears in many writings by Charles Sanders Peirce, where model
Statistical model
A statistical model is a formalization of relationships between variables in the form of mathematical equations. A statistical model describes how one or more random variables are related to one or more random variables. The model is statistical as the variables are not deterministically but...
-based inference (usually abduction
Abductive reasoning
Abduction is a kind of logical inference described by Charles Sanders Peirce as "guessing". The term refers to the process of arriving at an explanatory hypothesis. Peirce said that to abduce a hypothetical explanation a from an observed surprising circumstance b is to surmise that a may be true...
but sometimes including induction
Inductive reasoning
Inductive reasoning, also known as induction or inductive logic, is a kind of reasoning that constructs or evaluates propositions that are abstractions of observations. It is commonly construed as a form of reasoning that makes generalizations based on individual instances...
) is distinguished from statistical procedures based on objective
Objective
Objective may refer to:* Objective , to achieve a final set of actions within a given military operation* Objective pronoun, a pronoun as the target of a verb* Objective , an element in a camera or microscope...
randomization
Randomization
Randomization is the process of making something random; this means:* Generating a random permutation of a sequence .* Selecting a random sample of a population ....
. Peirce's preference for randomization-based inference is discussed in "Illustrations of the Logic of Science" (1877–1878) and "A Theory of Probable Inference" (1883)".
"probabilities that are strictly objective and at the same time very great, although they can never be absolutely conclusive, ought nevertheless to influence our preference for one hypothesis over another; but slight probabilities, even if objective, are not worth consideration; and merely subjective likelihoods should be disregarded altogether. For they are merely expressions of our preconceived notions" (7.227 in his Collected Papers).
"But experience must be our chart in economical navigation; and experience shows that likelihoods are treacherous guides. Nothing has caused so much waste of time and means, in all sorts of researchers, as inquirers' becoming so wedded to certain likelihoods as to forget all the other factors of the economy of research; so that, unless it be very solidly grounded, likelihood is far better disregarded, or nearly so; and even when it seems solidly grounded, it should be proceeded upon with a cautious tread, with an eye to other considerations, and recollection of the disasters caused." (Essential Peirce, volume 2, pages 108–109)
Like Thiele, Peirce considers the likelihood for a binomial distribution. Peirce uses the logarithm of the odds-ratio throughout his career. Peirce's propensity for using the log odds is discussed by Stephen Stigler
Stephen Stigler
Stephen Mack Stigler is Ernest DeWitt Burton Distinguished Service Professor at the Department of Statistics of the University of Chicago. His research has focused on statistical theory of robust estimators and the history of statistics...
.
In Great Britain, "likelihood" was popularized in mathematical statistics by R.A. Fisher in 1922: "On the mathematical foundations of theoretical statistics". In that paper, Fisher also uses the term "method of maximum likelihood". Fisher argues against inverse probability
Inverse probability
In probability theory, inverse probability is an obsolete term for the probability distribution of an unobserved variable.Today, the problem of determining an unobserved variable is called inferential statistics, the method of inverse probability is called Bayesian probability, the "distribution"...
as a basis for statistical inferences, and instead proposes inferences based on likelihood functions. Fisher's use of "likelihood" fixed the terminology that is used by statisticians throughout the world.
See also
- Bayes factorBayes factorIn statistics, the use of Bayes factors is a Bayesian alternative to classical hypothesis testing. Bayesian model comparison is a method of model selection based on Bayes factors.-Definition:...
- Bayesian inferenceBayesian inferenceIn statistics, Bayesian inference is a method of statistical inference. It is often used in science and engineering to determine model parameters, make predictions about unknown variables, and to perform model selection...
- Conditional probabilityConditional probabilityIn probability theory, the "conditional probability of A given B" is the probability of A if B is known to occur. It is commonly notated P, and sometimes P_B. P can be visualised as the probability of event A when the sample space is restricted to event B...
- Likelihood principleLikelihood principleIn statistics,the likelihood principle is a controversial principle of statistical inference which asserts that all of the information in a sample is contained in the likelihood function....
- Maximum likelihoodMaximum likelihoodIn statistics, maximum-likelihood estimation is a method of estimating the parameters of a statistical model. When applied to a data set and given a statistical model, maximum-likelihood estimation provides estimates for the model's parameters....
- Likelihood-ratio testLikelihood-ratio testIn statistics, a likelihood ratio test is a statistical test used to compare the fit of two models, one of which is a special case of the other . The test is based on the likelihood ratio, which expresses how many times more likely the data are under one model than the other...
- Principle of maximum entropyPrinciple of maximum entropyIn Bayesian probability, the principle of maximum entropy is a postulate which states that, subject to known constraints , the probability distribution which best represents the current state of knowledge is the one with largest entropy.Let some testable information about a probability distribution...
- Conditional entropyConditional entropyIn information theory, the conditional entropy quantifies the remaining entropy of a random variable Y given that the value of another random variable X is known. It is referred to as the entropy of Y conditional on X, and is written H...
- Score (statistics)Score (statistics)In statistics, the score, score function, efficient score or informant plays an important role in several aspects of inference...