

Data transformation (statistics)
Encyclopedia
Statistics
Statistics is the study of the collection, organization, analysis, and interpretation of data. It deals with all aspects of this, including the planning of data collection in terms of the design of surveys and experiments....
, data transformation
Transformation (mathematics)
In mathematics, a transformation could be any function mapping a set X on to another set or on to itself. However, often the set X has some additional algebraic or geometric structure and the term "transformation" refers to a function from X to itself that preserves this structure.Examples include...
refers to the application of a deterministic mathematical function
Function (mathematics)
In mathematics, a function associates one quantity, the argument of the function, also known as the input, with another quantity, the value of the function, also known as the output. A function assigns exactly one output to each input. The argument and the value may be real numbers, but they can...
to each point in a data
Data
The term data refers to qualitative or quantitative attributes of a variable or set of variables. Data are typically the results of measurements and can be the basis of graphs, images, or observations of a set of variables. Data are often viewed as the lowest level of abstraction from which...
set — that is, each data point zi is replaced with the transformed value yi = f(zi), where f is a function. Transforms are usually applied so that the data appear to more closely meet the assumptions of a statistical inference
Statistical inference
In statistics, statistical inference is the process of drawing conclusions from data that are subject to random variation, for example, observational errors or sampling variation...
procedure that is to be applied, or to improve the interpretability or appearance of graphs
Statistical graphics
Statistical graphics, also known as graphical techniques, are information graphics in the field of statistics used to visualize quantitative data.- Overview :...
.
Nearly always, the function that is used to transform the data is invertible
Inverse function
In mathematics, an inverse function is a function that undoes another function: If an input x into the function ƒ produces an output y, then putting y into the inverse function g produces the output x, and vice versa. i.e., ƒ=y, and g=x...
, and generally is continuous
Continuous function
In mathematics, a continuous function is a function for which, intuitively, "small" changes in the input result in "small" changes in the output. Otherwise, a function is said to be "discontinuous". A continuous function with a continuous inverse function is called "bicontinuous".Continuity of...
. The transformation is usually applied to a collection of comparable measurements. For example, if we are working with data on peoples' incomes in some currency
Currency
In economics, currency refers to a generally accepted medium of exchange. These are usually the coins and banknotes of a particular government, which comprise the physical aspects of a nation's money supply...
unit, it would be common to transform each person's income value by the logarithm
Logarithm
The logarithm of a number is the exponent by which another fixed value, the base, has to be raised to produce that number. For example, the logarithm of 1000 to base 10 is 3, because 1000 is 10 to the power 3: More generally, if x = by, then y is the logarithm of x to base b, and is written...
function.
Reasons for transforming data
Guidance for how data should be transformed, or whether a transform should be applied at all, should come from the particular statistical analysis to be performed. For example, a simple way to construct an approximate 95% confidence intervalConfidence interval
In statistics, a confidence interval is a particular kind of interval estimate of a population parameter and is used to indicate the reliability of an estimate. It is an observed interval , in principle different from sample to sample, that frequently includes the parameter of interest, if the...
for the population mean is to take the sample mean
Arithmetic mean
In mathematics and statistics, the arithmetic mean, often referred to as simply the mean or average when the context is clear, is a method to derive the central tendency of a sample space...
plus or minus two standard error
Standard error
Standard error can refer to:* Standard error , the estimated standard deviation or error of a series of measurements* Standard error stream, one of the standard streams in Unix-like operating systems...
units. However, the constant factor 2 used here is particular to the normal distribution, and is only applicable if the sample mean varies approximately normally. The central limit theorem
Central limit theorem
In probability theory, the central limit theorem states conditions under which the mean of a sufficiently large number of independent random variables, each with finite mean and variance, will be approximately normally distributed. The central limit theorem has a number of variants. In its common...
states that in many situations, the sample mean does vary normally if the sample size is reasonably large. However if the population
Statistical population
A statistical population is a set of entities concerning which statistical inferences are to be drawn, often based on a random sample taken from the population. For example, if we were interested in generalizations about crows, then we would describe the set of crows that is of interest...
is substantially skewed
Skewness
In probability theory and statistics, skewness is a measure of the asymmetry of the probability distribution of a real-valued random variable. The skewness value can be positive or negative, or even undefined...
and the sample size is at most moderate, the approximation provided by the central limit theorem can be poor, and the resulting confidence interval will likely have the wrong coverage probability
Coverage probability
In statistics, the coverage probability of a confidence interval is the proportion of the time that the interval contains the true value of interest. For example, suppose our interest is in the mean number of months that people with a particular type of cancer remain in remission following...
. Thus, when there is evidence of substantial skew in the data, it is common to transform the data to a symmetric
Symmetry
Symmetry generally conveys two primary meanings. The first is an imprecise sense of harmonious or aesthetically pleasing proportionality and balance; such that it reflects beauty or perfection...
distribution
Probability distribution
In probability theory, a probability mass, probability density, or probability distribution is a function that describes the probability of a random variable taking certain values....
before constructing a confidence interval. If desired, the confidence interval can then be transformed back to the original scale using the inverse of the transformation that was applied to the data.
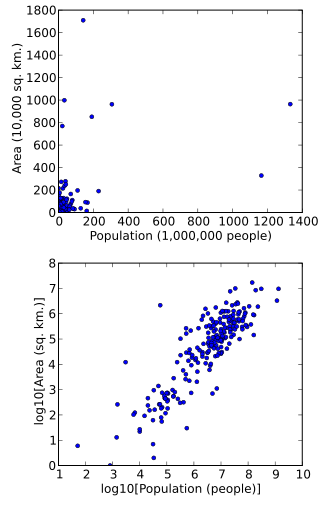
Data can also be transformed to make it easier to visualize
Visualize
Visualize is a video release by Def Leppard. A compilation of promo videos, interviews, and concert footage. On DVD, it is bundled with Video Archive.-Track list:# Opening Statements and Titles# Rocket # Switch 625...
them. For example, suppose we have a scatterplot in which the points are the countries of the world, and the data values being plotted are the land area and population of each country. If the plot is made using untransformed data (e.g. square kilometers for area and the number of people for population), most of the countries would be plotted in tight cluster of points in the lower left corner of the graph. The few countries with very large areas and/or populations would be spread thinly around most of the graph's area. Simply rescaling units (e.g. to thousand square kilometers, or to millions of people) will not change this. However, following logarithm
Logarithm
The logarithm of a number is the exponent by which another fixed value, the base, has to be raised to produce that number. For example, the logarithm of 1000 to base 10 is 3, because 1000 is 10 to the power 3: More generally, if x = by, then y is the logarithm of x to base b, and is written...
ic transformations of both area and population, the points will be spread more uniformly in the graph.
A final reason that data can be transformed is to improve interpretability, even if no formal statistical analysis or visualization is to be performed. For example, suppose we are comparing cars
Automobile
An automobile, autocar, motor car or car is a wheeled motor vehicle used for transporting passengers, which also carries its own engine or motor...
in terms of their fuel economy. These data are usually presented as "kilometers per liter" or "miles per gallon." However if the goal is to assess how much additional fuel a person would use in one year when driving one car compared to another, it is more natural to work with the data transformed by the reciprocal
Multiplicative inverse
In mathematics, a multiplicative inverse or reciprocal for a number x, denoted by 1/x or x−1, is a number which when multiplied by x yields the multiplicative identity, 1. The multiplicative inverse of a fraction a/b is b/a. For the multiplicative inverse of a real number, divide 1 by the...
function, yielding liters per kilometer, or gallons per mile.
Data transformation in regression
Linear regressionLinear regression
In statistics, linear regression is an approach to modeling the relationship between a scalar variable y and one or more explanatory variables denoted X. The case of one explanatory variable is called simple regression...
is a statistical technique for relating a dependent variable
Dependent and independent variables
The terms "dependent variable" and "independent variable" are used in similar but subtly different ways in mathematics and statistics as part of the standard terminology in those subjects...
Y to one or more independent variables X. The simplest regression models capture a linear
Linear
In mathematics, a linear map or function f is a function which satisfies the following two properties:* Additivity : f = f + f...
relationship between the expected value
Expected value
In probability theory, the expected value of a random variable is the weighted average of all possible values that this random variable can take on...
of Y and each independent variable
Dependent and independent variables
The terms "dependent variable" and "independent variable" are used in similar but subtly different ways in mathematics and statistics as part of the standard terminology in those subjects...
(when the other independent variables are held fixed). If linearity fails to hold, even approximately, it is sometimes possible to transform either the independent or dependent variables in the regression model to improve the linearity.
Another assumption of linear regression is that the variance
Variance
In probability theory and statistics, the variance is a measure of how far a set of numbers is spread out. It is one of several descriptors of a probability distribution, describing how far the numbers lie from the mean . In particular, the variance is one of the moments of a distribution...
be the same for each possible expected value (this is known as homoskedasticity). Univariate normality is not needed for least squares
Least squares
The method of least squares is a standard approach to the approximate solution of overdetermined systems, i.e., sets of equations in which there are more equations than unknowns. "Least squares" means that the overall solution minimizes the sum of the squares of the errors made in solving every...
estimates of the regression parameters to be meaningful (see Gauss-Markov theorem). However confidence intervals and hypothesis tests will have better statistical properties if the variables exhibit multivariate normality. This can be assessed empirically by plotting the fitted values against the residuals
Errors and residuals in statistics
In statistics and optimization, statistical errors and residuals are two closely related and easily confused measures of the deviation of a sample from its "theoretical value"...
, and by inspecting the normal quantile plot
Q-Q plot
In statistics, a Q-Q plot is a probability plot, which is a graphical method for comparing two probability distributions by plotting their quantiles against each other. First, the set of intervals for the quantiles are chosen...
of the residuals. Note that it is not relevant whether the dependent variable Y is marginally
Marginal distribution
In probability theory and statistics, the marginal distribution of a subset of a collection of random variables is the probability distribution of the variables contained in the subset. The term marginal variable is used to refer to those variables in the subset of variables being retained...
normally distributed.
Examples of logarithmic transformations
Equation:
Meaning:
A unit increase in X is associated with an average of b units increase in Y.
Equation:
 (From taking the log of both sides of the equation:
  )
)Meaning:
A unit increase in X is associated with an average of 100b% increase in Y.
Equation:

Meaning:
A 1% increase in X is associated with an average b/100 units increase in Y.
Equation:
 (From taking the log of both sides of the equation:
  )
)Meaning:
A 1% increase in X is associated with a b% increase in Y.
Common transformations
The logarithmLogarithm
The logarithm of a number is the exponent by which another fixed value, the base, has to be raised to produce that number. For example, the logarithm of 1000 to base 10 is 3, because 1000 is 10 to the power 3: More generally, if x = by, then y is the logarithm of x to base b, and is written...
and square root
Square root
In mathematics, a square root of a number x is a number r such that r2 = x, or, in other words, a number r whose square is x...
transformations are commonly used for positive data, and the multiplicative inverse
Multiplicative inverse
In mathematics, a multiplicative inverse or reciprocal for a number x, denoted by 1/x or x−1, is a number which when multiplied by x yields the multiplicative identity, 1. The multiplicative inverse of a fraction a/b is b/a. For the multiplicative inverse of a real number, divide 1 by the...
(reciprocal) transformation can be used for non-zero data. The power transform
Power transform
In statistics, the power transform is from a family of functions that are applied to create a rank-preserving transformation of data using power functions. This is a useful data processing technique used to stabilize variance, make the data more normal distribution-like, improve the correlation...
is a family of transformations parametrized by a non-negative value λ that includes the logarithm, square root, and multiplicative inverse as special cases. To approach data transformation systematically, it is possible to use statistical estimation
Estimation theory
Estimation theory is a branch of statistics and signal processing that deals with estimating the values of parameters based on measured/empirical data that has a random component. The parameters describe an underlying physical setting in such a way that their value affects the distribution of the...
techniques to estimate the parameter λ in the power transform, thereby identifying the transform that is approximately the most appropriate in a given setting. Since the power transform family also includes the identity transform, this approach can also indicate whether it would be best to analyze the data without a transformation. In regression analysis, this approach is known as the Box-Cox technique.
The reciprocal and some power transformations can be meaningfully applied to data that include both positive and negative values (the power transform is invertible over all real numbers if λ is an odd integer). However when both negative and positive values are observed, it is more common to begin by adding a constant to all values, producing a set of non-negative data to which any power transform can be applied.
A common situation where a data transformation is applied is when a value of interest ranges over several orders of magnitude
Order of magnitude
An order of magnitude is the class of scale or magnitude of any amount, where each class contains values of a fixed ratio to the class preceding it. In its most common usage, the amount being scaled is 10 and the scale is the exponent being applied to this amount...
. Many physical and social phenomena exhibit such behavior — incomes, species populations, galaxy sizes, and rainfall volumes, to name a few. Power transforms, and in particular the logarithm, can often be used to induce symmetry in such data. The logarithm is often favored because it is easy to interpret its result in terms of "fold changes."
The logarithm also has a useful effect on ratios. If we are comparing positive quantities X and Y using the ratio X / Y, then if X < Y, the ratio is in the unit interval (0,1), whereas if X > Y, the ratio is in the half-line (1,∞), where the ratio of 1 corresponds to equality. In an analysis where X and Y are treated symmetrically, the log-ratio log(X / Y) is zero in the case of equality, and it has the property that if X is K times greater than Y, the log-ratio is the equidistant from zero as in the situation where Y is K times greater than X (the log-ratios are log(K) and −log(K) in these two situations).
If values are naturally restricted to be in the range 0 to 1, not including the end-points, then a logit transformation
Logit
The logit function is the inverse of the sigmoidal "logistic" function used in mathematics, especially in statistics.Log-odds and logit are synonyms.-Definition:The logit of a number p between 0 and 1 is given by the formula:...
may be appropriate: this yields values in the range (−∞,∞).
Transforming to normality
It is not always necessary or desirable to transform a data set to resemble a normal distribution. However if symmetry or normality are desired, they can often be induced through one of the power transformations.To assess whether normality has been achieved, a graphical approach is usually more informative than a formal statistical test. A normal quantile plot
Q-Q plot
In statistics, a Q-Q plot is a probability plot, which is a graphical method for comparing two probability distributions by plotting their quantiles against each other. First, the set of intervals for the quantiles are chosen...
is commonly used to assess the fit of a data set to a normal population. Alternatively, rules of thumb based on the sample skewness
Skewness
In probability theory and statistics, skewness is a measure of the asymmetry of the probability distribution of a real-valued random variable. The skewness value can be positive or negative, or even undefined...
and kurtosis
Kurtosis
In probability theory and statistics, kurtosis is any measure of the "peakedness" of the probability distribution of a real-valued random variable...
have also been proposed, such as having skewness in the range of −0.8 to 0.8 and kurtosis in the range of −3.0 to 3.0.
Transforming to a uniform distribution
If we observe a set of n values X1, ..., Xn with no ties (i.e. there are n distinct values), we can replace Xi with the transformed value Yi = k, where k is defined such that Xi is the kth largest among all the X values. This is called the rank transform, and creates data with a perfect fit to a uniform distribution. This approach has a populationStatistical population
A statistical population is a set of entities concerning which statistical inferences are to be drawn, often based on a random sample taken from the population. For example, if we were interested in generalizations about crows, then we would describe the set of crows that is of interest...
analogue. If X is any random variable
Random variable
In probability and statistics, a random variable or stochastic variable is, roughly speaking, a variable whose value results from a measurement on some type of random process. Formally, it is a function from a probability space, typically to the real numbers, which is measurable functionmeasurable...
, and F is the cumulative distribution function
Cumulative distribution function
In probability theory and statistics, the cumulative distribution function , or just distribution function, describes the probability that a real-valued random variable X with a given probability distribution will be found at a value less than or equal to x. Intuitively, it is the "area so far"...
of X, then as long as F is invertible, the random variable U = F(X) follows a uniform distribution on the unit interval
Unit interval
In mathematics, the unit interval is the closed interval , that is, the set of all real numbers that are greater than or equal to 0 and less than or equal to 1...
[0,1].
From a uniform distribution, we can transform to any distribution with an invertible cumulative distribution function. If G is an invertible cumulative distribution function, and U is a uniformly distributed random variable, then the random variable G−1(U) has G as its cumulative distribution function.
Variance stabilizing transformations
Many types of statistical data exhibit a "mean/varianceVariance
In probability theory and statistics, the variance is a measure of how far a set of numbers is spread out. It is one of several descriptors of a probability distribution, describing how far the numbers lie from the mean . In particular, the variance is one of the moments of a distribution...
relationship", meaning that the variability is different for data values with different expected values. As an example, in many parts of the world incomes follow an increasing mean/variance relationship. If we consider a number of small area units (e.g., counties in the United States) and obtain the mean and variance of incomes within each county, it is common that the counties with higher mean income also have higher variances.
A variance-stabilizing transformation
Variance-stabilizing transformation
In applied statistics, a variance-stabilizing transformation is a data transformation that is specifically chosen either to simplify considerations in graphical exploratory data analysis or to allow the application of simple regression-based or analysis of variance techniques.The aim behind the...
aims to remove a mean/variance relationship, so that the variance becomes constant relative to the mean. Examples of variance-stabilizing transformations are the Fisher transformation
Fisher transformation
In statistics, hypotheses about the value of the population correlation coefficient ρ between variables X and Y can be tested using the Fisher transformation applied to the sample correlation coefficient r.-Definition:...
for the sample correlation coefficient, the square root
Square root
In mathematics, a square root of a number x is a number r such that r2 = x, or, in other words, a number r whose square is x...
transformation or Anscombe transform
Anscombe transform
In statistics, the Anscombe transform, named after Francis Anscombe, is a variance-stabilizing transformation that transforms a random variable with a Poisson distribution into one with an approximately standard Gaussian distribution. The Anscombe transform is widely used in photon-limited imaging ...
for Poisson
Poisson distribution
In probability theory and statistics, the Poisson distribution is a discrete probability distribution that expresses the probability of a given number of events occurring in a fixed interval of time and/or space if these events occur with a known average rate and independently of the time since...
data (count data), the Box-Cox transformation for regression analysis and the arcsine square root transformation or angular transformation for proportions (binomial data).
Transformations for multivariate data
Univariate functions can be applied point-wise to multivariate data to modify their marginal distributions. It is also possible to modify some attributes of a multivariate distribution using an appropriately constructed transformation. For example, when working with time seriesTime series
In statistics, signal processing, econometrics and mathematical finance, a time series is a sequence of data points, measured typically at successive times spaced at uniform time intervals. Examples of time series are the daily closing value of the Dow Jones index or the annual flow volume of the...
and other types of sequential data, it is common to difference
Finite difference
A finite difference is a mathematical expression of the form f − f. If a finite difference is divided by b − a, one gets a difference quotient...
the data to improve stationarity
Stationary process
In the mathematical sciences, a stationary process is a stochastic process whose joint probability distribution does not change when shifted in time or space...
. If data are observed as random vectors Xi with covariance matrix
Covariance matrix
In probability theory and statistics, a covariance matrix is a matrix whose element in the i, j position is the covariance between the i th and j th elements of a random vector...
Σ, a linear transformation
Linear transformation
In mathematics, a linear map, linear mapping, linear transformation, or linear operator is a function between two vector spaces that preserves the operations of vector addition and scalar multiplication. As a result, it always maps straight lines to straight lines or 0...
can be used to decorrelate the data. To do this, use the Cholesky decomposition
Cholesky decomposition
In linear algebra, the Cholesky decomposition or Cholesky triangle is a decomposition of a Hermitian, positive-definite matrix into the product of a lower triangular matrix and its conjugate transpose. It was discovered by André-Louis Cholesky for real matrices...
to express Σ = A A. Then the transformed vector Yi = A−1Xi has the identity matrix
Identity matrix
In linear algebra, the identity matrix or unit matrix of size n is the n×n square matrix with ones on the main diagonal and zeros elsewhere. It is denoted by In, or simply by I if the size is immaterial or can be trivially determined by the context...
as its covariance matrix.