Power transform
Encyclopedia
In statistics
, the power transform is from a family of functions that are applied to create a rank-preserving transformation of data
using power functions. This is a useful data (pre)processing
technique used to stabilize variance, make the data more normal distribution-like, improve the correlation between variables and for other data stabilization procedures. The Box–Cox transformation, by statisticians George E. P. Box
and David Cox
, is one particular way of parameterising a power transform that has advantageous properties.
Statistics
Statistics is the study of the collection, organization, analysis, and interpretation of data. It deals with all aspects of this, including the planning of data collection in terms of the design of surveys and experiments....
, the power transform is from a family of functions that are applied to create a rank-preserving transformation of data
Data
The term data refers to qualitative or quantitative attributes of a variable or set of variables. Data are typically the results of measurements and can be the basis of graphs, images, or observations of a set of variables. Data are often viewed as the lowest level of abstraction from which...
using power functions. This is a useful data (pre)processing
Data processing
Computer data processing is any process that a computer program does to enter data and summarise, analyse or otherwise convert data into usable information. The process may be automated and run on a computer. It involves recording, analysing, sorting, summarising, calculating, disseminating and...
technique used to stabilize variance, make the data more normal distribution-like, improve the correlation between variables and for other data stabilization procedures. The Box–Cox transformation, by statisticians George E. P. Box
George E. P. Box
- External links :* from a at NIST* * * * * *** For Box's PhD students see*...
and David Cox
David Cox (statistician)
Sir David Roxbee Cox FRS is a prominent British statistician.-Early years:Cox studied mathematics at St. John's College, Cambridge and obtained his PhD from the University of Leeds in 1949, advised by Henry Daniels and Bernard Welch.-Career:He was employed from 1944 to 1946 at the Royal Aircraft...
, is one particular way of parameterising a power transform that has advantageous properties.
Definition
The power transformation is defined as a continuously varying function, with respect to the power parameter λ, in a piece-wise function form that makes it continuous at the point of singularity (λ = 0). For data vectors (y1,..., yn) in which each yi > 0, the power transform is-

where
is the geometric meanGeometric meanThe geometric mean, in mathematics, is a type of mean or average, which indicates the central tendency or typical value of a set of numbers. It is similar to the arithmetic mean, except that the numbers are multiplied and then the nth root of the resulting product is taken.For instance, the...
of the observations y1, ..., yn.
The inclusion of the (λ − 1)th power of the geometric mean in the denominator implies that the units of measurement do not change as λ changes. That makes it possible to compare sums of squares of residualsErrors and residuals in statisticsIn statistics and optimization, statistical errors and residuals are two closely related and easily confused measures of the deviation of a sample from its "theoretical value"...
and choose the value of λ that minimizes that sum.
The value at Y = 1 for any λ is 0, and the derivativeDerivativeIn calculus, a branch of mathematics, the derivative is a measure of how a function changes as its input changes. Loosely speaking, a derivative can be thought of as how much one quantity is changing in response to changes in some other quantity; for example, the derivative of the position of a...
with respect to Y there is 1 for any λ. Sometimes Y is a version of some other variable scaled to give Y = 1 at some sort of average value.
The transformation is a power transformation, but done in such a way as to make it continuousContinuous functionIn mathematics, a continuous function is a function for which, intuitively, "small" changes in the input result in "small" changes in the output. Otherwise, a function is said to be "discontinuous". A continuous function with a continuous inverse function is called "bicontinuous".Continuity of...
with the parameter λ at λ = 0. It has proved popular in regression analysisRegression analysisIn statistics, regression analysis includes many techniques for modeling and analyzing several variables, when the focus is on the relationship between a dependent variable and one or more independent variables...
, including econometricsEconometricsEconometrics has been defined as "the application of mathematics and statistical methods to economic data" and described as the branch of economics "that aims to give empirical content to economic relations." More precisely, it is "the quantitative analysis of actual economic phenomena based on...
.
Box and Cox also proposed a more general form of the transformation that incorporates a shift parameter.
If τ(Y, λ, α) follows a truncated normal distributionTruncated normal distributionIn probability and statistics, the truncated normal distribution is the probability distribution of a normally distributed random variable whose value is either bounded below or above . The truncated normal distribution has wide applications in statistics and econometrics...
, then Y is said to follow a Box–Cox distribution.
Use of the power transform
- Power transforms are ubiquitously used in various fields. For example, multi-resolution and wavelet analysis, statistical data analysis, medical research, modeling of physical processes, geochemical data analysis, epidemiology and many other clinical, environmental and social research areas.
Example
The BUPA liver data set contains data on liver enzymes ALTAlanine transaminaseAlanine transaminase or ALT is a transaminase enzyme . It is also called serum glutamic pyruvic transaminase or alanine aminotransferase ....
and γGT. The data can be found via the classic data sets page. Suppose we are interested in using log(γGT) to predict ALT. A plot of the data appears in panel (a) of the figure. There appears to be non-constant variance, and a Box–Cox transformation might help.
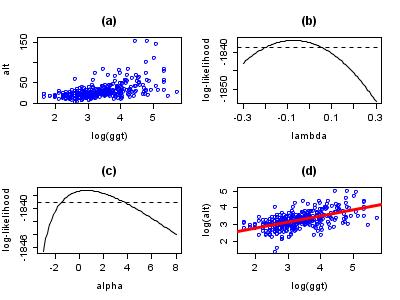
The log-likelihood of the power parameter appears in panel (b). The horizontal reference line is at a distance of χ12/2 from the maximum and can be used to read off an approximate 95% confidence interval for λ. It appears as though a value close to zero would be good, so we take logs.
Possibly, the transformation could be improved by adding a shift parameter to the log transformation. Panel (c) of the figure shows the log-likelihood. In this case, the maximum of the likelihood is close to zero suggesting that a shift parameter is not needed. The final panel shows the transformed data with a superimposed regression line.
Note that although Box–Cox transformations can make big improvements in model fit, there are some issues that the transformation cannot help with. In the current example, the data are rather heavy-tailed so that the assumption of normality is not realistic and a robust regressionRobust regressionIn robust statistics, robust regression is a form of regression analysis designed to circumvent some limitations of traditional parametric and non-parametric methods. Regression analysis seeks to find the effect of one or more independent variables upon a dependent variable...
approach leads to a more precise model.
Econometric application
Economists often characterize production relationships by some variant of the Box–Cox transformation.
Consider a common representation of production Q as dependent on services provided by a capital stock K and by labor hours N:

Solving for Q by inverting the Box–Cox transformation we find
which is known as the constant elasticity of substitution (CES) production function.
The CES production function is a homogeneous functionHomogeneous functionIn mathematics, a homogeneous function is a function with multiplicative scaling behaviour: if the argument is multiplied by a factor, then the result is multiplied by some power of this factor. More precisely, if is a function between two vector spaces over a field F, and k is an integer, then...
of degree one.
When λ = 1, this produces the linear production function:
When λ → 0 this produces the famous Cobb-DouglasCobb-DouglasIn economics, the Cobb–Douglas functional form of production functions is widely used to represent the relationship of an output to inputs. Similar functions were originally used by Knut Wicksell , while the Cobb-Douglas form was developed and tested against statistical evidence by Charles Cobb and...
production function:
Activities and demonstrations
The SOCRSOCRThe Statistics Online Computational Resource is a suite of online tools and interactive aids for hands-on learning and teaching concepts in statistical analysis and probability theory developed at the University of California, Los Angeles...
resource pages contain a number of hands-on interactive activities demonstrating the Box–Cox (Power) Transformation using Java applets and charts. These directly illustrate the effects of this transform on Qq plots, X-Y scatterplotScatterplotA scatter plot or scattergraph is a type of mathematical diagram using Cartesian coordinates to display values for two variables for a set of data....
s, time-series plots and histogramHistogramIn statistics, a histogram is a graphical representation showing a visual impression of the distribution of data. It is an estimate of the probability distribution of a continuous variable and was first introduced by Karl Pearson...
s. -