
Q-Q plot
Encyclopedia
In statistics
, a Q-Q plot ("Q" stands for quantile
) is a probability plot
, which is a graphical method for comparing two probability distribution
s by plotting their quantiles against each other. First, the set of intervals for the quantiles are chosen. A point (x,y) on the plot corresponds to one of the quantiles of the second distribution (y-coordinate) plotted against the same quantile of the first distribution (x-coordinate). Thus the line is a parametric curve with the parameter which is the (number of the) interval for the quantile.
If the two distributions being compared are similar, the points in the Q-Q plot will approximately lie on the line y = x. If the distributions are linearly related, the points in the Q-Q plot will approximately lie on a line, but not necessarily on the line y = x. Q-Q plots can also be used as a graphical means of estimating parameters in a location-scale family
of distributions.
A Q-Q plot is used to compare the shapes of distributions, providing a graphical view of how properties such as location
, scale
, and skewness
are similar or different in the two distributions. Q-Q plots can be used to compare collections of data
, or theoretical distributions
. The use of Q-Q plots to compare two samples of data can be viewed as a non-parametric
approach to comparing their underlying distributions. A Q-Q plot is generally a more powerful approach to doing this than the common technique of comparing histogram
s of the two samples, but requires more skill to interpret. Q-Q plots are commonly used to compare a data set to a theoretical model. This can provide an assessment of "goodness of fit" that is graphical, rather than reducing to a numerical summary. Q-Q plots are also used to compare two theoretical distributions to each other. Since Q-Q plots compare distributions, there is no need for the values to be observed as pairs, as in a scatterplot
, or even for the numbers of values in the two groups being compared to be equal.
The term "probability plot" sometimes refers specifically to a Q-Q plot, sometimes to a more general class of plots, and sometimes to the less commonly used P-P plot. The probability plot correlation coefficient is a quantity derived from the idea of Q-Q plots, which measures the agreement of a fitted distribution with observed data and which is sometimes used as a means of fitting a distribution to data: see later.
 A Q-Q plot is a plot of the quantiles of two distributions against each other, or a plot based on estimates of the quantiles. The pattern of points in the plot is used to compare the two distributions.
The main step in constructing a Q-Q plot is calculating or estimating the quantiles to be plotted. If one or both of the axes in a Q-Q plot is based on a theoretical distribution with a continuous cumulative distribution function
(CDF), all quantiles are uniquely defined and can be obtained by inverting the CDF. If a theoretical probability distribution with a discontinuous CDF is one of the two distributions being compared, some of the quantiles may not be defined, so an interpolated quantile may be plotted. If the Q-Q plot is based on data, there are multiple quantile estimators in use. Rules for forming Q-Q plots when quantiles must be estimated or interpolated are called plotting positions.
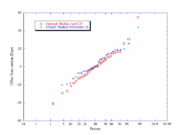
A simple case is where one has two data sets of the same size. In that case, to make the Q-Q plot, one orders each set in increasing order, then pairs off and plots the corresponding values. A more complicated construction is the case where two data sets of different sizes are being compared. To construct the Q-Q plot in this case, it is necessary to use an interpolated
quantile estimate so that quantiles corresponding to the same underlying probability can be constructed.
More abstractly, given two cumulative probability distribution functions F and G, with associated quantile function
s F −1 and G−1 (the inverse function of the CDF is the quantile function), the Q-Q plot draws the qth quantile of F against the qth quantile of G for a range of values of q. Thus, the Q-Q plot is a parametric curve
indexed over [0,1] with values in the real plane R2.
than the distribution plotted on the vertical axis. Conversely, if the general trend of the Q-Q plot is steeper than the line y = x, the distribution plotted on the vertical axis is more dispersed
than the distribution plotted on the horizontal axis. Q-Q plots are often arced, or "S" shaped, indicating that one of the distributions is more skewed than the other, or that one of the distributions has heavier tails than the other.
Although a Q-Q plot is based on quantiles, in a standard Q-Q plot it is not possible to determine which point in the Q-Q plot determines a given quantile. For example, it is not possible to determine the median of either of the two distributions being compared by inspecting the Q-Q plot. Some Q-Q plots indicate the deciles to make determinations such as this possible.
The slope and position of a linear regression between the quantiles gives a measure of the relative location and relative scale of the samples. If the median of the distribution plotted on the horizontal axis is 0, the intercept of a regression line is a measure of location, and the slope is a measure of scale. The distance between medians is another measure of relative location reflected in a Q-Q plot. The "probability plot correlation coefficient" is the correlation coefficient between the paired sample quantiles. The closer the correlation coefficient is to one, the closer the distributions are to being shifted, scaled versions of each other. For distributions with a single shape parameter, the probability plot correlation coefficient plot
(PPCC plot) provides a method for estimating the shape parameter – one simply computes the correlation coefficient for different values of the shape parameter, and uses the one with the best fit, just as if one were comparing distributions of different types.
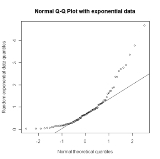
Another common use of Q-Q plots is to compare the distribution of a sample to a theoretical distribution, such as the standard normal distribution N(0,1), as in a normal probability plot
. As in the case when comparing two samples of data, one orders the data (formally, computes the order statistics), then plots them against certain quantiles of the theoretical distribution.
, the quantiles one uses are the rankit
s, the quantile of the expected value of the order statistic of a standard normal distribution.
More generally, Wilk–Shapiro uses the expected values of the order statistics of the given distribution; the resulting plot and line yields the generalized least squares
estimate for location and scale (from the intercept
and slope
of the fitted line).
Although this is not too important for the normal distribution (the location and scale are estimated by the mean and standard deviation, respectively), it can be useful for many other distributions.
However, this requires calculating the expected values of the order statistic, which may be difficult if the distribution is not normal.
of the order statistics, which one can compute based on estimates of the median of the order statistics of a uniform distribution and the quantile function
of the distribution; this was suggested by .
This can be easily generated for any distribution for which the quantile function
can be computed, but conversely the resulting estimates of location and scale are no longer precisely the least squares estimates, though these only differ significantly for n small.
Several different formulas have been used or proposed as symmetrical plotting positions. Such formulas have the form (k − a)/(n + 1 − 2a) for some value of a in the range from 0 to 1/2, which gives a range between k/(n + 1) and (k − 1/2)/n.
Other expressions include:
For large sample size, n, there is little difference between these various expressions.

where U(i) are the uniform order statistic medians and G is the quantile function
for the desired distribution. The quantile function is the inverse of the cumulative distribution function
(probability that X is less than or equal to some value). That is, given a probability, we want the corresponding quantile
of the cumulative distribution function.
James J. Filliben uses the following estimates for the uniform order statistic medians:
The reason for this estimate is that the order statistic medians do not have a simple form.
Statistics
Statistics is the study of the collection, organization, analysis, and interpretation of data. It deals with all aspects of this, including the planning of data collection in terms of the design of surveys and experiments....
, a Q-Q plot ("Q" stands for quantile
Quantile
Quantiles are points taken at regular intervals from the cumulative distribution function of a random variable. Dividing ordered data into q essentially equal-sized data subsets is the motivation for q-quantiles; the quantiles are the data values marking the boundaries between consecutive subsets...
) is a probability plot
Probability plot
In statistics, a P-P plot is a probability plot for assessing how closely two data sets agree, which plots the two cumulative distribution functions against each other....
, which is a graphical method for comparing two probability distribution
Probability distribution
In probability theory, a probability mass, probability density, or probability distribution is a function that describes the probability of a random variable taking certain values....
s by plotting their quantiles against each other. First, the set of intervals for the quantiles are chosen. A point (x,y) on the plot corresponds to one of the quantiles of the second distribution (y-coordinate) plotted against the same quantile of the first distribution (x-coordinate). Thus the line is a parametric curve with the parameter which is the (number of the) interval for the quantile.
If the two distributions being compared are similar, the points in the Q-Q plot will approximately lie on the line y = x. If the distributions are linearly related, the points in the Q-Q plot will approximately lie on a line, but not necessarily on the line y = x. Q-Q plots can also be used as a graphical means of estimating parameters in a location-scale family
Location-scale family
In probability theory, especially as that field is used in statistics, a location-scale family is a family of univariate probability distributions parametrized by a location parameter and a non-negative scale parameter; if X is any random variable whose probability distribution belongs to such a...
of distributions.
A Q-Q plot is used to compare the shapes of distributions, providing a graphical view of how properties such as location
Central tendency
In statistics, the term central tendency relates to the way in which quantitative data is clustered around some value. A measure of central tendency is a way of specifying - central value...
, scale
Statistical dispersion
In statistics, statistical dispersion is variability or spread in a variable or a probability distribution...
, and skewness
Skewness
In probability theory and statistics, skewness is a measure of the asymmetry of the probability distribution of a real-valued random variable. The skewness value can be positive or negative, or even undefined...
are similar or different in the two distributions. Q-Q plots can be used to compare collections of data
Data
The term data refers to qualitative or quantitative attributes of a variable or set of variables. Data are typically the results of measurements and can be the basis of graphs, images, or observations of a set of variables. Data are often viewed as the lowest level of abstraction from which...
, or theoretical distributions
Statistical population
A statistical population is a set of entities concerning which statistical inferences are to be drawn, often based on a random sample taken from the population. For example, if we were interested in generalizations about crows, then we would describe the set of crows that is of interest...
. The use of Q-Q plots to compare two samples of data can be viewed as a non-parametric
Non-parametric statistics
In statistics, the term non-parametric statistics has at least two different meanings:The first meaning of non-parametric covers techniques that do not rely on data belonging to any particular distribution. These include, among others:...
approach to comparing their underlying distributions. A Q-Q plot is generally a more powerful approach to doing this than the common technique of comparing histogram
Histogram
In statistics, a histogram is a graphical representation showing a visual impression of the distribution of data. It is an estimate of the probability distribution of a continuous variable and was first introduced by Karl Pearson...
s of the two samples, but requires more skill to interpret. Q-Q plots are commonly used to compare a data set to a theoretical model. This can provide an assessment of "goodness of fit" that is graphical, rather than reducing to a numerical summary. Q-Q plots are also used to compare two theoretical distributions to each other. Since Q-Q plots compare distributions, there is no need for the values to be observed as pairs, as in a scatterplot
Scatterplot
A scatter plot or scattergraph is a type of mathematical diagram using Cartesian coordinates to display values for two variables for a set of data....
, or even for the numbers of values in the two groups being compared to be equal.
The term "probability plot" sometimes refers specifically to a Q-Q plot, sometimes to a more general class of plots, and sometimes to the less commonly used P-P plot. The probability plot correlation coefficient is a quantity derived from the idea of Q-Q plots, which measures the agreement of a fitted distribution with observed data and which is sometimes used as a means of fitting a distribution to data: see later.
Definition and construction
The main step in constructing a Q-Q plot is calculating or estimating the quantiles to be plotted. If one or both of the axes in a Q-Q plot is based on a theoretical distribution with a continuous cumulative distribution function
Cumulative distribution function
In probability theory and statistics, the cumulative distribution function , or just distribution function, describes the probability that a real-valued random variable X with a given probability distribution will be found at a value less than or equal to x. Intuitively, it is the "area so far"...
(CDF), all quantiles are uniquely defined and can be obtained by inverting the CDF. If a theoretical probability distribution with a discontinuous CDF is one of the two distributions being compared, some of the quantiles may not be defined, so an interpolated quantile may be plotted. If the Q-Q plot is based on data, there are multiple quantile estimators in use. Rules for forming Q-Q plots when quantiles must be estimated or interpolated are called plotting positions.
A simple case is where one has two data sets of the same size. In that case, to make the Q-Q plot, one orders each set in increasing order, then pairs off and plots the corresponding values. A more complicated construction is the case where two data sets of different sizes are being compared. To construct the Q-Q plot in this case, it is necessary to use an interpolated
Interpolation
In the mathematical field of numerical analysis, interpolation is a method of constructing new data points within the range of a discrete set of known data points....
quantile estimate so that quantiles corresponding to the same underlying probability can be constructed.
More abstractly, given two cumulative probability distribution functions F and G, with associated quantile function
Quantile function
In probability and statistics, the quantile function of the probability distribution of a random variable specifies, for a given probability, the value which the random variable will be at, or below, with that probability...
s F −1 and G−1 (the inverse function of the CDF is the quantile function), the Q-Q plot draws the qth quantile of F against the qth quantile of G for a range of values of q. Thus, the Q-Q plot is a parametric curve
Parametric equation
In mathematics, parametric equation is a method of defining a relation using parameters. A simple kinematic example is when one uses a time parameter to determine the position, velocity, and other information about a body in motion....
indexed over [0,1] with values in the real plane R2.
Interpretation
The points plotted in a Q-Q plot are always non-decreasing when viewed from left to right. If the two distributions being compared are identical, the Q-Q plot follows the 45° line y = x. If the two distributions agree after linearly transforming the values in one of the distributions, then the Q-Q plot follows some line, but not necessarily the line y = x. If the general trend of the Q-Q plot is flatter than the line y = x, the distribution plotted on the horizontal axis is more dispersedStatistical dispersion
In statistics, statistical dispersion is variability or spread in a variable or a probability distribution...
than the distribution plotted on the vertical axis. Conversely, if the general trend of the Q-Q plot is steeper than the line y = x, the distribution plotted on the vertical axis is more dispersed
Statistical dispersion
In statistics, statistical dispersion is variability or spread in a variable or a probability distribution...
than the distribution plotted on the horizontal axis. Q-Q plots are often arced, or "S" shaped, indicating that one of the distributions is more skewed than the other, or that one of the distributions has heavier tails than the other.
Although a Q-Q plot is based on quantiles, in a standard Q-Q plot it is not possible to determine which point in the Q-Q plot determines a given quantile. For example, it is not possible to determine the median of either of the two distributions being compared by inspecting the Q-Q plot. Some Q-Q plots indicate the deciles to make determinations such as this possible.
The slope and position of a linear regression between the quantiles gives a measure of the relative location and relative scale of the samples. If the median of the distribution plotted on the horizontal axis is 0, the intercept of a regression line is a measure of location, and the slope is a measure of scale. The distance between medians is another measure of relative location reflected in a Q-Q plot. The "probability plot correlation coefficient" is the correlation coefficient between the paired sample quantiles. The closer the correlation coefficient is to one, the closer the distributions are to being shifted, scaled versions of each other. For distributions with a single shape parameter, the probability plot correlation coefficient plot
Probability plot correlation coefficient plot
Many statistical analyses are based on distributional assumptions about the population from which the data have been obtained. However, distributional families can have radically different shapes depending on the value of the shape parameter. Therefore, finding a reasonable choice for the shape...
(PPCC plot) provides a method for estimating the shape parameter – one simply computes the correlation coefficient for different values of the shape parameter, and uses the one with the best fit, just as if one were comparing distributions of different types.
Another common use of Q-Q plots is to compare the distribution of a sample to a theoretical distribution, such as the standard normal distribution N(0,1), as in a normal probability plot
Normal probability plot
The normal probability plot is a graphical technique for normality testing: assessing whether or not a data set is approximately normally distributed....
. As in the case when comparing two samples of data, one orders the data (formally, computes the order statistics), then plots them against certain quantiles of the theoretical distribution.
Plotting positions
The choice of quantiles from a theoretical distribution has occasioned much discussion. A natural choice, given a sample of size n, is k / n for k = 1, ..., n, as these are the quantiles that the sampling distribution realizes. Unfortunately, the last of these, n / n, corresponds to the 100th percentile – the maximum value of the theoretical distribution, which is often infinite. To fix this, one may shift these over, using (k − 0.5) / n, or instead space the points evenly in the uniform distribution, using k / (n + 1). This last has been argued to be the definitive position by some, though other choices have been suggested, both formal and heuristic.Expected value of the order statistic
In using a normal probability plotNormal probability plot
The normal probability plot is a graphical technique for normality testing: assessing whether or not a data set is approximately normally distributed....
, the quantiles one uses are the rankit
Rankit
In statistics, rankits of a set of data are the expected values of the order statistics of a sample from the standard normal distribution the same size as the data. They are primarily used in the normal probability plot, a graphical technique for normality testing.-Example:This is perhaps most...
s, the quantile of the expected value of the order statistic of a standard normal distribution.
More generally, Wilk–Shapiro uses the expected values of the order statistics of the given distribution; the resulting plot and line yields the generalized least squares
Generalized least squares
In statistics, generalized least squares is a technique for estimating the unknown parameters in a linear regression model. The GLS is applied when the variances of the observations are unequal , or when there is a certain degree of correlation between the observations...
estimate for location and scale (from the intercept
Intercept
Intercept may refer to:*X-intercept, the point where a line crosses the x-axis*Y-intercept, the point where a line crosses the y-axis*Interception *The Mona Intercept, a 1980 thriller novel by Donald Hamilton...
and slope
Slope
In mathematics, the slope or gradient of a line describes its steepness, incline, or grade. A higher slope value indicates a steeper incline....
of the fitted line).
Although this is not too important for the normal distribution (the location and scale are estimated by the mean and standard deviation, respectively), it can be useful for many other distributions.
However, this requires calculating the expected values of the order statistic, which may be difficult if the distribution is not normal.
Median of the order statistics
Alternatively, one may use estimates of the medianMedian
In probability theory and statistics, a median is described as the numerical value separating the higher half of a sample, a population, or a probability distribution, from the lower half. The median of a finite list of numbers can be found by arranging all the observations from lowest value to...
of the order statistics, which one can compute based on estimates of the median of the order statistics of a uniform distribution and the quantile function
Quantile function
In probability and statistics, the quantile function of the probability distribution of a random variable specifies, for a given probability, the value which the random variable will be at, or below, with that probability...
of the distribution; this was suggested by .
This can be easily generated for any distribution for which the quantile function
Quantile function
In probability and statistics, the quantile function of the probability distribution of a random variable specifies, for a given probability, the value which the random variable will be at, or below, with that probability...
can be computed, but conversely the resulting estimates of location and scale are no longer precisely the least squares estimates, though these only differ significantly for n small.
Heuristics
For the quantiles of the comparison distribution typically the formula k/(n + 1) is used.Several different formulas have been used or proposed as symmetrical plotting positions. Such formulas have the form (k − a)/(n + 1 − 2a) for some value of a in the range from 0 to 1/2, which gives a range between k/(n + 1) and (k − 1/2)/n.
Other expressions include:
- (k − 0.3) / (n + 0.4).
- (k − 0.3175) / (n + 0.365).
- (k − 0.326) / (n + 0.348).
- (k − ⅓) / (n + ⅓).
- (k − 0.375) / (n + 0.25).
- (k − 0.4) / (n + 0.2).
- (k − 0.44) / (n + 0.12).
- (k − 0.567) / (n − 0.134).
- (k − 1) / (n − 1).
For large sample size, n, there is little difference between these various expressions.
Filliben's estimate
The order statistic medians are the medians of the order statistics of the distribution. These can be expressed in terms of the quantile function and the order statistic medians for the continuous uniform distribution by:where U(i) are the uniform order statistic medians and G is the quantile function
Quantile function
In probability and statistics, the quantile function of the probability distribution of a random variable specifies, for a given probability, the value which the random variable will be at, or below, with that probability...
for the desired distribution. The quantile function is the inverse of the cumulative distribution function
Cumulative distribution function
In probability theory and statistics, the cumulative distribution function , or just distribution function, describes the probability that a real-valued random variable X with a given probability distribution will be found at a value less than or equal to x. Intuitively, it is the "area so far"...
(probability that X is less than or equal to some value). That is, given a probability, we want the corresponding quantile
Quantile
Quantiles are points taken at regular intervals from the cumulative distribution function of a random variable. Dividing ordered data into q essentially equal-sized data subsets is the motivation for q-quantiles; the quantiles are the data values marking the boundaries between consecutive subsets...
of the cumulative distribution function.
James J. Filliben uses the following estimates for the uniform order statistic medians:
The reason for this estimate is that the order statistic medians do not have a simple form.
See also
- ProbitProbitIn probability theory and statistics, the probit function is the inverse cumulative distribution function , or quantile function associated with the standard normal distribution...
analysis was developed by Chester Ittner BlissChester Ittner BlissChester Ittner Bliss was primarily a biologist, who is best known for his contributions to statistics. He was born in Springfield, Ohio in 1899 and died in 1979.-Academic qualifications:*Bachelor of Arts in Entomology from Ohio State University, 1921...
in 1934. - Shapiro–Wilk test
External links
- Probability plot
- Alternate description of the QQ-Plot: http://www.stats.gla.ac.uk/steps/glossary/probability_distributions.html#qqplot