
Robust statistics
Encyclopedia
Robust statistics provides an alternative approach to classical statistical
methods. The motivation is to produce estimator
s that are not unduly affected by small departures from model assumptions.
, classical methods rely heavily on assumptions which are often not met in practice. In particular, it is often assumed that the data errors are normally distributed, at least approximately, or that the central limit theorem
can be relied on to produce normally distributed estimates. Unfortunately, when there are outliers in the data, classical methods often have very poor performance, like standard Kalman filter
s, which are not robust to them.
This can be studied empirically by examining the sampling distribution
of various estimators under a mixture model
, where one mixes in a small amount (1–5% is often sufficient) of contamination. For instance, one may use a mixture of 95% a normal distribution, and 5% a normal distribution with the same mean but significantly higher standard deviation (the errors).
In order to quantify the robustness of a method, it is necessary to define some measures of robustness. Perhaps the most common of these are the breakdown point and the influence function, described below.
Robust parametric statistics
tends to rely on replacing the normal distribution in classical methods with the t-distribution with low degrees of freedom (high kurtosis; degrees of freedom between 4 and 6 have often been found to be useful in practice ) or with a mixture
of two or more distributions.
Trimmed estimator
s and Winsorised estimators
are general methods to make statistics more robust. M-estimators are a general class of robust statistics.
, and reasonably small bias
, as well as being asymptotically unbiased, meaning having a bias tending towards 0 as the sample size tends towards infinity.
One of the most important cases is distributional robustness. Classical statistical procedures are typically sensitive to "longtailedness" (e.g., when the distribution of the data has longer tails than the assumed normal distribution). Thus, in the context of robust statistics, distributionally robust and outlier-resistant are effectively synonymous.
A related topic is that of resistant statistics, which are resistant to the effect of extreme scores.
Although the bulk of the data look to be more or less normally distributed, there are two obvious outliers. These outliers have a large effect on the mean, dragging it towards them, and away from the center of the bulk of the data. Thus, if the mean is intended as a measure of the location of the center of the data, it is, in a sense, biased when outliers are present.
Also, the distribution of the mean is known to be asymptotically normal due to the central limit theorem. However, outliers can make the distribution of the mean non-normal even for fairly large data sets. Besides this non-normality, the mean is also inefficient
in the presence of outliers and less variable measures of location are available.
Panels (c) and (d) of the plot show the bootstrap distribution of the mean (c) and the 10% trimmed mean (d). The trimmed mean is a simple robust estimator of location that deletes a certain percentage of observations (10% here) from each end of the data, then computes the mean in the usual way. The analysis was performed in R
and 10,000 bootstrap
samples were used for each of the raw and trimmed means.
The distribution of the mean is clearly much wider than that of the 10% trimmed mean (the plots are on the same scale). Also note that whereas the distribution of the trimmed mean appears to be close to normal, the distribution of the raw mean is quite skewed to the left. So, in this sample of 66 observations, only 2 outliers cause the central limit theorem to be inapplicable.
Robust statistical methods, of which the trimmed mean is a simple example, seek to outperform classical statistical methods in the presence of outliers, or, more generally, when underlying parametric assumptions are not quite correct.
Whilst the trimmed mean performs well relative to the mean in this example, better robust estimates are available. In fact, the mean, median and trimmed mean are all special cases of M-estimators. Details appear in the sections below.
The plots below show the bootstrap distributions of the standard deviation, median absolute deviation
(MAD) and Qn estimator of scale (Rousseeuw and Croux, 1993). The plots are based on 10000 bootstrap samples for each estimator, with some Gaussian noise added to the resampled data (smoothed bootstrap). Panel (a) shows the distribution of the standard deviation, (b) of the MAD and (c) of Qn.
The distribution of standard deviation is erratic and wide, a result of the outliers. The MAD is better behaved, and Qn is a little bit more efficient than MAD. This simple example demonstrates that when outliers are present, the standard deviation cannot be recommended as an estimate of scale.
Outliers can often interact in such a way that they mask each other. As a simple example, consider a small univariate data set containing one modest and one large outlier. The estimated standard deviation will be grossly inflated by the large outlier. The result is that the modest outlier looks relatively normal. As soon as the large outlier is removed, the estimated standard deviation shrinks, and the modest outlier now looks unusual.
This problem of masking gets worse as the complexity of the data increases. For example, in regression problems, diagnostic plots are used to identify outliers. However, it is common that once a few outliers have been removed, others become visible. The problem is even worse in higher dimensions.
Robust methods provide automatic ways of detecting, downweighting (or removing), and flagging outliers, largely removing the need for manual screening. Care must be taken, initial data showing the ozone hole first appearing over Antarctica were rejected as outliers by non-human screening
is the proportion of incorrect observations (i.e. arbitrarily large observations) an estimator can handle before giving an arbitrarily large result. For example, given independent random variables
  and the corresponding realizations
  , we can use
  to estimate the mean. Such an estimator has a breakdown point of 0 because we can make
  arbitrarily large just by changing any of
  .
.
The higher the breakdown point of an estimator, the more robust it is. Intuitively, we can understand that a breakdown point cannot exceed 50% because if more than half of the observations are contaminated, it is not possible to distinguish between the underlying distribution and the contaminating distribution. Therefore, the maximum breakdown point is 0.5 and there are estimators which achieve such a breakdown point. For example, the median has a breakdown point of 0.5. The X% trimmed mean has breakdown point of X%, for the chosen level of X. Huber (1981) and Maronna et al. (2006) contain more details.
Statistics with high breakdown points are sometimes called resistant statistics.
The 10% trimmed mean for the speed of light data is 27.43. Removing the two lowest observations and recomputing gives 27.67. Clearly, the trimmed mean is less affected by the outliers and has a higher breakdown point.
Notice that if we replace the lowest observation, -44, by -1000, the mean becomes 11.73, whereas the 10% trimmed mean is still 27.43. In many areas of applied statistics, it is common for data to be log-transformed to make them near symmetrical. Very small values become large negative when log-transformed, and zeroes become negatively infinite. Therefore, this example is of practical interest.
 The empirical influence function gives us an idea of how an estimator behaves when we change one point in the sample and relies on the data (i.e. no model assumptions). On the right is Tukey's biweight function, which, as we will later see, is an example of what a "good" (in a sense defined later on) empirical influence function should look like. The context is the following:
For example,
The definition of an empirical influence function is:
Let and
and  are iid and
  is a sample from these variables.
  is an estimator. Let
  . The empirical influence function
  at observation
  is defined by:

What this actually means is that we are replacing the i-th value in the sample by an arbitrary value and looking at the output of the estimator.
This notion of influence function is analogous to other notions of influence function
, such as impulse response
: it measures sensitivity to the value at a point.
Let be a convex subset of the set of all finite signed measures on
  . We want to estimate the parameter
  of a distribution
  in
in  . Let the functional
  be the asymptotic value of some estimator sequence
  . We will suppose that this functional is Fisher consistent
, i.e. . This means that at the model
  , the estimator sequence asymptotically measures the right quantity.
Let be some distribution in
  . What happens when the data doesn't follow the model
  exactly but another, slightly different, "going towards"
  ?
?
We're looking at: ,
,
which is the one-sided
directional derivative
of at
at  , in the direction of
  .
.
Let .
.  is the probability measure which gives mass 1 to
  . We chose
  . The influence function is then defined by:
It describes the effect of an infinitesimal contamination at the point on the estimate we are seeking, standardized by the mass
  of the contamination (the asymptotic bias caused by contamination in the observations). For a robust estimator, we want a bounded influence function, that is, one which does not go to infinity as x becomes arbitrarily large.
This value, which looks a lot like a Lipschitz constant, represents the effect of shifting an observation slightly from to a neighbouring point
  , i.e., add an observation at
  and remove one at
  .
.
Historically, several approaches to robust estimation were proposed, including R-estimators and L-estimators. However, M-estimators now appear to dominate the field as a result of their generality, high breakdown point, and their efficiency. See Huber (1981).
M-estimators are a generalization of maximum likelihood estimators (MLEs). What we try to do with MLE's is to maximize or, equivalently, minimize
  . In 1964, Huber proposed to generalize this to the minimization of
  , where
  is some function. MLE are therefore a special case of M-estimators (hence the name: "Maximum likelihood type" estimators).
Minimizing can often be done by differentiating
  and solving
  , where
  (if
(if  has a derivative).
Several choices of and
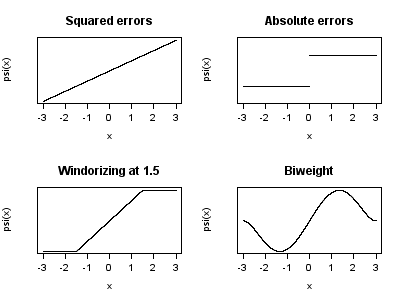
and  have been proposed. The two figures below show four
  functions and their corresponding
  functions.
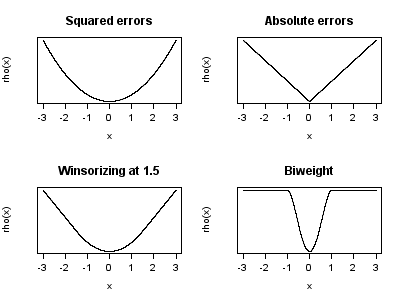
For squared errors, increases at an accelerating rate, whilst for absolute errors, it increases at a constant rate. When Winsorizing is used, a mixture of these two effects is introduced: for small values of x,
  increases at the squared rate, but once the chosen threshold is reached (1.5 in this example), the rate of increase becomes constant. This Winsorised estimator is also known as the Huber loss function
.
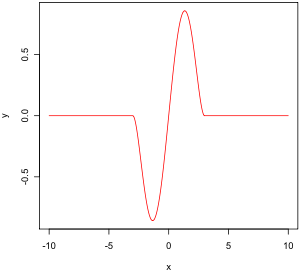
Tukey's biweight (also known as bisquare) function behaves in a similar way to the squared error function at first, but for larger errors, the function tapers off.
It can be shown that M-estimators are asymptotically normally distributed, so that as long as their standard errors can be computed, an approximate approach to inference is available.
Since M-estimators are normal only asymptotically, for small sample sizes it might be appropriate to use an alternative approach to inference, such as the bootstrap. However, M-estimates are not necessarily unique (i.e. there might be more than one solution that satisfies the equations). Also, it is possible that any particular bootstrap sample can contain more outliers than the estimator's breakdown point. Therefore, some care is needed when designing bootstrap schemes.
Of course, as we saw with the speed of light example, the mean is only normally distributed asymptotically and when outliers are present the approximation can be very poor even for quite large samples. However, classical statistical tests, including those based on the mean, are typically bounded above by the nominal size of the test. The same is not true of M-estimators and the type I error rate can be substantially above the nominal level.
These considerations do not "invalidate" M-estimation in any way. They merely make clear that some care is needed in their use, as is true of any other method of estimation.
 is proportional to
  (see Huber, 1981 (and 2004), page 45), which means we can derive the properties of such an estimator (such as its rejection point, gross-error sensitivity or local-shift sensitivity) when we know its
  function.

with the given by:
 .
.
Choice of
In many practical situations, the choice of the  function is not critical to gaining a good robust estimate, and many choices will give similar results that offer great improvements, in terms of efficiency and bias, over classical estimates in the presence of outliers (Huber, 1981).
Theoretically, functions are to be preferred, and Tukey's biweight (also known as bisquare) function is a popular choice. Maronna et al. (2006) recommend the biweight function with efficiency at the normal set to 85%.
For the t-distribution with degrees of freedom, it can be shown that
 .
.
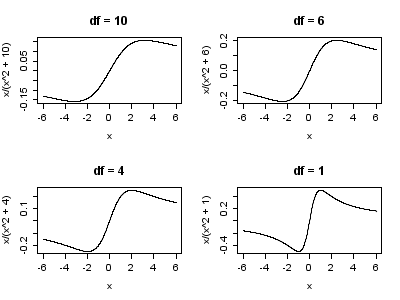
For , the t-distribution is equivalent to the Cauchy distribution. Notice that the degrees of freedom is sometimes known as the kurtosis parameter. It is the parameter that controls how heavy the tails are. In principle,
  can be estimated from the data in the same way as any other parameter. In practice, it is common for there to be multiple local maxima when
  is allowed to vary. As such, it is common to fix
  at a value around 4 or 6. The figure below displays the
  -function for 4 different values of
  .
.

Fixing and maximizing the likelihood gives

based on maximizing expected value
or the expected utility hypothesis
is especially sensitive to assumptions about probabilities of various outcomes, particularly if rare but extreme-valued events are highly influential.
By contrast, criteria like minimax
and minimax regret are less dependent about the assumptions about the probabilities of outcomes; such criteria depend on only evaluating the possible outcomes that have positive propabilities and on their utilities. Scenario analysis
and stress testing
are informal non-probabilistic methods, while info-gap decision theory
is a formal and robust decision-theory. Possibility theory
and Dempster–Shafer theory are other non-probabilistic methods.
Advocates of probabilistic approaches to decision theory argue that in fact all decision rules can be derived or dominated by Bayesian methods, appealing to results such as the complete class theorems, which show that all admissible decision rules are equivalent to a Bayesian decision rule with some prior distribution (possibly improper) and some utility function.
is a function of data, whose underlying population distribution is a member of a parametric family, that is not dependent on the values of the parameters. An ancillary statistic
is such a function that is also a statistic, meaning that it is computed in terms of the data alone. Such functions are robust to parameters in the sense that they are independent of the values of the parameters, but not robust to the model in the sense that they assume an underlying model (parametric family), and in fact such functions are often very sensitive to violations of the model assumptions. Thus test statistic
s, frequently constructed in terms of these to not be sensitive to assumptions about parameters, are still very sensitive to model assumptions.
However, using these types of models to predict missing values or outliers in a long time series is difficult and often unreliable, particularly if the number of values to be in-filled is relatively high in comparison with total record length. The accuracy of the estimate depends on how good and representative the model is and how long the period of missing values extends (Rosen and Lennox, 2001). The in a case of a dynamic process, so any variable is dependent, not just on the historical time series of the same variable but also on several other variables or parameters of the process. In other words, the problem is an exercise in multivariate analysis rather than the univariate approach of most of the traditional methods of estimating missing values and outliers; a multivariate model will therefore be more representative than a univariate one for predicting missing values. The kohonin self organising map (KSOM) offers a simple and robust multivariate model for data analysis, thus providing good possibilities to estimate missing values, taking into account its relationship or correlation with other pertinent variables in the data record (Rustum & Adeloye 2007).
Standard Kalman filter
s are not robust to outliers. To this end Ting, Theodorou and Schaal have recently shown that a modification of Masreliez's theorem can deal with outliers.
.
Statistics
Statistics is the study of the collection, organization, analysis, and interpretation of data. It deals with all aspects of this, including the planning of data collection in terms of the design of surveys and experiments....
methods. The motivation is to produce estimator
Estimator
In statistics, an estimator is a rule for calculating an estimate of a given quantity based on observed data: thus the rule and its result are distinguished....
s that are not unduly affected by small departures from model assumptions.
Introduction
Robust statistics seeks to provide methods that emulate popular statistical methods, but which are not unduly affected by outliers or other small departures from model assumptions. In statisticsStatistics
Statistics is the study of the collection, organization, analysis, and interpretation of data. It deals with all aspects of this, including the planning of data collection in terms of the design of surveys and experiments....
, classical methods rely heavily on assumptions which are often not met in practice. In particular, it is often assumed that the data errors are normally distributed, at least approximately, or that the central limit theorem
Central limit theorem
In probability theory, the central limit theorem states conditions under which the mean of a sufficiently large number of independent random variables, each with finite mean and variance, will be approximately normally distributed. The central limit theorem has a number of variants. In its common...
can be relied on to produce normally distributed estimates. Unfortunately, when there are outliers in the data, classical methods often have very poor performance, like standard Kalman filter
Kalman filter
In statistics, the Kalman filter is a mathematical method named after Rudolf E. Kálmán. Its purpose is to use measurements observed over time, containing noise and other inaccuracies, and produce values that tend to be closer to the true values of the measurements and their associated calculated...
s, which are not robust to them.
This can be studied empirically by examining the sampling distribution
Sampling distribution
In statistics, a sampling distribution or finite-sample distribution is the probability distribution of a given statistic based on a random sample. Sampling distributions are important in statistics because they provide a major simplification on the route to statistical inference...
of various estimators under a mixture model
Mixture model
In statistics, a mixture model is a probabilistic model for representing the presence of sub-populations within an overall population, without requiring that an observed data-set should identify the sub-population to which an individual observation belongs...
, where one mixes in a small amount (1–5% is often sufficient) of contamination. For instance, one may use a mixture of 95% a normal distribution, and 5% a normal distribution with the same mean but significantly higher standard deviation (the errors).
In order to quantify the robustness of a method, it is necessary to define some measures of robustness. Perhaps the most common of these are the breakdown point and the influence function, described below.
Robust parametric statistics
Parametric statistics
Parametric statistics is a branch of statistics that assumes that the data has come from a type of probability distribution and makes inferences about the parameters of the distribution. Most well-known elementary statistical methods are parametric....
tends to rely on replacing the normal distribution in classical methods with the t-distribution with low degrees of freedom (high kurtosis; degrees of freedom between 4 and 6 have often been found to be useful in practice ) or with a mixture
Mixture density
In probability and statistics, a mixture distribution is the probability distribution of a random variable whose values can be interpreted as being derived in a simple way from an underlying set of other random variables. In particular, the final outcome value is selected at random from among the...
of two or more distributions.
Examples of robust and non-robust statistics
- The medianMedianIn probability theory and statistics, a median is described as the numerical value separating the higher half of a sample, a population, or a probability distribution, from the lower half. The median of a finite list of numbers can be found by arranging all the observations from lowest value to...
is a robust measure of central tendencyCentral tendencyIn statistics, the term central tendency relates to the way in which quantitative data is clustered around some value. A measure of central tendency is a way of specifying - central value...
, while the meanArithmetic meanIn mathematics and statistics, the arithmetic mean, often referred to as simply the mean or average when the context is clear, is a method to derive the central tendency of a sample space...
is not; for instance, the median has a breakdown point of 50%, while the mean has a breakdown point of 0% (a single large sample can throw it off). - The median absolute deviationMedian absolute deviationIn statistics, the median absolute deviation is a robust measure of the variability of a univariate sample of quantitative data. It can also refer to the population parameter that is estimated by the MAD calculated from a sample....
and interquartile rangeInterquartile rangeIn descriptive statistics, the interquartile range , also called the midspread or middle fifty, is a measure of statistical dispersion, being equal to the difference between the upper and lower quartiles...
are robust measures of statistical dispersionStatistical dispersionIn statistics, statistical dispersion is variability or spread in a variable or a probability distribution...
, while the standard deviationStandard deviationStandard deviation is a widely used measure of variability or diversity used in statistics and probability theory. It shows how much variation or "dispersion" there is from the average...
and rangeRange (statistics)In the descriptive statistics, the range is the length of the smallest interval which contains all the data. It is calculated by subtracting the smallest observation from the greatest and provides an indication of statistical dispersion.It is measured in the same units as the data...
are not.
Trimmed estimator
Trimmed estimator
Given an estimator, a trimmed estimator is obtained by excluding some of the extreme values. This is generally done to obtain a more robust statistic: the extreme values are considered outliers....
s and Winsorised estimators
Winsorising
Winsorising or Winsorization is the transformation of statistics by limiting extreme values in the statistical data to reduce the effect of possibly spurious outliers. It is named after the engineer-turned-biostatistician Charles P. Winsor...
are general methods to make statistics more robust. M-estimators are a general class of robust statistics.
Definition
There are various definitions of a "robust statistic". Strictly speaking, a robust statistic is resistant to errors in the results, produced by deviations from assumptions (e.g. of normality). This means that if the assumptions are only approximately met, the robust estimator will still have a reasonable efficiencyEfficiency (statistics)
In statistics, an efficient estimator is an estimator that estimates the quantity of interest in some “best possible” manner. The notion of “best possible” relies upon the choice of a particular loss function — the function which quantifies the relative degree of undesirability of estimation errors...
, and reasonably small bias
Bias
Bias is an inclination to present or hold a partial perspective at the expense of alternatives. Bias can come in many forms.-In judgement and decision making:...
, as well as being asymptotically unbiased, meaning having a bias tending towards 0 as the sample size tends towards infinity.
One of the most important cases is distributional robustness. Classical statistical procedures are typically sensitive to "longtailedness" (e.g., when the distribution of the data has longer tails than the assumed normal distribution). Thus, in the context of robust statistics, distributionally robust and outlier-resistant are effectively synonymous.
A related topic is that of resistant statistics, which are resistant to the effect of extreme scores.
Example: speed of light data
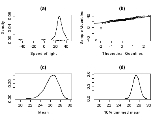
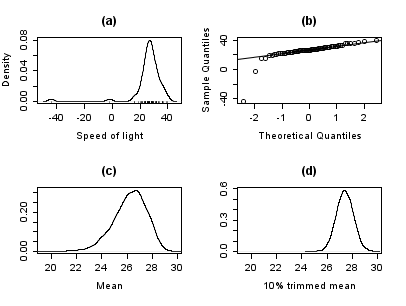
Gelman et al. in Bayesian Data Analysis (2004) consider a data set relating to speed of light measurements made by Simon Newcomb. The data sets for that book can be found via the Classic data sets page, and the book's website contains more information on the data.Although the bulk of the data look to be more or less normally distributed, there are two obvious outliers. These outliers have a large effect on the mean, dragging it towards them, and away from the center of the bulk of the data. Thus, if the mean is intended as a measure of the location of the center of the data, it is, in a sense, biased when outliers are present.
Also, the distribution of the mean is known to be asymptotically normal due to the central limit theorem. However, outliers can make the distribution of the mean non-normal even for fairly large data sets. Besides this non-normality, the mean is also inefficient
Efficiency (statistics)
In statistics, an efficient estimator is an estimator that estimates the quantity of interest in some “best possible” manner. The notion of “best possible” relies upon the choice of a particular loss function — the function which quantifies the relative degree of undesirability of estimation errors...
in the presence of outliers and less variable measures of location are available.
Estimation of location
The plot below shows a density plot of the speed of light data, together with a rug plot (panel (a)). Also shown is a normal QQ-plot (panel (b)). The outliers are clearly visible in these plots.Panels (c) and (d) of the plot show the bootstrap distribution of the mean (c) and the 10% trimmed mean (d). The trimmed mean is a simple robust estimator of location that deletes a certain percentage of observations (10% here) from each end of the data, then computes the mean in the usual way. The analysis was performed in R
R (programming language)
R is a programming language and software environment for statistical computing and graphics. The R language is widely used among statisticians for developing statistical software, and R is widely used for statistical software development and data analysis....
and 10,000 bootstrap
Bootstrapping (statistics)
In statistics, bootstrapping is a computer-based method for assigning measures of accuracy to sample estimates . This technique allows estimation of the sample distribution of almost any statistic using only very simple methods...
samples were used for each of the raw and trimmed means.
The distribution of the mean is clearly much wider than that of the 10% trimmed mean (the plots are on the same scale). Also note that whereas the distribution of the trimmed mean appears to be close to normal, the distribution of the raw mean is quite skewed to the left. So, in this sample of 66 observations, only 2 outliers cause the central limit theorem to be inapplicable.
Robust statistical methods, of which the trimmed mean is a simple example, seek to outperform classical statistical methods in the presence of outliers, or, more generally, when underlying parametric assumptions are not quite correct.
Whilst the trimmed mean performs well relative to the mean in this example, better robust estimates are available. In fact, the mean, median and trimmed mean are all special cases of M-estimators. Details appear in the sections below.
Estimation of scale
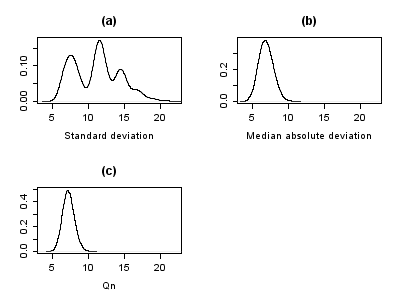
The outliers in the speed of light data have more than just an adverse effect on the mean; the usual estimate of scale is the standard deviation, and this quantity is even more badly affected by outliers because the squares of the deviations from the mean go into the calculation, so the outliers' effects are exacerbated.The plots below show the bootstrap distributions of the standard deviation, median absolute deviation
Median absolute deviation
In statistics, the median absolute deviation is a robust measure of the variability of a univariate sample of quantitative data. It can also refer to the population parameter that is estimated by the MAD calculated from a sample....
(MAD) and Qn estimator of scale (Rousseeuw and Croux, 1993). The plots are based on 10000 bootstrap samples for each estimator, with some Gaussian noise added to the resampled data (smoothed bootstrap). Panel (a) shows the distribution of the standard deviation, (b) of the MAD and (c) of Qn.
The distribution of standard deviation is erratic and wide, a result of the outliers. The MAD is better behaved, and Qn is a little bit more efficient than MAD. This simple example demonstrates that when outliers are present, the standard deviation cannot be recommended as an estimate of scale.
Manual screening for outliers
Traditionally, statisticians would manually screen data for outliers, and remove them, usually checking the source of the data to see if the outliers were erroneously recorded. Indeed, in the speed of light example above, it is easy to see and remove the two outliers prior to proceeding with any further analysis. However, in modern times, data sets often consist of large numbers of variables being measured on large numbers of experimental units. Therefore, manual screening for outliers is often impractical.Outliers can often interact in such a way that they mask each other. As a simple example, consider a small univariate data set containing one modest and one large outlier. The estimated standard deviation will be grossly inflated by the large outlier. The result is that the modest outlier looks relatively normal. As soon as the large outlier is removed, the estimated standard deviation shrinks, and the modest outlier now looks unusual.
This problem of masking gets worse as the complexity of the data increases. For example, in regression problems, diagnostic plots are used to identify outliers. However, it is common that once a few outliers have been removed, others become visible. The problem is even worse in higher dimensions.
Robust methods provide automatic ways of detecting, downweighting (or removing), and flagging outliers, largely removing the need for manual screening. Care must be taken, initial data showing the ozone hole first appearing over Antarctica were rejected as outliers by non-human screening
Variety of applications
Although this article deals with general principles for univariate statistical methods, robust methods also exist for regression problems, generalized linear models, and parameter estimation of various distributions.Measures of robustness
The basic tools used to describe and measure robustness are, the breakdown point, the influence function and the sensitivity curve.Breakdown point
Intuitively, the breakdown point of an estimatorEstimator
In statistics, an estimator is a rule for calculating an estimate of a given quantity based on observed data: thus the rule and its result are distinguished....
is the proportion of incorrect observations (i.e. arbitrarily large observations) an estimator can handle before giving an arbitrarily large result. For example, given
independent random variables and the corresponding realizations , we can use to estimate the mean. Such an estimator has a breakdown point of 0 because we can make arbitrarily large just by changing any of .The higher the breakdown point of an estimator, the more robust it is. Intuitively, we can understand that a breakdown point cannot exceed 50% because if more than half of the observations are contaminated, it is not possible to distinguish between the underlying distribution and the contaminating distribution. Therefore, the maximum breakdown point is 0.5 and there are estimators which achieve such a breakdown point. For example, the median has a breakdown point of 0.5. The X% trimmed mean has breakdown point of X%, for the chosen level of X. Huber (1981) and Maronna et al. (2006) contain more details.
Statistics with high breakdown points are sometimes called resistant statistics.
Example: speed of light data
In the speed of light example, removing the two lowest observations causes the mean to change from 26.2 to 27.75, a change of 1.55. The estimate of scale produced by the Qn method is 6.3. Intuitively, we can divide this by the square root of the sample size to get a robust standard error, and we find this quantity to be 0.78. Thus, the change in the mean resulting from removing two outliers is approximately twice the robust standard error.The 10% trimmed mean for the speed of light data is 27.43. Removing the two lowest observations and recomputing gives 27.67. Clearly, the trimmed mean is less affected by the outliers and has a higher breakdown point.
Notice that if we replace the lowest observation, -44, by -1000, the mean becomes 11.73, whereas the 10% trimmed mean is still 27.43. In many areas of applied statistics, it is common for data to be log-transformed to make them near symmetrical. Very small values become large negative when log-transformed, and zeroes become negatively infinite. Therefore, this example is of practical interest.
Empirical influence function
 is a probability space,
 is a measure space (state space),
 is a parameter spaceParameter spaceIn science, a parameter space is the set of values of parameters encountered in a particular mathematical model. Often the parameters are inputs of a function, in which case the technical term for the parameter space is domain of a function....
of dimension ,
, is a measure space,
 is a projection,
 is the set of all possible distributions on
For example,
 is any probability space,
 ,
,
 ,
, is defined by
  .
.
The definition of an empirical influence function is:
Let
and are iid and is a sample from these variables. is an estimator. Let . The empirical influence function at observation is defined by:What this actually means is that we are replacing the i-th value in the sample by an arbitrary value and looking at the output of the estimator.
This notion of influence function is analogous to other notions of influence function
Influence function
In mathematics, influence function is used to mean either:* a synonym for a Green's function;* Influence function , the effect on an estimator of changing one point of the sample....
, such as impulse response
Impulse response
In signal processing, the impulse response, or impulse response function , of a dynamic system is its output when presented with a brief input signal, called an impulse. More generally, an impulse response refers to the reaction of any dynamic system in response to some external change...
: it measures sensitivity to the value at a point.
Influence function and sensitivity curve
Instead of relying solely on the data, we could use the distribution of the random variables. The approach is quite different from that of the previous paragraph. What we are now trying to do is to see what happens to an estimator when we change the distribution of the data slightly: it assumes a distribution, and measures sensitivity to change in this distribution. By contrast, the empirical influence assumes a sample set, and measures sensitivity to change in the samples.Let
be a convex subset of the set of all finite signed measures on . We want to estimate the parameter of a distribution in . Let the functional be the asymptotic value of some estimator sequence . We will suppose that this functional is Fisher consistentFisher consistency
In statistics, Fisher consistency, named after Ronald Fisher, is a desirable property of an estimator asserting that if the estimator were calculated using the entire population rather than a sample, the true value of the estimated parameter would be obtained...
, i.e.
. This means that at the model , the estimator sequence asymptotically measures the right quantity.Let
be some distribution in . What happens when the data doesn't follow the model exactly but another, slightly different, "going towards" ?We're looking at:
,which is the one-sided
One-sided limit
In calculus, a one-sided limit is either of the two limits of a function f of a real variable x as x approaches a specified point either from below or from above...
directional derivative
Gâteaux derivative
In mathematics, the Gâteaux differential or Gâteaux derivative is a generalization of the concept of directional derivative in differential calculus. Named after René Gâteaux, a French mathematician who died young in World War I, it is defined for functions between locally convex topological vector...
of
at , in the direction of .Let
. is the probability measure which gives mass 1 to . We chose . The influence function is then defined by:It describes the effect of an infinitesimal contamination at the point
on the estimate we are seeking, standardized by the mass of the contamination (the asymptotic bias caused by contamination in the observations). For a robust estimator, we want a bounded influence function, that is, one which does not go to infinity as x becomes arbitrarily large.Desirable properties
Properties of an influence function which bestow it with desirable performance are:- Finite rejection point
 ,
, - Small gross-error sensitivity
 ,
, - Small local-shift sensitivity
 .
.
Local-shift sensitivity
This value, which looks a lot like a Lipschitz constant, represents the effect of shifting an observation slightly from
to a neighbouring point , i.e., add an observation at and remove one at .M-estimators
(The mathematical context of this paragraph is given in the section on empirical influence functions.)Historically, several approaches to robust estimation were proposed, including R-estimators and L-estimators. However, M-estimators now appear to dominate the field as a result of their generality, high breakdown point, and their efficiency. See Huber (1981).
M-estimators are a generalization of maximum likelihood estimators (MLEs). What we try to do with MLE's is to maximize
or, equivalently, minimize . In 1964, Huber proposed to generalize this to the minimization of , where is some function. MLE are therefore a special case of M-estimators (hence the name: "Maximum likelihood type" estimators).Minimizing
can often be done by differentiating and solving , where (if has a derivative).Several choices of
and have been proposed. The two figures below show four functions and their corresponding functions.For squared errors,
increases at an accelerating rate, whilst for absolute errors, it increases at a constant rate. When Winsorizing is used, a mixture of these two effects is introduced: for small values of x, increases at the squared rate, but once the chosen threshold is reached (1.5 in this example), the rate of increase becomes constant. This Winsorised estimator is also known as the Huber loss functionHuber Loss Function
In statistical theory, the Huber loss function is a function used in robust estimation that allows construction of an estimate which allows the effect of outliers to be reduced, while treating non-outliers in a more standard way.-Definition:...
.
Tukey's biweight (also known as bisquare) function behaves in a similar way to the squared error function at first, but for larger errors, the function tapers off.
Properties of M-estimators
Notice that M-estimators do not necessarily relate to a probability density function. Therefore, off-the-shelf approaches to inference that arise from likelihood theory can not, in general, be used.It can be shown that M-estimators are asymptotically normally distributed, so that as long as their standard errors can be computed, an approximate approach to inference is available.
Since M-estimators are normal only asymptotically, for small sample sizes it might be appropriate to use an alternative approach to inference, such as the bootstrap. However, M-estimates are not necessarily unique (i.e. there might be more than one solution that satisfies the equations). Also, it is possible that any particular bootstrap sample can contain more outliers than the estimator's breakdown point. Therefore, some care is needed when designing bootstrap schemes.
Of course, as we saw with the speed of light example, the mean is only normally distributed asymptotically and when outliers are present the approximation can be very poor even for quite large samples. However, classical statistical tests, including those based on the mean, are typically bounded above by the nominal size of the test. The same is not true of M-estimators and the type I error rate can be substantially above the nominal level.
These considerations do not "invalidate" M-estimation in any way. They merely make clear that some care is needed in their use, as is true of any other method of estimation.
Influence function of an M-estimator
It can be shown that the influence function of an M-estimator is proportional to (see Huber, 1981 (and 2004), page 45), which means we can derive the properties of such an estimator (such as its rejection point, gross-error sensitivity or local-shift sensitivity) when we know its function.with the
given by:. Choice of  and
and 
In many practical situations, the choice of the function is not critical to gaining a good robust estimate, and many choices will give similar results that offer great improvements, in terms of efficiency and bias, over classical estimates in the presence of outliers (Huber, 1981).Theoretically,
functions are to be preferred, and Tukey's biweight (also known as bisquare) function is a popular choice. Maronna et al. (2006) recommend the biweight function with efficiency at the normal set to 85%.Robust parametric approaches
M-estimators do not necessarily relate to a density function and so are not fully parametric. Fully parametric approaches to robust modeling and inference, both Bayesian and likelihood approaches, usually deal with heavy tailed distributions such as Student's t-distribution.For the t-distribution with
degrees of freedom, it can be shown that.For
, the t-distribution is equivalent to the Cauchy distribution. Notice that the degrees of freedom is sometimes known as the kurtosis parameter. It is the parameter that controls how heavy the tails are. In principle, can be estimated from the data in the same way as any other parameter. In practice, it is common for there to be multiple local maxima when is allowed to vary. As such, it is common to fix at a value around 4 or 6. The figure below displays the -function for 4 different values of .Example: speed of light data
For the speed of light data, allowing the kurtosis parameter to vary and maximizing the likelihood, we getFixing
and maximizing the likelihood givesRobust decision theory
Decision theoryDecision theory
Decision theory in economics, psychology, philosophy, mathematics, and statistics is concerned with identifying the values, uncertainties and other issues relevant in a given decision, its rationality, and the resulting optimal decision...
based on maximizing expected value
Expected value
In probability theory, the expected value of a random variable is the weighted average of all possible values that this random variable can take on...
or the expected utility hypothesis
Expected utility hypothesis
In economics, game theory, and decision theory the expected utility hypothesis is a theory of utility in which "betting preferences" of people with regard to uncertain outcomes are represented by a function of the payouts , the probabilities of occurrence, risk aversion, and the different utility...
is especially sensitive to assumptions about probabilities of various outcomes, particularly if rare but extreme-valued events are highly influential.
By contrast, criteria like minimax
Minimax
Minimax is a decision rule used in decision theory, game theory, statistics and philosophy for minimizing the possible loss for a worst case scenario. Alternatively, it can be thought of as maximizing the minimum gain...
and minimax regret are less dependent about the assumptions about the probabilities of outcomes; such criteria depend on only evaluating the possible outcomes that have positive propabilities and on their utilities. Scenario analysis
Scenario analysis
Scenario analysis is a process of analyzing possible future events by considering alternative possible outcomes . Thus, the scenario analysis, which is a main method of projections, does not try to show one exact picture of the future. Instead, it presents consciously several alternative future...
and stress testing
Stress testing
Stress testing is a form of testing that is used to determine the stability of a given system or entity. It involves testing beyond normal operational capacity, often to a breaking point, in order to observe the results...
are informal non-probabilistic methods, while info-gap decision theory
Info-gap decision theory
Info-gap decision theory is a non-probabilistic decision theory that seeks to optimize robustness to failure – or opportuneness for windfall – under severe uncertainty, in particular applying sensitivity analysis of the stability radius type to perturbations in the value of a given estimate of the...
is a formal and robust decision-theory. Possibility theory
Possibility theory
Possibility theory is a mathematical theory for dealing with certain types of uncertainty and is an alternative to probability theory. Professor Lotfi Zadeh first introduced possibility theory in 1978 as an extension of his theory of fuzzy sets and fuzzy logic. D. Dubois and H. Prade further...
and Dempster–Shafer theory are other non-probabilistic methods.
Advocates of probabilistic approaches to decision theory argue that in fact all decision rules can be derived or dominated by Bayesian methods, appealing to results such as the complete class theorems, which show that all admissible decision rules are equivalent to a Bayesian decision rule with some prior distribution (possibly improper) and some utility function.
Related concepts
A pivotal quantityPivotal quantity
In statistics, a pivotal quantity or pivot is a function of observations and unobservable parameters whose probability distribution does not depend on unknown parameters....
is a function of data, whose underlying population distribution is a member of a parametric family, that is not dependent on the values of the parameters. An ancillary statistic
Ancillary statistic
In statistics, an ancillary statistic is a statistic whose sampling distribution does not depend on which of the probability distributions among those being considered is the distribution of the statistical population from which the data were taken...
is such a function that is also a statistic, meaning that it is computed in terms of the data alone. Such functions are robust to parameters in the sense that they are independent of the values of the parameters, but not robust to the model in the sense that they assume an underlying model (parametric family), and in fact such functions are often very sensitive to violations of the model assumptions. Thus test statistic
Test statistic
In statistical hypothesis testing, a hypothesis test is typically specified in terms of a test statistic, which is a function of the sample; it is considered as a numerical summary of a set of data that...
s, frequently constructed in terms of these to not be sensitive to assumptions about parameters, are still very sensitive to model assumptions.
Replacing outliers and missing values
If there are relatively few missing points, there are some models which can be used to estimate values to complete the series, such as replacing missing values with the mean or median of the data. Simple linear regression can also be used to estimate missing values (MacDonald and Zucchini, 1997; Harvey, 1989). In addition, outliers can sometimes be accommodated in the data through the use of trimmed means, other scale estimators apart from standard deviation (e.g. MAD) and Winsorization (McBean and Rovers, 1998). In calculations of a trimmed mean, a fixed percentage of data is dropped from each end of an ordered data, thus eliminating the outliers. The mean is then calculated using the remaining data. Windsorization involves accommodating an outlier by replacing it with the next highest or next smallest value as appropriate (Rustum & Adeloye, 2007).However, using these types of models to predict missing values or outliers in a long time series is difficult and often unreliable, particularly if the number of values to be in-filled is relatively high in comparison with total record length. The accuracy of the estimate depends on how good and representative the model is and how long the period of missing values extends (Rosen and Lennox, 2001). The in a case of a dynamic process, so any variable is dependent, not just on the historical time series of the same variable but also on several other variables or parameters of the process. In other words, the problem is an exercise in multivariate analysis rather than the univariate approach of most of the traditional methods of estimating missing values and outliers; a multivariate model will therefore be more representative than a univariate one for predicting missing values. The kohonin self organising map (KSOM) offers a simple and robust multivariate model for data analysis, thus providing good possibilities to estimate missing values, taking into account its relationship or correlation with other pertinent variables in the data record (Rustum & Adeloye 2007).
Standard Kalman filter
Kalman filter
In statistics, the Kalman filter is a mathematical method named after Rudolf E. Kálmán. Its purpose is to use measurements observed over time, containing noise and other inaccuracies, and produce values that tend to be closer to the true values of the measurements and their associated calculated...
s are not robust to outliers. To this end Ting, Theodorou and Schaal have recently shown that a modification of Masreliez's theorem can deal with outliers.
Key contributors
Key contributors to the field of robust statistics include Frank Hampel, Peter J. Huber, R. Douglas Martin and John TukeyJohn Tukey
John Wilder Tukey ForMemRS was an American statistician.- Biography :Tukey was born in New Bedford, Massachusetts in 1915, and obtained a B.A. in 1936 and M.Sc. in 1937, in chemistry, from Brown University, before moving to Princeton University where he received a Ph.D...
.
See also
- L-estimator
- M-estimatorM-estimatorIn statistics, M-estimators are a broad class of estimators, which are obtained as the minima of sums of functions of the data. Least-squares estimators and many maximum-likelihood estimators are M-estimators. The definition of M-estimators was motivated by robust statistics, which contributed new...
- Robust confidence intervalsRobust confidence intervalsIn statistics a robust confidence interval is a robust modification of confidence intervals, meaning that one modifies the non-robust calculations of the confidence interval so that they are not badly affected by outlying or aberrant observations in a data-set.- Example :In the process of weighing...
- Robust regressionRobust regressionIn robust statistics, robust regression is a form of regression analysis designed to circumvent some limitations of traditional parametric and non-parametric methods. Regression analysis seeks to find the effect of one or more independent variables upon a dependent variable...
- WinsorisingWinsorisingWinsorising or Winsorization is the transformation of statistics by limiting extreme values in the statistical data to reduce the effect of possibly spurious outliers. It is named after the engineer-turned-biostatistician Charles P. Winsor...
External links
- Brian Ripley'sBrian D. RipleyBrian David Ripley is a renowned British statistician. Since 1990, he has been professor of applied statistics at the University of Oxford and is also a professorial fellow at St Peter's College....
robust statistics course notes. - Nick Fieller's course notes on Statistical Modelling and Computation contain material on robust regression.
- David Olive's site contains course notes on robust statistics and some data sets.
- Online experiments using R and JSXGraph