

Bootstrapping (statistics)
Encyclopedia
In statistics
, bootstrapping is a computer-based method for assigning measures of accuracy to sample estimates (Efron
and Tibshirani
1994). This technique allows estimation of the sample distribution of almost any statistic using only very simple methods (Varian 2005). Generally, it falls in the broader class of resampling
methods.
Bootstrapping is the practice of estimating properties of an estimator
(such as its variance) by measuring those properties when sampling from an approximating distribution. One standard choice for an approximating distribution is the empirical distribution of the observed data. In the case where a set of observations can be assumed to be from an independent and identically distributed population, this can be implemented by constructing a number of resamples
of the observed dataset (and of equal size to the observed dataset), each of which is obtained by random sampling with replacement from the original dataset.
It may also be used for constructing hypothesis tests
. It is often used as an alternative to inference based on parametric assumptions when those assumptions are in doubt, or where parametric inference is impossible or requires very complicated formulas for the calculation of standard errors.
and confidence intervals for complex estimators of complex parameters of the distribution, such as percentile points, proportions, odds ratio, and correlation coefficients. Moreover, it is an appropriate way to control and check the stability of the results.
of the population from which the sample was taken. For instance, a sample of observations with two peaks in its histogram
would not be well approximated by a Gaussian or normal bell curve, which has only one peak. Therefore, instead of assuming a mathematical shape (like the normal curve or some other) for the population, we instead use the shape of the sample.
As an example, assume we are interested in the average (or mean
) height of people worldwide. We cannot measure all the people in the global population, so instead we sample only a tiny part of it, and measure that. Assume the sample is of size N; that is, we measure the heights of N individuals. From that single sample, only one value of the mean can be obtained. In order to reason about the population, we need some sense of the variability
of the mean that we have computed.
To use the simplest bootstrap technique, we take our original data set of N heights, and, using a computer, make a new sample (called a bootstrap sample) that is also of size N. This new sample is taken from the original using sampling with replacement
so it is not identical with the original "real" sample. We repeat this a lot (maybe 1000 or 10,000 times), and for each of these bootstrap samples we compute its mean (each of these are called bootstrap estimates). We now have a histogram of bootstrap means. This provides an estimate of the shape of the distribution of the mean from which we can answer questions about how much the mean varies. (The method here, described for the mean, can be applied to almost any other statistic
or estimator
.)
The key principle of the bootstrap is to provide a way to simulate repeated observations from an unknown population using the obtained sample as a basis.
For regression problems, various other alternatives are available.
to estimate the distribution of the sample mean, .
.
Instead, we use bootstrap, specifically case resampling, to derive the distribution of . We first resample the data to obtain a bootstrap resample. An example of the first resample might look like this . Note that there are some duplicates since a bootstrap resample comes from sampling with replacement from the data. Note also that the number of data points in a bootstrap resample is equal to the number of data points in our original observations. Then we compute the mean of this resample and obtain the first bootstrap mean: μ1*. We repeat this process to obtain the second resample X2* and compute the second bootstrap mean μ2*. If we repeat this 100 times, then we have μ1*, μ2*, …, μ100*. This represents an empirical bootstrap distribution of sample mean. From this empirical distribution, one can derive a bootstrap confidence interval for the purpose of hypothesis testing.
. For regression problems, so long as the data set is fairly large, this simple scheme is often acceptable. However, the method is open to criticism.
In regression problems, the explanatory variables are often fixed, or at least observed with more control than the response variable. Also, the range of the explanatory variables defines the information available from them. Therefore, to resample cases means that each bootstrap sample will lose some information. As such, alternative bootstrap procedures should be considered.
, and samples of random number
s are drawn from this fitted model. Usually the sample drawn has the same sample size as the original data. Then the quantity, or estimate, of interest is calculated from these data. This sampling process is repeated many times as for other bootstrap methods. The use of a parametric model at the sampling stage of the bootstrap methodology leads to procedures which are different from those obtained by applying basic statistical theory to inference for the same model.
s. The method proceeds as follows.
This scheme has the advantage that it retains the information in the explanatory variables. However, a question arises as to which residuals to resample. Raw residuals are one option; another is studentized residuals (in linear regression). Whilst there are arguments in favour of using studentized residuals; in practice, it often makes little difference and it is easy to run both schemes and compare the results against each other.
but are here used to construct a parametric bootstrap approach, which implicitly allows the time-dependence of the data to be taken into account.
The results will be different, and simulation results suggest that the second approach is better. The approach may derive partly from the standard parametric approach for Normal distributions, but is rather more general. The idea is to try to make use of a pivotal quantity
, or to find a derived statistic that is approximately pivotal. See also ancillary statistic
.
because it does not require the normality assumption to be met, and because it can be effectively utilized with smaller sample sizes (N < 20). However, mediation continues to be (perhaps inappropriately) most frequently determined using (1) the logic of Baron and Kenny or (2) the Sobel test: see mediation
.
page.
The data set contains two obvious outliers so that, as an estimate of location, the median is to be preferred over the mean. Bootstrapping is a method often employed for estimating confidence intervals for medians. However, the median is a discrete statistic, and this fact shows up in the bootstrap distribution.
In order to smooth over the discreteness of the median, we can add a small amount of N(0, σ2) random noise to each bootstrap sample. We choose for sample size n.
Histograms of the bootstrap distribution and the smooth bootstrap distribution appear below. The bootstrap distribution is very jagged because there are only a small number of values that the median can take. The smoothed bootstrap distribution overcomes this jaggedness.
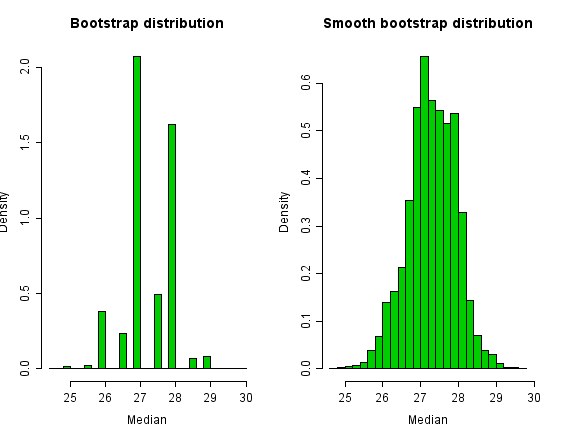
Although the bootstrap distribution of the median looks ugly and intuitively wrong, confidence intervals from it are not bad in this example. The simple 95% percentile interval is (26, 28.5) for the simple bootstrap and (25.98, 28.46) for the smoothed bootstrap.
For more details see bootstrap resampling.
Bootstrap aggregating
(bagging) is a meta-algorithm based on averaging the results of multiple bootstrap samples.
. The sample mean and sample variance are of this form, for r=1 and r=2.
Statistics
Statistics is the study of the collection, organization, analysis, and interpretation of data. It deals with all aspects of this, including the planning of data collection in terms of the design of surveys and experiments....
, bootstrapping is a computer-based method for assigning measures of accuracy to sample estimates (Efron
Bradley Efron
Bradley Efron is an American statistician best known for proposing the bootstrap resampling technique, which has had a major impact in the field of statistics and virtually every area of statistical application...
and Tibshirani
Robert Tibshirani
Robert Tibshirani is a Professor in the Departments of Statistics and Health Research and Policy at Stanford University. He was a Professor at the University of Toronto from 1985 to 1998. In his work, he develops statistical tools for the analysis of complex datasets, most recently in genomics and...
1994). This technique allows estimation of the sample distribution of almost any statistic using only very simple methods (Varian 2005). Generally, it falls in the broader class of resampling
Resampling (statistics)
In statistics, resampling is any of a variety of methods for doing one of the following:# Estimating the precision of sample statistics by using subsets of available data or drawing randomly with replacement from a set of data points # Exchanging labels on data points when performing significance...
methods.
Bootstrapping is the practice of estimating properties of an estimator
Estimator
In statistics, an estimator is a rule for calculating an estimate of a given quantity based on observed data: thus the rule and its result are distinguished....
(such as its variance) by measuring those properties when sampling from an approximating distribution. One standard choice for an approximating distribution is the empirical distribution of the observed data. In the case where a set of observations can be assumed to be from an independent and identically distributed population, this can be implemented by constructing a number of resamples
Resampling (statistics)
In statistics, resampling is any of a variety of methods for doing one of the following:# Estimating the precision of sample statistics by using subsets of available data or drawing randomly with replacement from a set of data points # Exchanging labels on data points when performing significance...
of the observed dataset (and of equal size to the observed dataset), each of which is obtained by random sampling with replacement from the original dataset.
It may also be used for constructing hypothesis tests
Statistical hypothesis testing
A statistical hypothesis test is a method of making decisions using data, whether from a controlled experiment or an observational study . In statistics, a result is called statistically significant if it is unlikely to have occurred by chance alone, according to a pre-determined threshold...
. It is often used as an alternative to inference based on parametric assumptions when those assumptions are in doubt, or where parametric inference is impossible or requires very complicated formulas for the calculation of standard errors.
Advantages
A great advantage of bootstrap is its simplicity. It is straightforward to derive estimates of standard errorsStandard error (statistics)
The standard error is the standard deviation of the sampling distribution of a statistic. The term may also be used to refer to an estimate of that standard deviation, derived from a particular sample used to compute the estimate....
and confidence intervals for complex estimators of complex parameters of the distribution, such as percentile points, proportions, odds ratio, and correlation coefficients. Moreover, it is an appropriate way to control and check the stability of the results.
Disadvantages
Although bootstrapping is (under some conditions) asymptotically consistent, it does not provide general finite-sample guarantees. Furthermore, it has a tendency to be overly optimistic. The apparent simplicity may conceal the fact that important assumptions are being made when undertaking the bootstrap analysis (e.g. independence of samples) where these would be more formally stated in other approaches.Informal description
The basic idea of bootstrapping is that the sample we have collected is often the best guess we have as to the shapeShape of the distribution
In statistics, the concept of the shape of the distribution refers to the shape of a probability distribution and it most often arises in questions of finding an appropriate distribution to use to model the statistical properties of a population, given a sample from that population...
of the population from which the sample was taken. For instance, a sample of observations with two peaks in its histogram
Histogram
In statistics, a histogram is a graphical representation showing a visual impression of the distribution of data. It is an estimate of the probability distribution of a continuous variable and was first introduced by Karl Pearson...
would not be well approximated by a Gaussian or normal bell curve, which has only one peak. Therefore, instead of assuming a mathematical shape (like the normal curve or some other) for the population, we instead use the shape of the sample.
As an example, assume we are interested in the average (or mean
Mean
In statistics, mean has two related meanings:* the arithmetic mean .* the expected value of a random variable, which is also called the population mean....
) height of people worldwide. We cannot measure all the people in the global population, so instead we sample only a tiny part of it, and measure that. Assume the sample is of size N; that is, we measure the heights of N individuals. From that single sample, only one value of the mean can be obtained. In order to reason about the population, we need some sense of the variability
Statistical dispersion
In statistics, statistical dispersion is variability or spread in a variable or a probability distribution...
of the mean that we have computed.
To use the simplest bootstrap technique, we take our original data set of N heights, and, using a computer, make a new sample (called a bootstrap sample) that is also of size N. This new sample is taken from the original using sampling with replacement
Simple random sample
In statistics, a simple random sample is a subset of individuals chosen from a larger set . Each individual is chosen randomly and entirely by chance, such that each individual has the same probability of being chosen at any stage during the sampling process, and each subset of k individuals has...
so it is not identical with the original "real" sample. We repeat this a lot (maybe 1000 or 10,000 times), and for each of these bootstrap samples we compute its mean (each of these are called bootstrap estimates). We now have a histogram of bootstrap means. This provides an estimate of the shape of the distribution of the mean from which we can answer questions about how much the mean varies. (The method here, described for the mean, can be applied to almost any other statistic
Statistic
A statistic is a single measure of some attribute of a sample . It is calculated by applying a function to the values of the items comprising the sample which are known together as a set of data.More formally, statistical theory defines a statistic as a function of a sample where the function...
or estimator
Estimator
In statistics, an estimator is a rule for calculating an estimate of a given quantity based on observed data: thus the rule and its result are distinguished....
.)
The key principle of the bootstrap is to provide a way to simulate repeated observations from an unknown population using the obtained sample as a basis.
Situations where "Bootstrapping procedures" are useful
Adèr et al.(2008) recommend the bootstrap procedure for the following situations:- When the theoretical distribution of a statistic of interest is complicated or unknown. Since the bootstrapping procedure is distribution-independent it provides an indirect method to assess the properties of the distribution underlying the sample and the parameters of interest that are derived from this distribution.
- When the sample sizeSample sizeSample size determination is the act of choosing the number of observations to include in a statistical sample. The sample size is an important feature of any empirical study in which the goal is to make inferences about a population from a sample...
is insufficient for straightforward statistical inference. If the underlying distribution is well-known, bootstrapping provides a way to account for the distortions caused by the specific sample that may not be fully representative of the population.
- When power calculationsStatistical powerThe power of a statistical test is the probability that the test will reject the null hypothesis when the null hypothesis is actually false . The power is in general a function of the possible distributions, often determined by a parameter, under the alternative hypothesis...
have to be performed, and a small pilot sample is available. Most power and sample size calculations are heavily dependent on the standard deviation of the statistic of interest. If the estimate used is incorrect, the required sample size will also be wrong. One method to get an impression of the variation of the statistic is to use a small pilot sample and perform bootstrapping on it to get impression of the variance.
Recommendation
The number of bootstrap samples recommended in literature has increased as available computing power has increased. If the results really matter, as many samples as is reasonable given available computing power and time should be used. Increasing the number of samples cannot increase the amount of information in the original data, it can only reduce the effects of random sampling errors which can arise from a bootstrap procedure itself.Types of bootstrap scheme
In univariate problems, it is usually acceptable to resample the individual observations with replacement ("case resampling" below). In small samples, a parametric bootstrap approach might be preferred. For other problems, a smooth bootstrap will likely be preferred.For regression problems, various other alternatives are available.
Case resampling
Bootstrap is generally useful for estimating the distribution of a statistic (e.g. mean, variance) without using normal theory (e.g. z-statistic, t-statistic). Bootstrap comes in handy when there is no analytical form or normal theory to help estimate the distribution of the statistics of interest, since bootstrap method can apply to most random quantities, e.g., the ratio of variance and mean. There are at least two ways of performing case resampling.- The Monte Carlo algorithm for case resampling is quite simple. First, we resample the data with replacement, and the size of the resample must be equal to the size of the original data set. Then the statistic of interest is computed from the resample from the first step. We repeat this routine many times to get a more precise estimate of the Bootstrap distribution of the statistic.
- The 'exact' version for case resampling is similar, but we exhaustively enumerate every possible resample of the data set. This can be computationally expensive as there are a total of
 different resamples, where n is the size of the data set.
Estimating the distribution of sample mean
Consider a coin-flipping experiment. We flip the coin and record whether it lands heads or tails. (Assume for simplicity that there are only two outcomes) Let be 10 observations from the experiment. if the i th flip lands heads, and 0 otherwise. From normal theory, we can use t-statisticStudent's t-statistic
In statistics, the t-statistic is a ratio of the departure of an estimated parameter from its notional value and its standard error. It is used in hypothesis testing, for example in the Student's t-test, in the augmented Dickey–Fuller test, and in bootstrapping.-Definition:Let \scriptstyle\hat\beta...
to estimate the distribution of the sample mean,
.Instead, we use bootstrap, specifically case resampling, to derive the distribution of
. We first resample the data to obtain a bootstrap resample. An example of the first resample might look like this . Note that there are some duplicates since a bootstrap resample comes from sampling with replacement from the data. Note also that the number of data points in a bootstrap resample is equal to the number of data points in our original observations. Then we compute the mean of this resample and obtain the first bootstrap mean: μ1*. We repeat this process to obtain the second resample X2* and compute the second bootstrap mean μ2*. If we repeat this 100 times, then we have μ1*, μ2*, …, μ100*. This represents an empirical bootstrap distribution of sample mean. From this empirical distribution, one can derive a bootstrap confidence interval for the purpose of hypothesis testing.Regression
In regression problems, case resampling refers to the simple scheme of resampling individual cases - often rows of a data setData set
A data set is a collection of data, usually presented in tabular form. Each column represents a particular variable. Each row corresponds to a given member of the data set in question. Its values for each of the variables, such as height and weight of an object or values of random numbers. Each...
. For regression problems, so long as the data set is fairly large, this simple scheme is often acceptable. However, the method is open to criticism.
In regression problems, the explanatory variables are often fixed, or at least observed with more control than the response variable. Also, the range of the explanatory variables defines the information available from them. Therefore, to resample cases means that each bootstrap sample will lose some information. As such, alternative bootstrap procedures should be considered.
Smooth bootstrap
Under this scheme, a small amount of (usually normally distributed) zero-centered random noise is added on to each resampled observation. This is equivalent to sampling from a kernel density estimate of the data.Parametric bootstrap
In this case a parametric model is fitted to the data, often by maximum likelihoodMaximum likelihood
In statistics, maximum-likelihood estimation is a method of estimating the parameters of a statistical model. When applied to a data set and given a statistical model, maximum-likelihood estimation provides estimates for the model's parameters....
, and samples of random number
Random number
Random number may refer to:* A number generated for or part of a set exhibiting statistical randomness.* A random sequence obtained from a stochastic process.* An algorithmically random sequence in algorithmic information theory....
s are drawn from this fitted model. Usually the sample drawn has the same sample size as the original data. Then the quantity, or estimate, of interest is calculated from these data. This sampling process is repeated many times as for other bootstrap methods. The use of a parametric model at the sampling stage of the bootstrap methodology leads to procedures which are different from those obtained by applying basic statistical theory to inference for the same model.
Resampling residuals
Another approach to bootstrapping in regression problems is to resample residualErrors and residuals in statistics
In statistics and optimization, statistical errors and residuals are two closely related and easily confused measures of the deviation of a sample from its "theoretical value"...
s. The method proceeds as follows.
- Fit the model and retain the fitted values
 and the residuals
  .
. - For each pair, (xi, yi), in which xi is the (possibly multivariate) explanatory variable, add a randomly resampled residual,
 , to the response variable yi. In other words create synthetic response variables
  where j is selected randomly from the list (1, …, n) for every i.
 - Refit the model using the fictitious response variables y*i, and retain the quantities of interest (often the parameters,
 , estimated from the synthetic y*i).
 - Repeat steps 2 and 3 a statistically significant number of times.
This scheme has the advantage that it retains the information in the explanatory variables. However, a question arises as to which residuals to resample. Raw residuals are one option; another is studentized residuals (in linear regression). Whilst there are arguments in favour of using studentized residuals; in practice, it often makes little difference and it is easy to run both schemes and compare the results against each other.
Gaussian process regression bootstrap
When data are temporally correlated, straightforward bootstrapping destroys the inherent correlations. This method uses Gaussian process regression to fit a probabilistic model from which replicates may then be drawn. Gaussian processes are methods from Bayesian non-parametric statisticsNon-parametric statistics
In statistics, the term non-parametric statistics has at least two different meanings:The first meaning of non-parametric covers techniques that do not rely on data belonging to any particular distribution. These include, among others:...
but are here used to construct a parametric bootstrap approach, which implicitly allows the time-dependence of the data to be taken into account.
Wild bootstrap
Each residual is randomly multiplied by a random variable with mean 0 and variance 1. This method assumes that the 'true' residual distribution is symmetric and can offer advantages over simple residual sampling for smaller sample sizes.Moving block bootstrap
In the moving block bootstrap, n-b+1 overlapping blocks of length b will be created in the following way: Observation 1 to b will be block 1, observation 2 to b+1 will be block 2 etc. Then from these n-b+1 blocks, n/b blocks will be drawn at random with replacement. Then aligning these n/b blocks in the order they were picked, will give the bootstrap observations. This bootstrap works with dependent data, however, the bootstrapped observations will not be stationary anymore by construction. But, it was shown that varying the block length can avoid this problem.Choice of statistic - pivoting
In situations where it is essential to extract as much information as possible from a data set, consideration needs to be given to exactly what estimate or statistic should be the subject of the bootstrapping. Suppose inference is required about the mean of some observations. Then two possibilities are:- generate bootstrap samples of the sample mean to construct a confidence interval for the mean;
- generate bootstrap samples of the new statistic (mean divided by sample standard deviation), construct a confidence interval for this, then derive the final confidence interval for the mean by multiplying the end-points of the initial interval by the sample standard deviation of the original sample.
The results will be different, and simulation results suggest that the second approach is better. The approach may derive partly from the standard parametric approach for Normal distributions, but is rather more general. The idea is to try to make use of a pivotal quantity
Pivotal quantity
In statistics, a pivotal quantity or pivot is a function of observations and unobservable parameters whose probability distribution does not depend on unknown parameters....
, or to find a derived statistic that is approximately pivotal. See also ancillary statistic
Ancillary statistic
In statistics, an ancillary statistic is a statistic whose sampling distribution does not depend on which of the probability distributions among those being considered is the distribution of the statistical population from which the data were taken...
.
Deriving confidence intervals from the bootstrap distribution
There are several ways of using the bootstrap distribution in order to calculate confidence intervals for the simulated statistics and no method is considered best for all problems. The trade-off is between simplicity and generality and the aim of different adjusted methods strive for better coverage.Effect of bias and the lack of symmetry on bootstrap confidence intervals
- Bias: When we compare the mean of the bootstrap distribution of a statistic with the corresponding statistic from the original sample, we are checking for biasBias (statistics)A statistic is biased if it is calculated in such a way that it is systematically different from the population parameter of interest. The following lists some types of, or aspects of, bias which should not be considered mutually exclusive:...
. As long as the bootstrap distribution reveals no bias and its shape is symmetric, the percentile confidence interval is a good way to estimate. Bias in the bootstrap distribution will lead to bias in the confidence interval estimate. Some of the different methods try to correct for this bias.
- Lack of symmetry in the bootstrap distribution raises another issue — how should the asymmetry of the distribution be reflected in the confidence interval?
Methods for bootstrap confidence intervals
Methods for constructing bootstrap confidence intervals include:- Percentile Bootstrap - one of the simplest methods. It is derived by using the 2.5 and the 97.5 percentilePercentileIn statistics, a percentile is the value of a variable below which a certain percent of observations fall. For example, the 20th percentile is the value below which 20 percent of the observations may be found...
s of the bootstrap distribution as the limits of the 95% confidence interval. This method can be applied to any statistics. It will work well in cases where the bootstrap distribution is symmetrical and centered on the observed statistic (see: Efron 1982). When this doesn't apply, the percentile bootstrap will tend to be over optimistic (see Schenker 1985). Schenker notes that when working with small sample sizes (i.e., less than 50), the percentile confidence intervals for (for example) the varianceVarianceIn probability theory and statistics, the variance is a measure of how far a set of numbers is spread out. It is one of several descriptors of a probability distribution, describing how far the numbers lie from the mean . In particular, the variance is one of the moments of a distribution...
statistic will be too narrow. So that with a sample of 20 points, 90% confidence interval will include the true variance only 78% of the time. - Basic Bootstrap - a "turned around" version of the percentile bootstrap.
- Studentized Bootstrap
- Bias-Corrected Bootstrap - adjusts for biasBias (statistics)A statistic is biased if it is calculated in such a way that it is systematically different from the population parameter of interest. The following lists some types of, or aspects of, bias which should not be considered mutually exclusive:...
in the bootstrap distribution. - Accelerated Bootstrap - The bootstrap bias-corrected and accelerated (BCa) bootstrap, by Efron (1987), adjusts for both bias and skewnessSkewnessIn probability theory and statistics, skewness is a measure of the asymmetry of the probability distribution of a real-valued random variable. The skewness value can be positive or negative, or even undefined...
in the bootstrap distribution. This approach is accurate in a wide variety of settings, has reasonable computation requirements, and does not produce excessively wide intervals.
Application to testing for mediation
Bootstrapping is becoming the most popular method of testing mediationMediation (Statistics)
In statistics, a mediation model is one that seeks to identify and explicate the mechanism that underlies an observed relationship between an independent variable and a dependent variable via the inclusion of a third explanatory variable, known as a mediator variable...
because it does not require the normality assumption to be met, and because it can be effectively utilized with smaller sample sizes (N < 20). However, mediation continues to be (perhaps inappropriately) most frequently determined using (1) the logic of Baron and Kenny or (2) the Sobel test: see mediation
Mediation (Statistics)
In statistics, a mediation model is one that seeks to identify and explicate the mechanism that underlies an observed relationship between an independent variable and a dependent variable via the inclusion of a third explanatory variable, known as a mediator variable...
.
Smoothed bootstrap
Newcomb's speed-of-light data are used in the book Bayesian Data Analysis by Gelman et al. and can be found online. Some analysis of these data appears on the robust statisticsRobust statistics
Robust statistics provides an alternative approach to classical statistical methods. The motivation is to produce estimators that are not unduly affected by small departures from model assumptions.- Introduction :...
page.
The data set contains two obvious outliers so that, as an estimate of location, the median is to be preferred over the mean. Bootstrapping is a method often employed for estimating confidence intervals for medians. However, the median is a discrete statistic, and this fact shows up in the bootstrap distribution.
In order to smooth over the discreteness of the median, we can add a small amount of N(0, σ2) random noise to each bootstrap sample. We choose
for sample size n.Histograms of the bootstrap distribution and the smooth bootstrap distribution appear below. The bootstrap distribution is very jagged because there are only a small number of values that the median can take. The smoothed bootstrap distribution overcomes this jaggedness.
Although the bootstrap distribution of the median looks ugly and intuitively wrong, confidence intervals from it are not bad in this example. The simple 95% percentile interval is (26, 28.5) for the simple bootstrap and (25.98, 28.46) for the smoothed bootstrap.
Relationship to other resampling methods
The bootstrap is distinguished from :- the jackknife procedure, used to estimate biases of sample statistics and to estimate variances, and
- cross-validation, in which the parameters (e.g., regression weights, factor loadings) that are estimated in one subsample are applied to another subsample.
For more details see bootstrap resampling.
Bootstrap aggregating
Bootstrap aggregating
Bootstrap aggregating is a machine learning ensemble meta-algorithm to improve machine learning of statistical classification and regression models in terms of stability and classification accuracy. It also reduces variance and helps to avoid overfitting. Although it is usually applied to decision...
(bagging) is a meta-algorithm based on averaging the results of multiple bootstrap samples.
U-statistics
In situations where an obvious statistic can be devised to measure a required characteristic using only a small number, r, of data items, a corresponding statistic based on the entire sample can be formulated. Given an r-sample statistic, one can create an n-sample statistic by something similar to bootstrapping (taking the average of the statistic over all subsamples of size r). This procedure is known to have certain good properties and the result is a U-statisticU-statistic
In statistical theory, a U-statistic is a class of statistics that is especially important in estimation theory. In elementary statistics, U-statistics arise naturally in producing minimum-variance unbiased estimators...
. The sample mean and sample variance are of this form, for r=1 and r=2.
Etymology
The use of the phrase in statistics was introduced by Bradley Efron in "Bootstrap methods: another look at the jackknife," Annals of Statistics, 7, (1979) 1-26. See Notes for Earliest Known Uses of Some of the Words of Mathematics: Bootstrap (John Aldrich) and Earliest Known Uses of Some of the Words of Mathematics (B) (Jeff Miller) for details.See also
- Imputation (statistics)Imputation (statistics)In statistics, imputation is the substitution of some value for a missing data point or a missing component of a data point. Once all missing values have been imputed, the dataset can then be analysed using standard techniques for complete data...
- Reliability (statistics)Reliability (statistics)In statistics, reliability is the consistency of a set of measurements or of a measuring instrument, often used to describe a test. Reliability is inversely related to random error.-Types:There are several general classes of reliability estimates:...
- ReproducibilityReproducibilityReproducibility is the ability of an experiment or study to be accurately reproduced, or replicated, by someone else working independently...
- Accuracy and precisionAccuracy and precisionIn the fields of science, engineering, industry and statistics, the accuracy of a measurement system is the degree of closeness of measurements of a quantity to that quantity's actual value. The precision of a measurement system, also called reproducibility or repeatability, is the degree to which...
Further reading
software. software- Hesterberg, T. C., D. S. Moore, S. Monaghan, A. Clipson, and R. Epstein (2005): Bootstrap Methods and Permutation Tests, software. 10.1093/bioinformatics/btp139
External links
- Bootstrap tutorial from ICASSP 99: Tutorial from a signal processing perspective
- Animations for bootstrapping i.i.d data by Yihui Xie using the RR (programming language)R is a programming language and software environment for statistical computing and graphics. The R language is widely used among statisticians for developing statistical software, and R is widely used for statistical software development and data analysis....
- bootstrapping tutorial
- package animation