
Order statistic
Encyclopedia
Statistics
Statistics is the study of the collection, organization, analysis, and interpretation of data. It deals with all aspects of this, including the planning of data collection in terms of the design of surveys and experiments....
, the kth order statistic of a statistical sample is equal to its kth-smallest value. Together with rank statistic
Ranking
A ranking is a relationship between a set of items such that, for any two items, the first is either 'ranked higher than', 'ranked lower than' or 'ranked equal to' the second....
s, order statistics are among the most fundamental tools in non-parametric statistics
Non-parametric statistics
In statistics, the term non-parametric statistics has at least two different meanings:The first meaning of non-parametric covers techniques that do not rely on data belonging to any particular distribution. These include, among others:...
and inference.
Important special cases of the order statistics are the minimum and maximum value of a sample, and (with some qualifications discussed below) the sample median and other sample quantiles
Quantile
Quantiles are points taken at regular intervals from the cumulative distribution function of a random variable. Dividing ordered data into q essentially equal-sized data subsets is the motivation for q-quantiles; the quantiles are the data values marking the boundaries between consecutive subsets...
.
When using probability theory
Probability theory
Probability theory is the branch of mathematics concerned with analysis of random phenomena. The central objects of probability theory are random variables, stochastic processes, and events: mathematical abstractions of non-deterministic events or measured quantities that may either be single...
to analyze order statistics of random sample
Random sample
In statistics, a sample is a subject chosen from a population for investigation; a random sample is one chosen by a method involving an unpredictable component...
s from a continuous distribution, the cumulative distribution function
Cumulative distribution function
In probability theory and statistics, the cumulative distribution function , or just distribution function, describes the probability that a real-valued random variable X with a given probability distribution will be found at a value less than or equal to x. Intuitively, it is the "area so far"...
is used to reduce the analysis to the case of order statistics of the uniform distribution
Uniform distribution (continuous)
In probability theory and statistics, the continuous uniform distribution or rectangular distribution is a family of probability distributions such that for each member of the family, all intervals of the same length on the distribution's support are equally probable. The support is defined by...
.
Notation and examples
For example, suppose that four numbers are observed or recorded, resulting in a sample of size n = 4. if the sample values are- 6, 9, 3, 8,
they will usually be denoted

where the subscript i in
 indicates simply the order in which the observations were recorded and is usually assumed not to be significant. A case when the order is significant is when the observations are part of a time series
Time series
In statistics, signal processing, econometrics and mathematical finance, a time series is a sequence of data points, measured typically at successive times spaced at uniform time intervals. Examples of time series are the daily closing value of the Dow Jones index or the annual flow volume of the...
.
The order statistics would be denoted

where the subscript (i) enclosed in parentheses indicates the ith order statistic of the sample.
The first order statistic (or smallest order statistic) is always the minimum of the sample, that is,

where, following a common convention, we use upper-case letters to refer to random variables, and lower-case letters (as above) to refer to their actual observed values.
Similarly, for a sample of size n, the nth order statistic (or largest order statistic) is the maximum, that is,

The sample range
Range (statistics)
In the descriptive statistics, the range is the length of the smallest interval which contains all the data. It is calculated by subtracting the smallest observation from the greatest and provides an indication of statistical dispersion.It is measured in the same units as the data...
is the difference between the maximum and minimum. It is clearly a function of the order statistics:

A similar important statistic in exploratory data analysis
Exploratory data analysis
In statistics, exploratory data analysis is an approach to analysing data sets to summarize their main characteristics in easy-to-understand form, often with visual graphs, without using a statistical model or having formulated a hypothesis...
that is simply related to the order statistics is the sample interquartile range
Interquartile range
In descriptive statistics, the interquartile range , also called the midspread or middle fifty, is a measure of statistical dispersion, being equal to the difference between the upper and lower quartiles...
.
The sample median may or may not be an order statistic, since there is a single middle value only when the number
 of observations is odd
Even and odd numbers
In mathematics, the parity of an object states whether it is even or odd.This concept begins with integers. An even number is an integer that is "evenly divisible" by 2, i.e., divisible by 2 without remainder; an odd number is an integer that is not evenly divisible by 2...
. More precisely, if
 for some
  , then the sample median is
  and so is an order statistic. On the other hand, when
  is even
Even and odd numbers
In mathematics, the parity of an object states whether it is even or odd.This concept begins with integers. An even number is an integer that is "evenly divisible" by 2, i.e., divisible by 2 without remainder; an odd number is an integer that is not evenly divisible by 2...
,
 and there are two middle values,
  and
and  , and the sample median is some function of the two (usually the average) and hence not an order statistic. Similar remarks apply to all sample quantiles.
Probabilistic analysis
Given any random variables , the order statistics
  are also random variables, defined by sorting the values (realizations
Realization (probability)
In probability and statistics, a realization, or observed value, of a random variable is the value that is actually observed . The random variable itself should be thought of as the process how the observation comes about...
) of
 in increasing order.
When the random variables
 form a sample
Sample (statistics)
In statistics, a sample is a subset of a population. Typically, the population is very large, making a census or a complete enumeration of all the values in the population impractical or impossible. The sample represents a subset of manageable size...
, they are independent and identically distributed (iid). This is the case treated below. In general, the random variables
 can arise by sampling from more than one population. Then they are independent but not necessarily identically distributed, and their joint probability distribution is given by the Bapat-Beg theorem
Bapat-Beg theorem
In probability theory, the Bapat–Beg theorem gives the joint cumulative distribution function of order statistics of independent but not necessarily identically distributed random variables in terms of the cumulative distribution functions of the random variables...
.
From now on, we will assume that the random variables under consideration are continuous and, where convenient, we will also assume that they have a density
Probability density function
In probability theory, a probability density function , or density of a continuous random variable is a function that describes the relative likelihood for this random variable to occur at a given point. The probability for the random variable to fall within a particular region is given by the...
(that is, they are absolutely continuous
Absolute continuity
In mathematics, the relationship between the two central operations of calculus, differentiation and integration, stated by fundamental theorem of calculus in the framework of Riemann integration, is generalized in several directions, using Lebesgue integration and absolute continuity...
). The peculiarities of the analysis of distributions assigning mass to points (in particular, discrete distributions) are discussed at the end.
Probability distributions of order statistics
In this section we show that the order statistics of the uniform distributionUniform distribution (continuous)
In probability theory and statistics, the continuous uniform distribution or rectangular distribution is a family of probability distributions such that for each member of the family, all intervals of the same length on the distribution's support are equally probable. The support is defined by...
on the unit interval
Unit interval
In mathematics, the unit interval is the closed interval , that is, the set of all real numbers that are greater than or equal to 0 and less than or equal to 1...
have marginal distribution
Marginal distribution
In probability theory and statistics, the marginal distribution of a subset of a collection of random variables is the probability distribution of the variables contained in the subset. The term marginal variable is used to refer to those variables in the subset of variables being retained...
s belonging to the Beta distribution family. We also give a simple method to derive the joint distribution of any number of order statistics, and finally translate these results to arbitrary continuous distributions using the cdf
Cumulative distribution function
In probability theory and statistics, the cumulative distribution function , or just distribution function, describes the probability that a real-valued random variable X with a given probability distribution will be found at a value less than or equal to x. Intuitively, it is the "area so far"...
.
We assume throughout this section that
 is a random sample
Random sample
In statistics, a sample is a subject chosen from a population for investigation; a random sample is one chosen by a method involving an unpredictable component...
drawn from a continuous distribution with cdf
 . Denoting
  we obtain the corresponding random sample
  from the standard uniform distribution
Uniform distribution (continuous)
In probability theory and statistics, the continuous uniform distribution or rectangular distribution is a family of probability distributions such that for each member of the family, all intervals of the same length on the distribution's support are equally probable. The support is defined by...
. Note that the order statistics also satisfy
 .
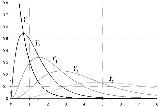
.The order statistics of the uniform distribution
The probability of the order statistic falling in the interval
  is equal to
that is, the kth order statistic of the uniform distribution is a Beta random variable.

The proof of these statements is as follows. For
 to be between u and u + du, it is necessary that exactly k − 1 elements of the sample are smaller than u, and that at least one is between u and u + du. The probability that more than one is in this latter interval is already
  , so we have to calculate the probability that exactly k − 1, 1 and n − k observations fall in the intervals
  ,
,  and
and  respectively. This equals (refer to multinomial distribution for details)
and the result follows.
The mean of this distribution is k / (n + 1).
The joint distribution of the order statistics of the uniform distribution
Similarly, for i < j, the joint probability density function of the two order statistics Ui < Uj can be shown to be
which is (up to terms of higher order than
 ) the probability that i − 1, 1, j − 1 − i, 1 and n − j sample elements fall in the intervals
  ,
,  ,
,  ,
,  ,
,  respectively.
One reasons in an entirely analogous way to derive the higher-order joint distributions. Perhaps surprisingly, the joint density of the n order statistics turns out to be constant:

One way to understand this is that the unordered sample does have constant density equal to 1, and that there are n! different permutations of the sample corresponding to the same sequence of order statistics. This is related to the fact that 1/n! is the volume of the region
 .
.The joint distribution of the order statistics of an absolutely continuous distribution
If FX is absolutely continuousAbsolute continuity
In mathematics, the relationship between the two central operations of calculus, differentiation and integration, stated by fundamental theorem of calculus in the framework of Riemann integration, is generalized in several directions, using Lebesgue integration and absolute continuity...
, it has a density such that
 , and we can use the substitutions
and

to derive the following probability density function
Probability density function
In probability theory, a probability density function , or density of a continuous random variable is a function that describes the relative likelihood for this random variable to occur at a given point. The probability for the random variable to fall within a particular region is given by the...
s (pdfs) for the order statistics of a sample of size n drawn from the distribution of X:


 where
where 
Application: confidence intervals for quantiles
An interesting question is how well the order statistics perform as estimators of the quantileQuantile
Quantiles are points taken at regular intervals from the cumulative distribution function of a random variable. Dividing ordered data into q essentially equal-sized data subsets is the motivation for q-quantiles; the quantiles are the data values marking the boundaries between consecutive subsets...
s of the underlying distribution.
A small-sample-size example
The simplest case to consider is how well the sample median estimates the population median.As an example, consider a random sample of size 6. In that case, the sample median is usually defined as the midpoint of the interval delimited by the 3rd and 4th order statistics. However, we know from the preceding discussion that the probability that this interval actually contains the population median is

Although the sample median is probably among the best distribution-independent point estimates of the population median, what this example illustrates is that it is not a particularly good one in absolute terms. In this particular case, a better confidence interval for the median is the one delimited by the 2nd and 5th order statistics, which contains the population median with probability

With such a small sample size, if one wants at least 95% confidence, one is reduced to saying that the median is between the minimum and the maximum of the 6 observations with probability 31/32 or approximately 97%. Size 6 is, in fact, the smallest sample size such that the interval determined by the minimum and the maximum is at least a 95% confidence interval for the population median.
Large sample sizes
For the uniform distribution, as n tends to infinity, the pth sample quantile is asymptotically normally distributed, since it is approximated by
For a general distribution F with a continuous non-zero density at F −1(p), a similar asymptotic normality applies:

where f is the density function, and F −1 is the quantile function
Quantile function
In probability and statistics, the quantile function of the probability distribution of a random variable specifies, for a given probability, the value which the random variable will be at, or below, with that probability...
associated with F.
An interesting observation can be made in the case where the distribution is symmetric, and the population median equals the population mean. In this case, the sample mean, by the central limit theorem
Central limit theorem
In probability theory, the central limit theorem states conditions under which the mean of a sufficiently large number of independent random variables, each with finite mean and variance, will be approximately normally distributed. The central limit theorem has a number of variants. In its common...
, is also asymptotically normally distributed, but with variance σ2/n instead. This asymptotic analysis suggests that the mean outperforms the median in cases of low kurtosis
Kurtosis
In probability theory and statistics, kurtosis is any measure of the "peakedness" of the probability distribution of a real-valued random variable...
, and vice versa. For example, the median achieves better confidence intervals for the Laplace distribution, while the mean performs better for X that are normally distributed.
Proof
It can be shown that
where

with Zi being independent identically distributed exponential
Exponential distribution
In probability theory and statistics, the exponential distribution is a family of continuous probability distributions. It describes the time between events in a Poisson process, i.e...
random variables with rate 1. Since X/n and Y/n are asymptotically normally distributed by the CLT, our results follow by application of the delta method
Delta method
In statistics, the delta method is a method for deriving an approximate probability distribution for a function of an asymptotically normal statistical estimator from knowledge of the limiting variance of that estimator...
.
Dealing with discrete variables
Suppose are i.i.d. random variables from a discrete distribution with cumulative distribution function and probability mass function
  and
and  respectively. To find the probabilities of the
  order statistics, three values are first needed, namely
The cumulative distribution function of the
 order statistic can be computed by noting that
Similarly,
 is given by
Note that the probability mass function of
 is just the difference of these values, that is to say
Computing order statistics
The problem of computing the kth smallest (or largest) element of a list is called the selection problem and is solved by a selection algorithmSelection algorithm
In computer science, a selection algorithm is an algorithm for finding the kth smallest number in a list . This includes the cases of finding the minimum, maximum, and median elements. There are O, worst-case linear time, selection algorithms...
. Although this problem is difficult for very large lists, sophisticated selection algorithms have been created that can solve this problem in time proportional to the number of elements in the list, even if the list is totally unordered. If the data is stored in certain specialized data structures, this time can be brought down to O(log n). In many applications all order statistics are required, in which case a sorting algorithm
Sorting algorithm
In computer science, a sorting algorithm is an algorithm that puts elements of a list in a certain order. The most-used orders are numerical order and lexicographical order...
can be used and the time taken is O(n log n).
See also
- RankitRankitIn statistics, rankits of a set of data are the expected values of the order statistics of a sample from the standard normal distribution the same size as the data. They are primarily used in the normal probability plot, a graphical technique for normality testing.-Example:This is perhaps most...
- Box plotBox plotIn descriptive statistics, a box plot or boxplot is a convenient way of graphically depicting groups of numerical data through their five-number summaries: the smallest observation , lower quartile , median , upper quartile , and largest observation...
- Fisher-Tippett distribution
- Bapat-Beg theoremBapat-Beg theoremIn probability theory, the Bapat–Beg theorem gives the joint cumulative distribution function of order statistics of independent but not necessarily identically distributed random variables in terms of the cumulative distribution functions of the random variables...
for the order statistics of independent but not necessarily identically distributed random variables - Bernstein polynomialBernstein polynomialIn the mathematical field of numerical analysis, a Bernstein polynomial, named after Sergei Natanovich Bernstein, is a polynomial in the Bernstein form, that is a linear combination of Bernstein basis polynomials....
Examples of order statistics
- Sample maximum and minimumSample maximum and minimumIn statistics, the maximum and sample minimum, also called the largest observation, and smallest observation, are the values of the greatest and least elements of a sample....
- QuantileQuantileQuantiles are points taken at regular intervals from the cumulative distribution function of a random variable. Dividing ordered data into q essentially equal-sized data subsets is the motivation for q-quantiles; the quantiles are the data values marking the boundaries between consecutive subsets...
- PercentilePercentileIn statistics, a percentile is the value of a variable below which a certain percent of observations fall. For example, the 20th percentile is the value below which 20 percent of the observations may be found...
- DecileDescriptive statisticsDescriptive statistics quantitatively describe the main features of a collection of data. Descriptive statistics are distinguished from inferential statistics , in that descriptive statistics aim to summarize a data set, rather than use the data to learn about the population that the data are...
- QuartileQuartileIn descriptive statistics, the quartiles of a set of values are the three points that divide the data set into four equal groups, each representing a fourth of the population being sampled...
- MedianMedianIn probability theory and statistics, a median is described as the numerical value separating the higher half of a sample, a population, or a probability distribution, from the lower half. The median of a finite list of numbers can be found by arranging all the observations from lowest value to...
External links
Retrieved Feb 02,2005 Retrieved Feb 02,2005- Dr. Susan Holmes Order Statistics Retrieved Feb 02,2005