

Sample maximum and minimum
Encyclopedia
Statistics
Statistics is the study of the collection, organization, analysis, and interpretation of data. It deals with all aspects of this, including the planning of data collection in terms of the design of surveys and experiments....
, the maximum and sample minimum, also called the largest observation, and smallest observation, are the values of the greatest and least elements of a sample
Sample (statistics)
In statistics, a sample is a subset of a population. Typically, the population is very large, making a census or a complete enumeration of all the values in the population impractical or impossible. The sample represents a subset of manageable size...
.
The minimum and the maximum value are the first and last order statistic
Order statistic
In statistics, the kth order statistic of a statistical sample is equal to its kth-smallest value. Together with rank statistics, order statistics are among the most fundamental tools in non-parametric statistics and inference....
s, often denoted
 and
and  , respectively, for a sample size of n., easily obtained by sorting in the order of increasing value.
If there are outliers, they necessarily include the sample maximum or sample minimum, or both, depending on whether they are extremely high or low. However, the sample maximum and minimum need not be outliers, if they are not unusually far from other observations.
Robustness
The sample maximum and minimum are the least robust statisticsRobust statistics
Robust statistics provides an alternative approach to classical statistical methods. The motivation is to produce estimators that are not unduly affected by small departures from model assumptions.- Introduction :...
: they are maximally sensitive to outliers.
This can either be an advantage or a drawback: if extreme values are real (not measurement errors), and of real consequence, as in applications of extreme value theory
Extreme value theory
Extreme value theory is a branch of statistics dealing with the extreme deviations from the median of probability distributions. The general theory sets out to assess the type of probability distributions generated by processes...
such as building dikes or financial loss, then outliers (as reflected in sample extrema) are important. On the other hand, if outliers have little or no impact on actual outcomes, then using non-robust statistics such as the sample extrema simply cloud the statistics, and robust alternatives should be used, such as other quantiles: the 10th and 90th percentiles (first and last decile
Decile
* In descriptive statistics, any of the nine values that divide the sorted data into ten equal parts, so that each part represents 1/10 of the sample or population* In astrology, an aspect of 36 degrees-See also:*Percentile*Quantile*Quartile*Summary statistics...
) are more robust alternatives.
Derived statistics
Other than being a component of every statistic that uses all samples, the sample extrema are important parts of the rangeRange (statistics)
In the descriptive statistics, the range is the length of the smallest interval which contains all the data. It is calculated by subtracting the smallest observation from the greatest and provides an indication of statistical dispersion.It is measured in the same units as the data...
, a measure of dispersion, and mid-range, a measure of location. They also realize the maximum absolute deviation: they are the furthest points from any given point, particularly a measure of center such as the median or mean.
Summary statistics
Firstly, the sample maximum and minimum are basic summary statisticsSummary statistics
In descriptive statistics, summary statistics are used to summarize a set of observations, in order to communicate the largest amount as simply as possible...
, showing the most extreme observations, and are used in the five-number summary
Five-number summary
The five-number summary is a descriptive statistic that provides information about a set of observations. It consists of the five most important sample percentiles:# the sample minimum # the lower quartile or first quartile...
and seven-number summary
Seven-number summary
In descriptive statistics, the seven-number summary is a collection of seven summary statistics, and is a modification or extension of the five-number summary...
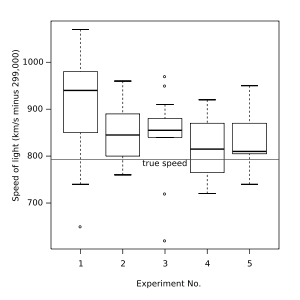
and the associated box plot
Box plot
In descriptive statistics, a box plot or boxplot is a convenient way of graphically depicting groups of numerical data through their five-number summaries: the smallest observation , lower quartile , median , upper quartile , and largest observation...
.
Prediction interval
The sample maximum and minimum provide a non-parametric prediction intervalPrediction interval
In statistical inference, specifically predictive inference, a prediction interval is an estimate of an interval in which future observations will fall, with a certain probability, given what has already been observed...
:
in a sample set from a population, or more generally an exchangeable sequence of random variables, each sample is equally likely to be the maximum or minimum.
Thus if one has a sample set
 and one picks another sample
  then this has
  probability of being the largest value seen so far,
  probability of being the smallest value seen so far, and thus the other
  of the time,
  falls between the sample maximum and sample minimum of
Thus, denoting the sample maximum and minimum by M and m, this yields an
 prediction interval of [m,M].
For example, if n=19, then [m,M] gives an 18/20 = 90% prediction interval – 90% of the time, the 20th observation falls between the smallest and largest observation seen heretofore. Likewise, n=39 gives a 95% prediction interval, and n=199 gives a 99% prediction interval.
Estimation
Due to their sensitivity to outliers, the sample extrema cannot reliably be used as estimators unless data is clean – robust alternatives include the first and last deciles.However, with clean data or in theoretical settings, they can sometimes prove very good estimators, particularly for platykurtic distributions, where for small data sets the mid-range is the most efficient
Efficiency (statistics)
In statistics, an efficient estimator is an estimator that estimates the quantity of interest in some “best possible” manner. The notion of “best possible” relies upon the choice of a particular loss function — the function which quantifies the relative degree of undesirability of estimation errors...
estimator.
They are inefficient estimators of location for mesokurtic distributions, such as the normal distribution, and leptokurtic distributions, however.
Uniform distribution
For sampling without replacement from a uniform distribution with one or two unknown endpoints (so with N unknown, or
  with both M and N unknown), the sample maximum, or respectively the sample maximum and sample minimum, are sufficient and complete statistics for the unknown endpoints; thus an unbiased estimator derived from these will be UMVU estimator.
If only the top endpoint is unknown, the sample maximum is a biased estimator for the population maximum, but the unbiased estimator
 (where m is the sample maximum and k is the sample size) is the UMVU estimator; see German tank problem
German tank problem
In the statistical theory of estimation, estimating the maximum of a uniform distribution is a common illustration of differences between estimation methods...
for details.
If both endpoints are unknown, then the sample range is a biased estimator for the population range, but correcting as for maximum above yields the UMVU estimator.
If both endpoints are unknown, then the mid-range is an unbiased (and hence UMVU) estimator of the mid-point of the interval (here equivalently the population median, average, or mid-range).
The reason the sample extrema are sufficient statistics is that the conditional distribution of the non-extreme samples is just the distribution for the uniform interval between the sample maximum and minimum – once the endpoints are fixed, the values of the interior points add no additional information.
Normality testing
Normality test
In statistics, normality tests are used to determine whether a data set is well-modeled by a normal distribution or not, or to compute how likely an underlying random variable is to be normally distributed....
, specifically of kurtosis: one computes the t-statistic of the sample maximum and minimum (subtracts sample mean and divides by the sample standard deviation
Sample standard deviation
A sample standard deviation is an estimate, based on a sample, of a population standard deviation. See:* Standard deviation#Estimation* Sample mean and sample covariance...
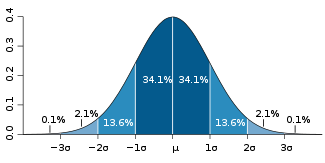
), and if they are unusually large for the sample size (as per the three sigma rule and table therein, or more precisely a Student's t-distribution), then the kurtosis of the sample distribution deviates significantly from that of the normal distribution.
For instance, a daily process should expect a 3σ event once per year (of calendar days; once every year and a half of business days), while a 4σ event happens on average every 40 years of calendar days, 60 years of business days (once in a lifetime), 5σ events happen every 5,000 years (once in recorded history), and 6σ events happen every 1.5 million years (essentially never). Thus if the sample extrema are 6 sigmas from the mean, one has a significant failure of normality.
Further, this test is very easy to communicate without involved statistics.
These tests of normality can be applied if one faces kurtosis risk
Kurtosis risk
Kurtosis risk in statistics and decision theory denotes the fact that observations are spread in a wider fashion than the normal distribution entails...
, for instance.
Extreme value theory

Extreme value theory
Extreme value theory is a branch of statistics dealing with the extreme deviations from the median of probability distributions. The general theory sets out to assess the type of probability distributions generated by processes...
:
- firstly, they give a lower bound on extreme events – events can be at least this extreme, and for this size sample;
- secondly, they can sometimes be used in estimators of probability of more extreme events.
However, caution must be used in using sample extrema as guidelines: in heavy-tailed distribution
Heavy-tailed distribution
In probability theory, heavy-tailed distributions are probability distributions whose tails are not exponentially bounded: that is, they have heavier tails than the exponential distribution...
s or for non-stationary processes, extreme events can be significantly more extreme than any previously observed event. This is elaborated in black swan theory
Black swan theory
The black swan theory or theory of black swan events is a metaphor that encapsulates the concept that The event is a surprise and has a major impact...
.
See also
- Maximum
- Maxima and minimaMaxima and minimaIn mathematics, the maximum and minimum of a function, known collectively as extrema , are the largest and smallest value that the function takes at a point either within a given neighborhood or on the function domain in its entirety .More generally, the...
- OutlierOutlierIn statistics, an outlier is an observation that is numerically distant from the rest of the data. Grubbs defined an outlier as: An outlying observation, or outlier, is one that appears to deviate markedly from other members of the sample in which it occurs....
- Order statisticOrder statisticIn statistics, the kth order statistic of a statistical sample is equal to its kth-smallest value. Together with rank statistics, order statistics are among the most fundamental tools in non-parametric statistics and inference....
- German tank problemGerman tank problemIn the statistical theory of estimation, estimating the maximum of a uniform distribution is a common illustration of differences between estimation methods...
- Range (statistics)Range (statistics)In the descriptive statistics, the range is the length of the smallest interval which contains all the data. It is calculated by subtracting the smallest observation from the greatest and provides an indication of statistical dispersion.It is measured in the same units as the data...
- Mid-range
Summary statistics
- Box plotBox plotIn descriptive statistics, a box plot or boxplot is a convenient way of graphically depicting groups of numerical data through their five-number summaries: the smallest observation , lower quartile , median , upper quartile , and largest observation...
- Five-number summaryFive-number summaryThe five-number summary is a descriptive statistic that provides information about a set of observations. It consists of the five most important sample percentiles:# the sample minimum # the lower quartile or first quartile...
- Seven-number summarySeven-number summaryIn descriptive statistics, the seven-number summary is a collection of seven summary statistics, and is a modification or extension of the five-number summary...
- Summary statisticsSummary statisticsIn descriptive statistics, summary statistics are used to summarize a set of observations, in order to communicate the largest amount as simply as possible...