Log-normal distribution
Encyclopedia
In probability theory
, a log-normal distribution is a probability distribution
of a random variable
whose logarithm
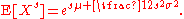
is normally distributed. If X is a random variable with a normal distribution, then Y = exp
(X) has a log-normal distribution; likewise, if Y is log-normally distributed, then X = log(Y) is normally distributed. (This is true regardless of the base of the logarithmic function: if loga(Y) is normally distributed, then so is logb(Y), for any two positive numbers a, b ≠ 1.)
Log-normal is also written log normal or lognormal. It is occasionally referred to as the Galton distribution or Galton's distribution, after Francis Galton
.
A variable might be modeled as log-normal if it can be thought of as the multiplicative product of many independent
random variable
s each of which is positive. For example, in finance, the variable could represent the compound return from a sequence of many trades (each expressed as its return + 1); or a long-term discount factor can be derived from the product of short-term discount factors. In wireless communication, the attenuation caused by shadowing or slow fading from random objects is often assumed to be log-normally distributed: see log-distance path loss model.
The log-normal distribution is the maximum entropy probability distribution
for a random variate X for which the mean and variance of is fixed.
and standard deviation
, respectively, of the variable’s natural logarithm
(by definition, the variable’s logarithm is normally distributed). On a non-logarithmized scale, μ and σ can be called the location parameter and the scale parameter, respectively.
In contrast, the mean and standard deviation of the non-logarithmized sample values are denoted m and s.d. in this article.
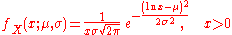
of a log-normal distribution is:
This follows by applying the change-of-variables rule
on the density function of a normal distribution.
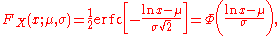
where erfc is the complementary error function, and Φ is the standard normal cdf.
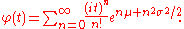
, E[e itX], has a number of representations. The integral itself converges for Im(t) ≤ 0. The simplest representation is obtained by Taylor expanding e itX and using formula for moments below, giving
This series representation is divergent for Re(σ2) > 0. However, it is sufficient for evaluating the characteristic function numerically at positive as long as the upper limit in the sum above is kept bounded, n ≤ N, where
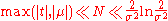
and σ2 < 0.1. To bring the numerical values of parameters μ, σ into the domain where strong inequality holds true one could use the fact that if X is log-normally distributed then Xm is also log-normally distributed with parameters μm, σm. Since , the inequality could be satisfied for sufficiently small m. The sum of series first converges to the value of φ(t) with arbitrary high accuracy if m is small enough, and left part of the strong inequality is satisfied. If considerably larger number of terms are taken into account the sum eventually diverges when the right part of the strong inequality is no longer valid.
Another useful representation was derived by Roy Lepnik (see references by this author and by Daniel Dufresne below) by means of double Taylor expansion of e(ln x − μ)2/(2σ2).
The moment-generating function
for the log-normal distribution does not exist on the domain R, but only exists on the half-interval( −∞, 0] .
and geometric standard deviation
than the arithmetic mean
and standard deviation.
of the log-normal distribution is . Because the log of a log-normal variable is symmetric and quantiles are preserved under monotonic transformations, the geometric mean of a log-normal distribution is equal to its median.
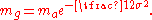
The geometric mean (mg) can alternatively be derived from the arithmetic mean (ma) in a log-normal distribution by:
The geometric standard deviation
is equal to .
.
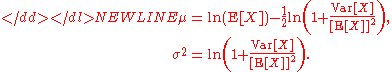
(E - which can be assumed to represent the arithmetic mean
), variance
(Var), and standard deviation
(s.d.) are
Probability theory
Probability theory is the branch of mathematics concerned with analysis of random phenomena. The central objects of probability theory are random variables, stochastic processes, and events: mathematical abstractions of non-deterministic events or measured quantities that may either be single...
, a log-normal distribution is a probability distribution
Probability distribution
In probability theory, a probability mass, probability density, or probability distribution is a function that describes the probability of a random variable taking certain values....
of a random variable
Random variable
In probability and statistics, a random variable or stochastic variable is, roughly speaking, a variable whose value results from a measurement on some type of random process. Formally, it is a function from a probability space, typically to the real numbers, which is measurable functionmeasurable...
whose logarithm
Logarithm
The logarithm of a number is the exponent by which another fixed value, the base, has to be raised to produce that number. For example, the logarithm of 1000 to base 10 is 3, because 1000 is 10 to the power 3: More generally, if x = by, then y is the logarithm of x to base b, and is written...
is normally distributed. If X is a random variable with a normal distribution, then Y = exp
Exponential function
In mathematics, the exponential function is the function ex, where e is the number such that the function ex is its own derivative. The exponential function is used to model a relationship in which a constant change in the independent variable gives the same proportional change In mathematics,...
(X) has a log-normal distribution; likewise, if Y is log-normally distributed, then X = log(Y) is normally distributed. (This is true regardless of the base of the logarithmic function: if loga(Y) is normally distributed, then so is logb(Y), for any two positive numbers a, b ≠ 1.)
Log-normal is also written log normal or lognormal. It is occasionally referred to as the Galton distribution or Galton's distribution, after Francis Galton
Francis Galton
Sir Francis Galton /ˈfrɑːnsɪs ˈgɔːltn̩/ FRS , cousin of Douglas Strutt Galton, half-cousin of Charles Darwin, was an English Victorian polymath: anthropologist, eugenicist, tropical explorer, geographer, inventor, meteorologist, proto-geneticist, psychometrician, and statistician...
.
A variable might be modeled as log-normal if it can be thought of as the multiplicative product of many independent
Statistical independence
In probability theory, to say that two events are independent intuitively means that the occurrence of one event makes it neither more nor less probable that the other occurs...
random variable
Random variable
In probability and statistics, a random variable or stochastic variable is, roughly speaking, a variable whose value results from a measurement on some type of random process. Formally, it is a function from a probability space, typically to the real numbers, which is measurable functionmeasurable...
s each of which is positive. For example, in finance, the variable could represent the compound return from a sequence of many trades (each expressed as its return + 1); or a long-term discount factor can be derived from the product of short-term discount factors. In wireless communication, the attenuation caused by shadowing or slow fading from random objects is often assumed to be log-normally distributed: see log-distance path loss model.
The log-normal distribution is the maximum entropy probability distribution
Maximum entropy probability distribution
In statistics and information theory, a maximum entropy probability distribution is a probability distribution whose entropy is at least as great as that of all other members of a specified class of distributions....
for a random variate X for which the mean and variance of
is fixed. μ and σ
In a log-normal distribution, the parameters denoted μ and σ, are the meanMean
In statistics, mean has two related meanings:* the arithmetic mean .* the expected value of a random variable, which is also called the population mean....
and standard deviation
Standard deviation
Standard deviation is a widely used measure of variability or diversity used in statistics and probability theory. It shows how much variation or "dispersion" there is from the average...
, respectively, of the variable’s natural logarithm
Logarithm
The logarithm of a number is the exponent by which another fixed value, the base, has to be raised to produce that number. For example, the logarithm of 1000 to base 10 is 3, because 1000 is 10 to the power 3: More generally, if x = by, then y is the logarithm of x to base b, and is written...
(by definition, the variable’s logarithm is normally distributed). On a non-logarithmized scale, μ and σ can be called the location parameter and the scale parameter, respectively.
In contrast, the mean and standard deviation of the non-logarithmized sample values are denoted m and s.d. in this article.
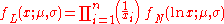
Probability density function
The probability density functionProbability density function
In probability theory, a probability density function , or density of a continuous random variable is a function that describes the relative likelihood for this random variable to occur at a given point. The probability for the random variable to fall within a particular region is given by the...
of a log-normal distribution is:
This follows by applying the change-of-variables rule
Probability density function
In probability theory, a probability density function , or density of a continuous random variable is a function that describes the relative likelihood for this random variable to occur at a given point. The probability for the random variable to fall within a particular region is given by the...
on the density function of a normal distribution.
Cumulative distribution function
where erfc is the complementary error function, and Φ is the standard normal cdf.
Characteristic function and moment generating function
The characteristic functionCharacteristic function (probability theory)
In probability theory and statistics, the characteristic function of any random variable completely defines its probability distribution. Thus it provides the basis of an alternative route to analytical results compared with working directly with probability density functions or cumulative...
, E[e itX], has a number of representations. The integral itself converges for Im(t) ≤ 0. The simplest representation is obtained by Taylor expanding e itX and using formula for moments below, giving
This series representation is divergent for Re(σ2) > 0. However, it is sufficient for evaluating the characteristic function numerically at positive
as long as the upper limit in the sum above is kept bounded, n ≤ N, whereand σ2 < 0.1. To bring the numerical values of parameters μ, σ into the domain where strong inequality holds true one could use the fact that if X is log-normally distributed then Xm is also log-normally distributed with parameters μm, σm. Since
, the inequality could be satisfied for sufficiently small m. The sum of series first converges to the value of φ(t) with arbitrary high accuracy if m is small enough, and left part of the strong inequality is satisfied. If considerably larger number of terms are taken into account the sum eventually diverges when the right part of the strong inequality is no longer valid.Another useful representation was derived by Roy Lepnik (see references by this author and by Daniel Dufresne below) by means of double Taylor expansion of e(ln x − μ)2/(2σ2).
The moment-generating function
Moment-generating function
In probability theory and statistics, the moment-generating function of any random variable is an alternative definition of its probability distribution. Thus, it provides the basis of an alternative route to analytical results compared with working directly with probability density functions or...
for the log-normal distribution does not exist on the domain R, but only exists on the half-interval
Location and scale
For the log-normal distribution, the location and scale properties of the distribution are more readily treated using the geometric meanGeometric mean
The geometric mean, in mathematics, is a type of mean or average, which indicates the central tendency or typical value of a set of numbers. It is similar to the arithmetic mean, except that the numbers are multiplied and then the nth root of the resulting product is taken.For instance, the...
and geometric standard deviation
Geometric standard deviation
In probability theory and statistics, the geometric standard deviation describes how spread out are a set of numbers whose preferred average is the geometric mean...
than the arithmetic mean
Arithmetic mean
In mathematics and statistics, the arithmetic mean, often referred to as simply the mean or average when the context is clear, is a method to derive the central tendency of a sample space...
and standard deviation.
Geometric moments
The geometric meanGeometric mean
The geometric mean, in mathematics, is a type of mean or average, which indicates the central tendency or typical value of a set of numbers. It is similar to the arithmetic mean, except that the numbers are multiplied and then the nth root of the resulting product is taken.For instance, the...
of the log-normal distribution is
. Because the log of a log-normal variable is symmetric and quantiles are preserved under monotonic transformations, the geometric mean of a log-normal distribution is equal to its median.The geometric mean (mg) can alternatively be derived from the arithmetic mean (ma) in a log-normal distribution by:
The geometric standard deviation
Geometric standard deviation
In probability theory and statistics, the geometric standard deviation describes how spread out are a set of numbers whose preferred average is the geometric mean...
is equal to
.Arithmetic moments
If X is a lognormally distributed variable, its expected valueExpected value
In probability theory, the expected value of a random variable is the weighted average of all possible values that this random variable can take on...
(E - which can be assumed to represent the arithmetic mean
Arithmetic mean
In mathematics and statistics, the arithmetic mean, often referred to as simply the mean or average when the context is clear, is a method to derive the central tendency of a sample space...
), variance
Variance
In probability theory and statistics, the variance is a measure of how far a set of numbers is spread out. It is one of several descriptors of a probability distribution, describing how far the numbers lie from the mean . In particular, the variance is one of the moments of a distribution...
(Var), and standard deviation
Standard deviation
Standard deviation is a widely used measure of variability or diversity used in statistics and probability theory. It shows how much variation or "dispersion" there is from the average...
(s.d.) are
-
Equivalently, parameters μ and σ can be obtained if the expected value and variance are known:-
For any real or complex number s, the sth momentMoment (mathematics)In mathematics, a moment is, loosely speaking, a quantitative measure of the shape of a set of points. The "second moment", for example, is widely used and measures the "width" of a set of points in one dimension or in higher dimensions measures the shape of a cloud of points as it could be fit by...
of log-normal X is given by
A log-normal distribution is not uniquely determined by its moments E[Xk] for k ≥ 1, that is, there exists some other distribution with the same moments for all k. In fact, there is a whole family of distributions with the same moments as the log-normal distribution.
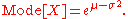
Mode and median
The modeMode (statistics)In statistics, the mode is the value that occurs most frequently in a data set or a probability distribution. In some fields, notably education, sample data are often called scores, and the sample mode is known as the modal score....
is the point of global maximum of the probability density function. In particular, it solves the equation (ln ƒ)′ = 0:
The medianMedianIn probability theory and statistics, a median is described as the numerical value separating the higher half of a sample, a population, or a probability distribution, from the lower half. The median of a finite list of numbers can be found by arranging all the observations from lowest value to...
is such a point where FX = 1/2:

Coefficient of variation
The coefficient of variationCoefficient of variationIn probability theory and statistics, the coefficient of variation is a normalized measure of dispersion of a probability distribution. It is also known as unitized risk or the variation coefficient. The absolute value of the CV is sometimes known as relative standard deviation , which is...
is the ratio s.d. over m (on the natural scale)
and is equal to:
Partial expectation
The partial expectation of a random variable X with respect to a threshold k is defined as g(k) = E[X | X > k]P[X > k]. For a log-normal random variable the partial expectation is given by

This formula has applications in insurance and economics, it is used in solving the partial differential equation leading to the Black–Scholes formula.
Other
A set of data that arises from the log-normal distribution has a symmetric Lorenz curveLorenz curveIn economics, the Lorenz curve is a graphical representation of the cumulative distribution function of the empirical probability distribution of wealth; it is a graph showing the proportion of the distribution assumed by the bottom y% of the values...
(see also Lorenz asymmetry coefficientLorenz asymmetry coefficientThe Lorenz asymmetry coefficient is a summary statistic of the Lorenz curve that measures the degree of asymmetry of the curve. The Lorenz asymmetry coefficient is defined asS = F+ L\,...
).
Occurrence
- In biologyBiologyBiology is a natural science concerned with the study of life and living organisms, including their structure, function, growth, origin, evolution, distribution, and taxonomy. Biology is a vast subject containing many subdivisions, topics, and disciplines...
, variables whose logarithms tend to have a normal distribution include:- Measures of size of living tissue (length, height, skin area, weight);
- The length of inert appendages (hair, claws, nails, teeth) of biological specimens, in the direction of growth;
- Certain physiological measurements, such as blood pressure of adult humans (after separation on male/female subpopulations).
- Subsequently, reference ranges for measurements in healthy individuals are more accurately estimated by assuming a log-normal distribution than by assuming a symmetric distribution about the mean.
- In hydrologyHydrologyHydrology is the study of the movement, distribution, and quality of water on Earth and other planets, including the hydrologic cycle, water resources and environmental watershed sustainability...
, the log-normal distribution is used to analyze extreme values of such variables as monthly and annual maximum values of daily rainfall and river discharge volumes.- The image on the right illustrates an example of fitting the log-normal distribution to ranked annually maximum one-day rainfalls showing also the 90% confidence belt based on the binomial distribution. The rainfall data are represented by plotting positions as part of the cumulative frequency analysisCumulative frequency analysisCumulative frequency analysis is the applcation of estimation theory to exceedance probability . The complement, the non-exceedance probability concerns the frequency of occurrence of values of a phenomenon staying below a reference value. The phenomenon may be time or space dependent...
.
- The image on the right illustrates an example of fitting the log-normal distribution to ranked annually maximum one-day rainfalls showing also the 90% confidence belt based on the binomial distribution. The rainfall data are represented by plotting positions as part of the cumulative frequency analysis
- In financeFinance"Finance" is often defined simply as the management of money or “funds” management Modern finance, however, is a family of business activity that includes the origination, marketing, and management of cash and money surrogates through a variety of capital accounts, instruments, and markets created...
, in particular the Black–Scholes model, changes in the logarithm of exchange rates, price indices, and stock market indices are assumed normal (these variables behave like compound interest, not like simple interest, and so are multiplicative). However, some mathematicians such as Benoît MandelbrotBenoît MandelbrotBenoît B. Mandelbrot was a French American mathematician. Born in Poland, he moved to France with his family when he was a child...
have argued that log-Levy distributions which possesses heavy tails would be a more appropriate model, in particular for the analysis for stock market crashStock market crashA stock market crash is a sudden dramatic decline of stock prices across a significant cross-section of a stock market, resulting in a significant loss of paper wealth. Crashes are driven by panic as much as by underlying economic factors...
es. Indeed stock price distribution typically exhibit a fat tailFat tailA fat-tailed distribution is a probability distribution that has the property, along with the heavy-tailed distributions, that they exhibit extremely large skewness or kurtosis. This comparison is often made relative to the ubiquitous normal distribution, which itself is an example of an...
.
- The distribution of city sizes is lognormal. This follows from Gibrat's lawGibrat's lawGibrat's law, sometimes called Gibrat's rule of proportionate growth is a rule defined by Robert Gibrat stating that the size of a firm and its growth rate are independent. The law proportionate growth gives rise to a distribution that is log-normal...
of proportionate (or scale-free) growth. Irrespective of their size, all cities follow the same stochastic growth process. As a result, the logarithm of city size is normally distributed. There is also evidence of lognormality in the firm size distribution and of Gibrat's law.
- In ReliabilityReliabilityIn general, reliability is the ability of a person or system to perform and maintain its functions in routine circumstances, as well as hostile or unexpected circumstances.Reliability may refer to:...
analysis, the lognormal distribution is often used to model times to repair a maintainable system.
- It has been proposed that coefficients of friction and wear may be treated as having a lognormal distribution
Maximum likelihood estimation of parameters
For determining the maximum likelihoodMaximum likelihoodIn statistics, maximum-likelihood estimation is a method of estimating the parameters of a statistical model. When applied to a data set and given a statistical model, maximum-likelihood estimation provides estimates for the model's parameters....
estimators of the log-normal distribution parameters μ and σ, we can use the same procedure as for the normal distribution. To avoid repetition, we observe that
where by ƒL we denote the probability density function of the log-normal distribution and by ƒN that of the normal distribution. Therefore, using the same indices to denote distributions, we can write the log-likelihood function thus:
-

Since the first term is constant with regard to μ and σ, both logarithmic likelihood functions, ℓL and ℓN, reach their maximum with the same μ and σ. Hence, using the formulas for the normal distribution maximum likelihood parameter estimators and the equality above, we deduce that for the log-normal distribution it holds that
-

Generating log-normally-distributed random variates
Given a random variate N drawn from the normal distribution with 0 mean and 1 standard deviation, then the variate

has a log-normal distribution with parameters and
and  .
.
Related distributions
- If
 is a normal distribution, then
- If
 is distributed log-normally, then
 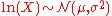 is a normal random variable.
- If
 are n independentStatistical independenceIn probability theory, to say that two events are independent intuitively means that the occurrence of one event makes it neither more nor less probable that the other occurs...
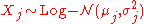
log-normally distributed variables, and , then Y is also distributed log-normally:
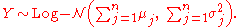
- Let
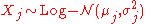 be independent log-normally distributed variables with possibly varying σ and μ parameters, and
  . The distribution of Y has no closed-form expression, but can be reasonably approximated by another log-normal distribution Z at the right tail. Its probability density function at the neighborhood of 0 is characterized in (Gao et al., 2009) and it does not resemble any log-normal distribution. A commonly used approximation (due to Fenton and Wilkinson) is obtained by matching the mean and variance:
-
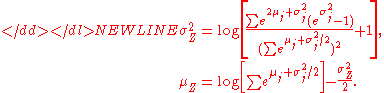
In the case that all have the same variance parameter
  , these formulas simplify to
-

- If
 , then X + c is said to have a shifted log-normal distribution with support x ∈ (c, +∞). E[X + c] = E[X] + c, Var[X + c] = Var[X].
- If
 , then
- If
 , then
- If
 then
then  for
for 
- Lognormal distribution is a special case of semi-bounded Johnson distribution
- If
 with
with  , then
  (Suzuki distribution)
Similar distributions
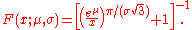
- A substitute for the log-normal whose integral can be expressed in terms of more elementary functions (Swamee, 2002) can be obtained based on the logistic distribution to get the CDFCumulative distribution functionIn probability theory and statistics, the cumulative distribution function , or just distribution function, describes the probability that a real-valued random variable X with a given probability distribution will be found at a value less than or equal to x. Intuitively, it is the "area so far"...
- This is a log-logistic distributionLog-logistic distributionIn probability and statistics, the log-logistic distribution is a continuous probability distribution for a non-negative random variable. It is used in survival analysis as a parametric model for events whose rate increases initially and decreases later, for example mortality from cancer following...
.
See also
- Error functionError functionIn mathematics, the error function is a special function of sigmoid shape which occurs in probability, statistics and partial differential equations...
- Log-distance path loss model
- Slow fading
- Stochastic volatilityStochastic volatilityStochastic volatility models are used in the field of mathematical finance to evaluate derivative securities, such as options. The name derives from the models' treatment of the underlying security's volatility as a random process, governed by state variables such as the price level of the...
- Today's practical relevance: Nanoparticles
Further reading
- Robert Brooks, Jon Corson, and J. Donal Wales. "The Pricing of Index Options When the Underlying Assets All Follow a Lognormal Diffusion", in Advances in Futures and Options Research, volume 7, 1994.
- If
-
- If
-
-
-