
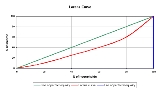
Lorenz curve
Overview
Cumulative distribution function
In probability theory and statistics, the cumulative distribution function , or just distribution function, describes the probability that a real-valued random variable X with a given probability distribution will be found at a value less than or equal to x. Intuitively, it is the "area so far"...
of the empirical probability distribution
Distribution function
In molecular kinetic theory in physics, a particle's distribution function is a function of seven variables, f, which gives the number of particles per unit volume in phase space. It is the number of particles per unit volume having approximately the velocity near the place and time...
of wealth; it is a graph
Graph of a function
In mathematics, the graph of a function f is the collection of all ordered pairs . In particular, if x is a real number, graph means the graphical representation of this collection, in the form of a curve on a Cartesian plane, together with Cartesian axes, etc. Graphing on a Cartesian plane is...
showing the proportion of the distribution assumed by the bottom y% of the values. It is often used to represent income
Income
Income is the consumption and savings opportunity gained by an entity within a specified time frame, which is generally expressed in monetary terms. However, for households and individuals, "income is the sum of all the wages, salaries, profits, interests payments, rents and other forms of earnings...
distribution, where it shows for the bottom x% of households, what percentage y% of the total income they have. The percentage
Percentage
In mathematics, a percentage is a way of expressing a number as a fraction of 100 . It is often denoted using the percent sign, “%”, or the abbreviation “pct”. For example, 45% is equal to 45/100, or 0.45.Percentages are used to express how large/small one quantity is, relative to another quantity...
of households is plotted on the x-axis, the percentage of income on the y-axis.
Discussions