

Nonlinear regression
Encyclopedia

Regression analysis
In statistics, regression analysis includes many techniques for modeling and analyzing several variables, when the focus is on the relationship between a dependent variable and one or more independent variables...
in which observational data are modeled by a function which is a nonlinear combination of the model parameters and depends on one or more independent variables. The data are fitted by a method of successive approximations.
General
The data consist of error-free independent variables (explanatory variables), x, and their associated observed dependent variables (response variables), y. Each y is modeled as a random variableRandom variable
In probability and statistics, a random variable or stochastic variable is, roughly speaking, a variable whose value results from a measurement on some type of random process. Formally, it is a function from a probability space, typically to the real numbers, which is measurable functionmeasurable...
with a mean
Mean
In statistics, mean has two related meanings:* the arithmetic mean .* the expected value of a random variable, which is also called the population mean....
given by a nonlinear function f(x,β). Systematic error
Systematic error
Systematic errors are biases in measurement which lead to the situation where the mean of many separate measurements differs significantly from the actual value of the measured attribute. All measurements are prone to systematic errors, often of several different types...
may be present but its treatment is outside the scope of regression analysis. If the independent variables are not error-free, this is an errors-in-variables model
Errors-in-variables model
Total least squares, also known as errors in variables, rigorous least squares, or orthogonal regression, is a least squares data modeling technique in which observational errors on both dependent and independent variables are taken into account...
, also outside this scope.
For example, the Michaelis–Menten model for enzyme kinetics
can be written as
where
 is the parameter
  ,
,  is the parameter
  and [S] is the independent variable, x. This function is nonlinear because it cannot be expressed as a linear combination
Linear combination
In mathematics, a linear combination is an expression constructed from a set of terms by multiplying each term by a constant and adding the results...
of the
 s.
s.Other examples of nonlinear functions include exponential functions, logarithmic functions
Logarithmic growth
In mathematics, logarithmic growth describes a phenomenon whose size or cost can be described as a logarithm function of some input. e.g. y = C log . Note that any logarithm base can be used, since one can be converted to another by a fixed constant...
, trigonometric functions, power functions
Exponentiation
Exponentiation is a mathematical operation, written as an, involving two numbers, the base a and the exponent n...
, Gaussian function, and Lorenz curve
Lorenz curve
In economics, the Lorenz curve is a graphical representation of the cumulative distribution function of the empirical probability distribution of wealth; it is a graph showing the proportion of the distribution assumed by the bottom y% of the values...
s. Some functions, such as the exponential or logarithmic functions, can be transformed so that they are linear. When so transformed, standard linear regression can be performed but must be applied with caution. See Linearization, below, for more details.
In general, there is no closed-form expression for the best-fitting parameters, as there is in linear regression
Linear regression
In statistics, linear regression is an approach to modeling the relationship between a scalar variable y and one or more explanatory variables denoted X. The case of one explanatory variable is called simple regression...
. Usually numerical optimization
Optimization (mathematics)
In mathematics, computational science, or management science, mathematical optimization refers to the selection of a best element from some set of available alternatives....
algorithms are applied to determine the best-fitting parameters. Again in contrast to linear regression, there may be many local minima of the function to be optimized and even the global minimum may produce a biased
Bias of an estimator
In statistics, bias of an estimator is the difference between this estimator's expected value and the true value of the parameter being estimated. An estimator or decision rule with zero bias is called unbiased. Otherwise the estimator is said to be biased.In ordinary English, the term bias is...
estimate. In practice, estimated values
Guess value
A guess value is more commonly called a starting value or initial value. These are necessary for most optimization problems which use search algorithms, because those algorithms are mainly deterministic and iterative, and they need to start somewhere...
of the parameters are used, in conjunction with the optimization algorithm, to attempt to find the global minimum of a sum of squares.
For details concerning nonlinear data modeling see least squares
Least squares
The method of least squares is a standard approach to the approximate solution of overdetermined systems, i.e., sets of equations in which there are more equations than unknowns. "Least squares" means that the overall solution minimizes the sum of the squares of the errors made in solving every...
and non-linear least squares
Non-linear least squares
Non-linear least squares is the form of least squares analysis which is used to fit a set of m observations with a model that is non-linear in n unknown parameters . It is used in some forms of non-linear regression. The basis of the method is to approximate the model by a linear one and to...
.
Regression statistics
The assumption underlying this procedure is that the model can be approximated by a linear function.
where
 . It follows from this that the least squares estimators are given by
The nonlinear regression statistics are computed and used as in linear regression statistics, but using J in place of X in the formulas. The linear approximation introduces bias
Bias
Bias is an inclination to present or hold a partial perspective at the expense of alternatives. Bias can come in many forms.-In judgement and decision making:...
into the statistics. Therefore more caution than usual is required in interpreting statistics derived from a nonlinear model.
Ordinary and weighted least squares
The best-fit curve is often assumed to be that which minimizes the sum of squared residualsErrors and residuals in statistics
In statistics and optimization, statistical errors and residuals are two closely related and easily confused measures of the deviation of a sample from its "theoretical value"...
. This is the (ordinary) least squares
Least squares
The method of least squares is a standard approach to the approximate solution of overdetermined systems, i.e., sets of equations in which there are more equations than unknowns. "Least squares" means that the overall solution minimizes the sum of the squares of the errors made in solving every...
(OLS) approach. However, in cases where the dependent variable does not have constant variance a sum of weighted squared residuals may be minimized; see weighted least squares. Each weight should ideally be equal to the reciprocal of the variance of the observation, but weights may be recomputed on each iteration, in an iteratively weighted least squares algorithm.
Transformation
Some nonlinear regression problems can be moved to a linear domain by a suitable transformation of the model formulation.For example, consider the nonlinear regression problem (ignoring the error):

If we take a logarithm of both sides, it becomes

suggesting estimation of the unknown parameters by a linear regression of ln(y) on x, a computation that does not require iterative optimization. However, use of a nonlinear transformation requires caution. The influences of the data values will change, as will the error structure of the model and the interpretation of any inferential results. These may not be desired effects. On the other hand, depending on what the largest source of error is, a nonlinear transformation may distribute your errors in a normal fashion, so the choice to perform a nonlinear transformation must be informed by modeling considerations.
For Michaelis–Menten kinetics, the linear Lineweaver–Burk plot

of 1/v against 1/[S] has been much used. However, since it is very sensitive to data error and is strongly biased toward fitting the data in a particular range of the independent variable, [S], its use is strongly discouraged.
Segmentation
- Main article: Segmented regressionSegmented regressionSegmented regression is a method in regression analysis in which the independent variable is partitioned into intervals and a separate line segment is fit to each interval. Segmented or piecewise regression analysis can also be performed on multivariate data by partitioning the various independent...
The independent or explanatory variable
Independent variable
The terms "dependent variable" and "independent variable" are used in similar but subtly different ways in mathematics and statistics as part of the standard terminology in those subjects...
(say X) can be split up into classes or segments and linear regression
Linear regression
In statistics, linear regression is an approach to modeling the relationship between a scalar variable y and one or more explanatory variables denoted X. The case of one explanatory variable is called simple regression...
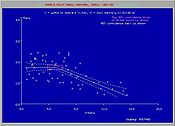
can be performed per segment. Segmented regression with confidence analysis
Confidence interval
In statistics, a confidence interval is a particular kind of interval estimate of a population parameter and is used to indicate the reliability of an estimate. It is an observed interval , in principle different from sample to sample, that frequently includes the parameter of interest, if the...
may yield the result that the dependent or response variable (say Y) behaves differently in the various segments.
The figure shows that the soil salinity (X) initially exerts no influence on the crop yield
Crop yield
In agriculture, crop yield is not only a measure of the yield of cereal per unit area of land under cultivation, yield is also the seed generation of the plant itself...
(Y) of mustard (colza), until a critical or threshold value (breakpoint), after which the yield is affected negatively.
See also
- Levenberg–Marquardt algorithm
- Non-linear least squaresNon-linear least squaresNon-linear least squares is the form of least squares analysis which is used to fit a set of m observations with a model that is non-linear in n unknown parameters . It is used in some forms of non-linear regression. The basis of the method is to approximate the model by a linear one and to...
- Curve fittingCurve fittingCurve fitting is the process of constructing a curve, or mathematical function, that has the best fit to a series of data points, possibly subject to constraints. Curve fitting can involve either interpolation, where an exact fit to the data is required, or smoothing, in which a "smooth" function...
- Generalized linear modelGeneralized linear modelIn statistics, the generalized linear model is a flexible generalization of ordinary linear regression. The GLM generalizes linear regression by allowing the linear model to be related to the response variable via a link function and by allowing the magnitude of the variance of each measurement to...
Further reading
- G.A.F Seber and C.J. Wild. Nonlinear Regression. New York: John Wiley and Sons, 1989.
- Meade, N. and T. Islam (1995) "Prediction Intervals for Growth Curve Forecasts" Journal of Forecasting, 14:413–430.
- K. Schittkowski. Data Fitting in Dynamical Systems. Kluwer, 2002.
- R.M. Bethea, B.S. Duran and T.L. Boullion. Statistical Methods for Engineers and Scientists. New York: Marcel Dekker, Inc 1985 ISBN 0-8247-7227-X