

CumFreq
Encyclopedia
In statistics
and data analysis
the application software
CumFreq is a free and user-friendly tool for cumulative frequency analysis
of a single variable
and for probability distribution fitting.
Originally the method was developed for the analysis of hydrological
measurements of spatially varying magnitudes (e.g. hydraulic conductivity
of the soil) and of magnitudes varying in time (e.g. rainfall, river discharge
) to find their return period
s. However, it can be used for many other types of phenomena.
 CumFreq uses the plotting position approach to estimate the cumulative frequency of each of the observed magnitudes in a data series of the variable.
The computer program
allows determination of the best fitting probability distribution
. Alternatively it provides the user with the option to select the probability distribution to be fitted. The following probability distributions are included: normal, lognormal, logistic, loglogistic, exponential
, Fréchet, Gumbel, Pareto, Weibull and others.
Further, the program can produce generalizations of the normal, logistic, and other distributions by transforming the data using an exponent that is optimized to obtain the best fit. This feature is not common in other distribution-fitting software which normally include only a logarithmic transformation of data obtaining distributions like the lognormal and loglogistic.
The software employs the binomial distribution to determine the confidence belt of the corresponding cumulative distribution function
. The prediction of the return period
, which is of interest in time series
, is also accompanied by a confidence belt. The construction of confidence belts is not found in most other software.
Another special characteristic of CumFreq is that it provides the option to use two different probability distributions, one for the lower data range, and one for the higher. The ranges are separated by a break-point. The use of discontinuous probability distributions can be useful when the data of the phenomenon studied were obtained under different conditions.
During the input phase, the user can select the number of intervals needed to determine the histogram
. He may also define a threshold to obtain a truncated distribution
.
The output section provides a calculator to facilitate interpolation
and extrapolation
.
ILRI provides examples of application to magnitudes like crop yield
, watertable depth, soil salinity, hydraulic conductivity
, rainfall, and river discharge
.
The confidence belt around an experimental cumulative frequency or return period curve gives an impression of the region in which the true distribution may be found.
Also, it clarifies that the experimentally found best fitting probability distribution may deviate from the true distribution
Statistics
Statistics is the study of the collection, organization, analysis, and interpretation of data. It deals with all aspects of this, including the planning of data collection in terms of the design of surveys and experiments....
and data analysis
Data analysis
Analysis of data is a process of inspecting, cleaning, transforming, and modeling data with the goal of highlighting useful information, suggesting conclusions, and supporting decision making...
the application software
Application software
Application software, also known as an application or an "app", is computer software designed to help the user to perform specific tasks. Examples include enterprise software, accounting software, office suites, graphics software and media players. Many application programs deal principally with...
CumFreq is a free and user-friendly tool for cumulative frequency analysis
Cumulative frequency analysis
Cumulative frequency analysis is the applcation of estimation theory to exceedance probability . The complement, the non-exceedance probability concerns the frequency of occurrence of values of a phenomenon staying below a reference value. The phenomenon may be time or space dependent...
of a single variable
Univariate analysis
Univariate analysis is the simplest form of quantitative analysis. The analysis is carried out with the description of a single variable and its attributes of the applicable unit of analysis...
and for probability distribution fitting.
Originally the method was developed for the analysis of hydrological
Hydrology
Hydrology is the study of the movement, distribution, and quality of water on Earth and other planets, including the hydrologic cycle, water resources and environmental watershed sustainability...
measurements of spatially varying magnitudes (e.g. hydraulic conductivity
Hydraulic conductivity
Hydraulic conductivity, symbolically represented as K, is a property of vascular plants, soil or rock, that describes the ease with which water can move through pore spaces or fractures. It depends on the intrinsic permeability of the material and on the degree of saturation...
of the soil) and of magnitudes varying in time (e.g. rainfall, river discharge
Discharge (hydrology)
In hydrology, discharge is the volume rate of water flow, including any suspended solids , dissolved chemical species and/or biologic material , which is transported through a given cross-sectional area...
) to find their return period
Return period
A return period also known as a recurrence interval is an estimate of the interval of time between events like an earthquake, flood or river discharge flow of a certain intensity or size. It is a statistical measurement denoting the average recurrence interval over an extended period of time, and...
s. However, it can be used for many other types of phenomena.
Features
The computer program
Computer program
A computer program is a sequence of instructions written to perform a specified task with a computer. A computer requires programs to function, typically executing the program's instructions in a central processor. The program has an executable form that the computer can use directly to execute...
allows determination of the best fitting probability distribution
Probability distribution
In probability theory, a probability mass, probability density, or probability distribution is a function that describes the probability of a random variable taking certain values....
. Alternatively it provides the user with the option to select the probability distribution to be fitted. The following probability distributions are included: normal, lognormal, logistic, loglogistic, exponential
Exponential distribution
In probability theory and statistics, the exponential distribution is a family of continuous probability distributions. It describes the time between events in a Poisson process, i.e...
, Fréchet, Gumbel, Pareto, Weibull and others.
Further, the program can produce generalizations of the normal, logistic, and other distributions by transforming the data using an exponent that is optimized to obtain the best fit. This feature is not common in other distribution-fitting software which normally include only a logarithmic transformation of data obtaining distributions like the lognormal and loglogistic.
The software employs the binomial distribution to determine the confidence belt of the corresponding cumulative distribution function
Cumulative distribution function
In probability theory and statistics, the cumulative distribution function , or just distribution function, describes the probability that a real-valued random variable X with a given probability distribution will be found at a value less than or equal to x. Intuitively, it is the "area so far"...
. The prediction of the return period
Return period
A return period also known as a recurrence interval is an estimate of the interval of time between events like an earthquake, flood or river discharge flow of a certain intensity or size. It is a statistical measurement denoting the average recurrence interval over an extended period of time, and...
, which is of interest in time series
Time series
In statistics, signal processing, econometrics and mathematical finance, a time series is a sequence of data points, measured typically at successive times spaced at uniform time intervals. Examples of time series are the daily closing value of the Dow Jones index or the annual flow volume of the...
, is also accompanied by a confidence belt. The construction of confidence belts is not found in most other software.
Another special characteristic of CumFreq is that it provides the option to use two different probability distributions, one for the lower data range, and one for the higher. The ranges are separated by a break-point. The use of discontinuous probability distributions can be useful when the data of the phenomenon studied were obtained under different conditions.
During the input phase, the user can select the number of intervals needed to determine the histogram
Histogram
In statistics, a histogram is a graphical representation showing a visual impression of the distribution of data. It is an estimate of the probability distribution of a continuous variable and was first introduced by Karl Pearson...
. He may also define a threshold to obtain a truncated distribution
Truncated distribution
In statistics, a truncated distribution is a conditional distribution that results from restricting the domain of some other probability distribution. Truncated distributions arise in practical statistics in cases where the ability to record, or even to know about, occurrences is limited to values...
.
The output section provides a calculator to facilitate interpolation
Interpolation
In the mathematical field of numerical analysis, interpolation is a method of constructing new data points within the range of a discrete set of known data points....
and extrapolation
Extrapolation
In mathematics, extrapolation is the process of constructing new data points. It is similar to the process of interpolation, which constructs new points between known points, but the results of extrapolations are often less meaningful, and are subject to greater uncertainty. It may also mean...
.
ILRI provides examples of application to magnitudes like crop yield
Crop yield
In agriculture, crop yield is not only a measure of the yield of cereal per unit area of land under cultivation, yield is also the seed generation of the plant itself...
, watertable depth, soil salinity, hydraulic conductivity
Hydraulic conductivity
Hydraulic conductivity, symbolically represented as K, is a property of vascular plants, soil or rock, that describes the ease with which water can move through pore spaces or fractures. It depends on the intrinsic permeability of the material and on the degree of saturation...
, rainfall, and river discharge
Discharge (hydrology)
In hydrology, discharge is the volume rate of water flow, including any suspended solids , dissolved chemical species and/or biologic material , which is transported through a given cross-sectional area...
.
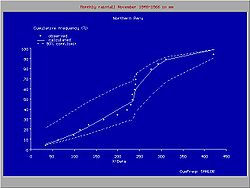
Need of confidence belts
The figure to the right shows the variation that may occur when obtaining samples of a variate that follows a certain probability distribution. The data were provided by Benson .The confidence belt around an experimental cumulative frequency or return period curve gives an impression of the region in which the true distribution may be found.
Also, it clarifies that the experimentally found best fitting probability distribution may deviate from the true distribution