

Station model
Encyclopedia

Weather
Weather is the state of the atmosphere, to the degree that it is hot or cold, wet or dry, calm or stormy, clear or cloudy. Most weather phenomena occur in the troposphere, just below the stratosphere. Weather refers, generally, to day-to-day temperature and precipitation activity, whereas climate...
occurring at a given reporting station
Weather station
A weather station is a facility, either on land or sea, with instruments and equipment for observing atmospheric conditions to provide information for weather forecasts and to study the weather and climate. The measurements taken include temperature, barometric pressure, humidity, wind speed, wind...
. Meteorologists created the station model to plot a number of weather elements in a small space on weather map
Weather map
A weather map displays various meteorological features across a particular area at a particular point in time. Such maps have been in use since the mid-19th century and are used for research and weather forecasting purposes. Maps using isotherms show temperature gradients, which can help locate...
s. Maps filled with dense station-model plots can be difficult to read, but they allow meteorologists, pilots, and mariners to see important weather patterns.
A computer draws a station model for each observation location. The station model is primarily used on surface-weather maps, but can also be used to show the weather aloft. A completed station-model map allows users to analyze patterns in air pressure, temperature, wind, cloud cover, and precipitation.
Station model plots use an internationally-accepted coding convention that has changed little since August 1, 1941. Elements in the plot show the key weather elements, including temperature
Temperature
Temperature is a physical property of matter that quantitatively expresses the common notions of hot and cold. Objects of low temperature are cold, while various degrees of higher temperatures are referred to as warm or hot...
, dewpoint, wind, cloud cover, air pressure, pressure tendency, and precipitation.
Measurement location and units
Weather maps primarily use the station model to show surface weather conditions, but the model can also show the weather aloft as reported by a weather balloon's radiosondeRadiosonde
A radiosonde is a unit for use in weather balloons that measures various atmospheric parameters and transmits them to a fixed receiver. Radiosondes may operate at a radio frequency of 403 MHz or 1680 MHz and both types may be adjusted slightly higher or lower as required...
or a pilot's report.
Station model plots use a mixture of metric and Imperial unit
Imperial unit
The system of imperial units or the imperial system is the system of units first defined in the British Weights and Measures Act of 1824, which was later refined and reduced. The system came into official use across the British Empire...
s depending on the map's location and what is being shown. Surface maps in the United States primarily use Imperial unit
Imperial unit
The system of imperial units or the imperial system is the system of units first defined in the British Weights and Measures Act of 1824, which was later refined and reduced. The system came into official use across the British Empire...
s, such inch
Inch
An inch is the name of a unit of length in a number of different systems, including Imperial units, and United States customary units. There are 36 inches in a yard and 12 inches in a foot...
es, degrees Fahrenheit
Fahrenheit
Fahrenheit is the temperature scale proposed in 1724 by, and named after, the German physicist Daniel Gabriel Fahrenheit . Within this scale, the freezing of water into ice is defined at 32 degrees, while the boiling point of water is defined to be 212 degrees...
, and knots. Most of the world, however, uses metric measurements for everything but wind speed, which is shown in knots.
Plotted winds
- Each half of a flag depicts five knots
- Each full flag depicts 10 knots
- Each pennantPennant (commissioning)The commissioning pennant is a pennant flown from the masthead of a warship. The history of flying a commissioning pennant dates back to the days of chivalry with their trail pendants being flown from the mastheads of ships they commanded...
(filled triangle) depicts 50 knots
Winds are depicted as blowing from the direction the flags are facing. Therefore, a northeast wind will be depicted with a line extending from the cloud circle to the northeast, with flags indicating wind speed on the northeast end of this line. Once plotted on a map, an analysis of isotachs (lines of equal wind speeds) can be accomplished. Isotachs are particularly useful in diagnosing the location of the jet stream on upper level constant pressure charts, usually at or above the 300 hPa level.
More than a century ago, winds were initially plotted as arrows facing downwind, with feathers on both sides of the staff to indicate wind direction. In the United States, the change to the modern convention of flags shown on one side of the staff to indicate wind speed took effect on August 1, 1941.
Cloud cover
Along with wind direction, cloud cover is one of the oldest atmospheric conditions to be coded on a station model. The circle in the middle of the station model represents cloud cover. In the United KingdomUnited Kingdom
The United Kingdom of Great Britain and Northern IrelandIn the United Kingdom and Dependencies, other languages have been officially recognised as legitimate autochthonous languages under the European Charter for Regional or Minority Languages...
, when the observation is taken from an automated weather observation site, the shape is a triangle. If the shape is completely filled in, it is overcast. If conditions are completely clear, the circle or triangle is empty. If conditions are partly cloudy, the circle or triangle is partially filled in. The cloud cover shape has different looks depending upon how many okta
Okta
In meteorology, an okta is a unit of measurement used to describe cloud cover. Sky conditions are estimated in terms of how many eighths of the sky are obscured by cloud, ranging from completely clear, 0 oktas, through to completely overcast, 8 oktas...
s (eighths of the sky) are covered by cloud. A sky half full of clouds would have a circle that was half white and half black. Below the shape indicating sky cover, the station model can indicate the coverage of low clouds, in oktas, and the ceiling height in hundreds of feet. The ceiling height is the height at which more than half the sky is covered by clouds.
For pilots, knowledge of the sky cover helps determine if visual flight rules
Visual flight rules
Visual flight rules are a set of regulations which allow a pilot to operate an aircraft in weather conditions generally clear enough to allow the pilot to see where the aircraft is going. Specifically, the weather must be better than basic VFR weather minimums, as specified in the rules of the...
are being met. Knowing the degree of cloud cover can help determine whether or not various weather fronts, such as cold front
Cold front
A cold front is defined as the leading edge of a cooler mass of air, replacing a warmer mass of air.-Development of cold front:The cooler and denser air wedges under the less-dense warmer air, lifting it...
s or warm front
Warm front
A warm front is a density discontinuity located at the leading edge of a homogeneous warm air mass, and is typically located on the equator-facing edge of an isotherm gradient...
s, have passed by a location. A nephanalysis
Nephanalysis
A nephanalaysis is the analysis of a synoptic chart focusing on the types and amount of clouds and precipitation. A nephanalysis can be used to avoid hazardous weather areas, by ships preparing routes for cruises, and to locate good fishing areas. This technique is rarely performed nowadays, due...
, contouring areas that are cloudy with scalloped lines, can be performed to indicate a system's cloud and precipitation pattern. This technique is rarely performed nowadays, due to the prevalence of satellite imagery worldwide.
Cloud types
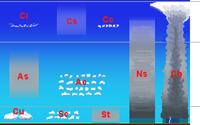
Above or below the shape indicating sky cover can lie a symbol indicating cloud type. One cloud type is depicted for each of three possible cloud layers, if known. The top two cloud layer types are depicted above the sky cover circle in the station model, while the lowest cloud type is indicated below the sky cover circle. The symbols used for clouds emulate the cloud shape. Cirrus
Cirrus cloud
Cirrus clouds are atmospheric clouds generally characterized by thin, wispy strands, giving them their name from the Latin word cirrus meaning a ringlet or curling lock of hair...
is indicated by a couple hooks, cumulus
Cumulus cloud
Cumulus clouds are a type of cloud with noticeable vertical development and clearly defined edges. Cumulus means "heap" or "pile" in Latin. They are often described as "puffy" or "cotton-like" in appearance. Cumulus clouds may appear alone, in lines, or in clusters...
are indicated by a mound shape, with cumulonimbus indicated with an upside down trapezoid on top of the cumulus symbol to indicate its anvil. Since the station model has limited room, when there is more than one cloud type present per level, the cloud type with the highest priority is included. Knowing the cloud type at various locations can help determine whether or not a weather front has passed by a particular location. A low deck of stratus could indicate a station is still north of a warm front, while thunderstorms can indicate the approach of a squall line
Squall line
A squall line is a line of severe thunderstorms that can form along or ahead of a cold front. In the early 20th century, the term was used as a synonym for cold front. It contains heavy precipitation, hail, frequent lightning, strong straight-line winds, and possibly tornadoes and waterspouts....
or cold front.
Present weather and visibility
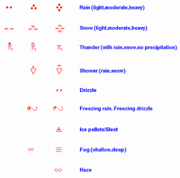
Visibility
In meteorology, visibility is a measure of the distance at which an object or light can be clearly discerned. It is reported within surface weather observations and METAR code either in meters or statute miles, depending upon the country. Visibility affects all forms of traffic: roads, sailing...
at the time of observation. The visibility itself is shown as a number, in statute miles in the United States and meters elsewhere, describing how far the observer can see at that time. This number is located to the left of the present weather symbol. For pilots, knowledge of the horizontal visibility helps determine if they are flying through instrument meteorological conditions
Instrument meteorological conditions
Instrument meteorological conditions is an aviation flight category that describes weather conditions that require pilots to fly primarily by reference to instruments, and therefore under Instrument Flight Rules , rather than by outside visual references under Visual Flight Rules . Typically, this...
, such as foggy or smokey conditions, as well as areas of intense precipitation. Present weather depicted with the station model can include:
- DustDustDust consists of particles in the atmosphere that arise from various sources such as soil dust lifted up by wind , volcanic eruptions, and pollution...
- FogFogFog is a collection of water droplets or ice crystals suspended in the air at or near the Earth's surface. While fog is a type of stratus cloud, the term "fog" is typically distinguished from the more generic term "cloud" in that fog is low-lying, and the moisture in the fog is often generated...
- HazeHazeHaze is traditionally an atmospheric phenomenon where dust, smoke and other dry particles obscure the clarity of the sky. The World Meteorological Organization manual of codes includes a classification of horizontal obscuration into categories of fog, ice fog, steam fog, mist, haze, smoke, volcanic...
- Ocean spray
- PrecipitationPrecipitation (meteorology)In meteorology, precipitation In meteorology, precipitation In meteorology, precipitation (also known as one of the classes of hydrometeors, which are atmospheric water phenomena is any product of the condensation of atmospheric water vapor that falls under gravity. The main forms of precipitation...
- SandSandSand is a naturally occurring granular material composed of finely divided rock and mineral particles.The composition of sand is highly variable, depending on the local rock sources and conditions, but the most common constituent of sand in inland continental settings and non-tropical coastal...
- SmokeSmokeSmoke is a collection of airborne solid and liquid particulates and gases emitted when a material undergoes combustion or pyrolysis, together with the quantity of air that is entrained or otherwise mixed into the mass. It is commonly an unwanted by-product of fires , but may also be used for pest...
- ThunderstormThunderstormA thunderstorm, also known as an electrical storm, a lightning storm, thundershower or simply a storm is a form of weather characterized by the presence of lightning and its acoustic effect on the Earth's atmosphere known as thunder. The meteorologically assigned cloud type associated with the...
s - Volcanic ashVolcanic ashVolcanic ash consists of small tephra, which are bits of pulverized rock and glass created by volcanic eruptions, less than in diameter. There are three mechanisms of volcanic ash formation: gas release under decompression causing magmatic eruptions; thermal contraction from chilling on contact...
Temperature and dewpoint
To left of center in the station model, the temperature and dewpoint are plotted. Within the United States on surface weather maps, they are still plotted in degrees FahrenheitFahrenheit
Fahrenheit is the temperature scale proposed in 1724 by, and named after, the German physicist Daniel Gabriel Fahrenheit . Within this scale, the freezing of water into ice is defined at 32 degrees, while the boiling point of water is defined to be 212 degrees...
. Otherwise, they will be in units of degrees Celsius
Celsius
Celsius is a scale and unit of measurement for temperature. It is named after the Swedish astronomer Anders Celsius , who developed a similar temperature scale two years before his death...
. This knowledge is important to meteorologists because when this data is plotted on a map, isotherms and isodrosotherms (lines of equal dewpoint) are easily analyzed, either by man or machine, which can help determine location of weather front
Weather front
A weather front is a boundary separating two masses of air of different densities, and is the principal cause of meteorological phenomena. In surface weather analyses, fronts are depicted using various colored lines and symbols, depending on the type of front...
s.
Sea level pressure and height of pressure surface
On the top right corner of the model for a surface weather map is the pressure, showing the last two integer digits of the pressure in millibars, or hectopascals, along with the first decimal. For instance, if the pressure at a certain location is 999.7 hPa, the pressure portion of the station model will read 997. Although the first digit or two of the pressure is left off, other nearby stations give away whether or not the first digits is a 10 or a 9. Most of the time, choosing first digits that would lead to a value nearest to 1000 works out best. The plotting of this value within the station model allows for the analysis of isobars on weather maps. Within maps which plot data on constant pressure surfaces, the pressure is replaced with the height of the pressure surface.Pressure tendency
Below the pressure will lie the pressure tendency figure, which indicates the pressure change over the past three hours. The number depicting the pressure change will usually have two digits and indicate the pressure change in 0.1 millibar increments. There are nine different figures which represent the pressure change. A slant angled up and right indicates a steady rise, while a downward slant to the lower right indicates a steady fall. Steady rises can indicate improving conditions and approaching high pressure, and normally occur in the wake of a cold front. Steady falls can indicate deteriorating conditions and an approaching low pressure area, with the largest falls occurring in advance of a surface cycloneCyclone
In meteorology, a cyclone is an area of closed, circular fluid motion rotating in the same direction as the Earth. This is usually characterized by inward spiraling winds that rotate anticlockwise in the Northern Hemisphere and clockwise in the Southern Hemisphere of the Earth. Most large-scale...
and its attendant warm front
Warm front
A warm front is a density discontinuity located at the leading edge of a homogeneous warm air mass, and is typically located on the equator-facing edge of an isotherm gradient...
.
The time of the day must be considered, as there are two natural rises per day (locally around 10 am and 10 pm) and two natural falls per day (locally around 4 am and 4 pm). These daily changes in pressure can mask the movement of pressure systems and fronts past a location. The lowest natural dip in the pressure, in a stagnant weather pattern, occurs around 4 pm while the highest natural peak in pressure occurs around 10 am. Once plotted on a map, the analysis of isallobars (lines of equal pressure change) can be plotted on a map, which can indicate the direction of motion of high and low pressures systems across the map domain.