
National debt by U.S. presidential terms
Encyclopedia
In the United States, national debt is money borrowed by the federal government of the United States
. Debt burden is usually measured as a ratio of public debt to gross domestic product
; the U.S. debt/GDP ratio reached a maximum during World War II
near the beginning of President Harry Truman's first presidential term.
The President proposes the budget for the government to the US Congress. Congress may change the budget, but it rarely appropriates more than what the President requests.
, Jimmy Carter
, Lyndon B. Johnson
, John F. Kennedy
, and Harry S. Truman
) all reduced public debt as a share of GDP, while the last four Republican Presidents (George W. Bush
, George H. W. Bush
, Ronald Reagan
, and Gerald Ford
) all oversaw an increase in the country’s indebtedness. Economic historian J. Bradford DeLong
, former Clinton Treasury Department official, observes a contrast not so much between Republicans and Democrats, but between Democrats and "old-style Republicans (Eisenhower and Nixon)" on one hand (decreasing debt), and "new-style Republicans" on the other (increasing debt). David Stockman
, director of the Office of Management and Budget under President Ronald Reagan, as op-ed contributor to the New York Times, blamed the "ideological tax-cutters" of the Reagan administration
for the increase of national debt during the 1980s.
CNN
's Jack Cafferty
and CBS
's Mark Knoller have noted that the US national debt in nominal dollars has increased more rapidly under President Obama than under any other U.S. president, and that it had increased by $4 trillion since the beginning of his term of office.
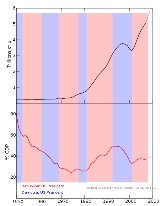
as a percentage of GDP
by Presidential term since World War II
. The current gross federal debt as a percentage of GDP (83.4% at the end of 2009) is currently the highest it has been since the late 1940s. The debt briefly reached over 100% of GDP in the aftermath of World War II.
The President proposes the budget for the government to the congress, which can amend it before passing. The U. S. Constitution in Article 1, Section 7 grants exclusive right to originate revenue related bills to the House of Representatives; the President's proposals are an indication of spending desired, but it is the House which defines the spending through the final wording of the bills. Since the budget resolution is a “concurrent” congressional resolution, not an ordinary bill, it does not go to the President for his signature or veto. While this leaves substantial room for the legislature to change the deficit, congressional historian Louis Fisher observes that, "Congress rarely appropriates more than what the President requests." In the case of Nixon, who fought fiercely with Congress over the budget, he writes, "Congress was able to adhere to the President's totals while significantly altering his priorities."
(Source: CBO Historical Budget Page and Whitehouse FY 2012 Budget - Table 7.1 Federal Debt at the End of Year PDF, Excel, Senate.gov)
Notes:
 Gross debt and public debt
are different. Public debt is the gross debt minus intra-governmental obligations (such as the money that the government owes to the two Social Security Trust Fund
s, the Old-Age, Survivors, and Disability Insurance
program, and the Social Security Disability Insurance
program).
The figures show the trend in public debt with the background colored by the party controlling the executive and legislative branches of government. The color of the trend line does not represent party affiliation; only the background color does.
Notes
Federal government of the United States
The federal government of the United States is the national government of the constitutional republic of fifty states that is the United States of America. The federal government comprises three distinct branches of government: a legislative, an executive and a judiciary. These branches and...
. Debt burden is usually measured as a ratio of public debt to gross domestic product
Gross domestic product
Gross domestic product refers to the market value of all final goods and services produced within a country in a given period. GDP per capita is often considered an indicator of a country's standard of living....
; the U.S. debt/GDP ratio reached a maximum during World War II
World War II
World War II, or the Second World War , was a global conflict lasting from 1939 to 1945, involving most of the world's nations—including all of the great powers—eventually forming two opposing military alliances: the Allies and the Axis...
near the beginning of President Harry Truman's first presidential term.
The President proposes the budget for the government to the US Congress. Congress may change the budget, but it rarely appropriates more than what the President requests.
Commentary
Economist Mike Kimel notes that the five former Democratic Presidents (Bill ClintonBill Clinton
William Jefferson "Bill" Clinton is an American politician who served as the 42nd President of the United States from 1993 to 2001. Inaugurated at age 46, he was the third-youngest president. He took office at the end of the Cold War, and was the first president of the baby boomer generation...
, Jimmy Carter
Jimmy Carter
James Earl "Jimmy" Carter, Jr. is an American politician who served as the 39th President of the United States and was the recipient of the 2002 Nobel Peace Prize, the only U.S. President to have received the Prize after leaving office...
, Lyndon B. Johnson
Lyndon B. Johnson
Lyndon Baines Johnson , often referred to as LBJ, was the 36th President of the United States after his service as the 37th Vice President of the United States...
, John F. Kennedy
John F. Kennedy
John Fitzgerald "Jack" Kennedy , often referred to by his initials JFK, was the 35th President of the United States, serving from 1961 until his assassination in 1963....
, and Harry S. Truman
Harry S. Truman
Harry S. Truman was the 33rd President of the United States . As President Franklin D. Roosevelt's third vice president and the 34th Vice President of the United States , he succeeded to the presidency on April 12, 1945, when President Roosevelt died less than three months after beginning his...
) all reduced public debt as a share of GDP, while the last four Republican Presidents (George W. Bush
George W. Bush
George Walker Bush is an American politician who served as the 43rd President of the United States, from 2001 to 2009. Before that, he was the 46th Governor of Texas, having served from 1995 to 2000....
, George H. W. Bush
George H. W. Bush
George Herbert Walker Bush is an American politician who served as the 41st President of the United States . He had previously served as the 43rd Vice President of the United States , a congressman, an ambassador, and Director of Central Intelligence.Bush was born in Milton, Massachusetts, to...
, Ronald Reagan
Ronald Reagan
Ronald Wilson Reagan was the 40th President of the United States , the 33rd Governor of California and, prior to that, a radio, film and television actor....
, and Gerald Ford
Gerald Ford
Gerald Rudolph "Jerry" Ford, Jr. was the 38th President of the United States, serving from 1974 to 1977, and the 40th Vice President of the United States serving from 1973 to 1974...
) all oversaw an increase in the country’s indebtedness. Economic historian J. Bradford DeLong
J. Bradford DeLong
James Bradford DeLong commonly known as Brad DeLong, is a professor of Economics and chair of the Political Economy major at the University of California, Berkeley. He served as Deputy Assistant Secretary of the United States Department of the Treasury in the Clinton Administration under Lawrence...
, former Clinton Treasury Department official, observes a contrast not so much between Republicans and Democrats, but between Democrats and "old-style Republicans (Eisenhower and Nixon)" on one hand (decreasing debt), and "new-style Republicans" on the other (increasing debt). David Stockman
David Stockman
David Alan Stockman is a former U.S. politician and businessman, serving as a Republican U.S. Representative from the state of Michigan and as the Director of the Office of Management and Budget ....
, director of the Office of Management and Budget under President Ronald Reagan, as op-ed contributor to the New York Times, blamed the "ideological tax-cutters" of the Reagan administration
Reagan Administration
The United States presidency of Ronald Reagan, also known as the Reagan administration, was a Republican administration headed by Ronald Reagan from January 20, 1981, to January 20, 1989....
for the increase of national debt during the 1980s.
CNN
CNN
Cable News Network is a U.S. cable news channel founded in 1980 by Ted Turner. Upon its launch, CNN was the first channel to provide 24-hour television news coverage, and the first all-news television channel in the United States...
's Jack Cafferty
Jack Cafferty
Jack Cafferty is a CNN commentator and occasional host of specials. In the summer of 2005, Cafferty joined The Situation Room.-Career:...
and CBS
CBS
CBS Broadcasting Inc. is a major US commercial broadcasting television network, which started as a radio network. The name is derived from the initials of the network's former name, Columbia Broadcasting System. The network is sometimes referred to as the "Eye Network" in reference to the shape of...
's Mark Knoller have noted that the US national debt in nominal dollars has increased more rapidly under President Obama than under any other U.S. president, and that it had increased by $4 trillion since the beginning of his term of office.
Gross federal debt
This table lists the gross U.S. federal debtUnited States public debt
The United States public debt is the money borrowed by the federal government of the United States at any one time through the issue of securities by the Treasury and other federal government agencies...
as a percentage of GDP
Gross domestic product
Gross domestic product refers to the market value of all final goods and services produced within a country in a given period. GDP per capita is often considered an indicator of a country's standard of living....
by Presidential term since World War II
World War II
World War II, or the Second World War , was a global conflict lasting from 1939 to 1945, involving most of the world's nations—including all of the great powers—eventually forming two opposing military alliances: the Allies and the Axis...
. The current gross federal debt as a percentage of GDP (83.4% at the end of 2009) is currently the highest it has been since the late 1940s. The debt briefly reached over 100% of GDP in the aftermath of World War II.
The President proposes the budget for the government to the congress, which can amend it before passing. The U. S. Constitution in Article 1, Section 7 grants exclusive right to originate revenue related bills to the House of Representatives; the President's proposals are an indication of spending desired, but it is the House which defines the spending through the final wording of the bills. Since the budget resolution is a “concurrent” congressional resolution, not an ordinary bill, it does not go to the President for his signature or veto. While this leaves substantial room for the legislature to change the deficit, congressional historian Louis Fisher observes that, "Congress rarely appropriates more than what the President requests." In the case of Nixon, who fought fiercely with Congress over the budget, he writes, "Congress was able to adhere to the President's totals while significantly altering his priorities."
| U.S. president | Party | Years | Start debt/GDP | End debt/GDP | Increase debt (in Billions of $) |
Increase debt/GDP (in percentage points) |
House Control (with # if split during term) |
Senate Control (with # if split during term) |
|---|---|---|---|---|---|---|---|---|
| Roosevelt | D | 1941–1945 | 50.4% | 117.5% | +203 | +67.1% | D | D |
| Roosevelt/Truman | D | 1945–1949 | 117.5% | 93.1% | -8 | -24.4% | 79th D, 80th R | 79th D, 80th R |
| Harry Truman | D | 1949–1953 | 93.1% | 71.4% | +13 | -21.7% | D | D |
| Dwight Eisenhower | R | 1953–1957 | 71.4% | 60.4% | +6 | -11.0% | 83rd R, 84th D | 83rd R, 84th D |
| Dwight Eisenhower | R | 1957–1961 | 60.4% | 55.2% | +20 | -5.2% | D | D |
| Kennedy John F. Kennedy John Fitzgerald "Jack" Kennedy , often referred to by his initials JFK, was the 35th President of the United States, serving from 1961 until his assassination in 1963.... /Johnson |
D | 1961–1965 | 55.2% | 46.9% | +30 | -8.3% | D | D |
| Lyndon Johnson | D | 1965–1969 | 46.9% | 38.6% | +43 | -8.3% | D | D |
| Richard Nixon Richard Nixon Richard Milhous Nixon was the 37th President of the United States, serving from 1969 to 1974. The only president to resign the office, Nixon had previously served as a US representative and senator from California and as the 36th Vice President of the United States from 1953 to 1961 under... |
R | 1969–1973 | 38.6% | 35.6% | +101 | -3.0% | D | D |
| Nixon Richard Nixon Richard Milhous Nixon was the 37th President of the United States, serving from 1969 to 1974. The only president to resign the office, Nixon had previously served as a US representative and senator from California and as the 36th Vice President of the United States from 1953 to 1961 under... /Ford Gerald Ford Gerald Rudolph "Jerry" Ford, Jr. was the 38th President of the United States, serving from 1974 to 1977, and the 40th Vice President of the United States serving from 1973 to 1974... |
R | 1973–1977 | 35.6% | 35.8% | +177 | +0.2% | D | D |
| Jimmy Carter Jimmy Carter James Earl "Jimmy" Carter, Jr. is an American politician who served as the 39th President of the United States and was the recipient of the 2002 Nobel Peace Prize, the only U.S. President to have received the Prize after leaving office... |
D | 1977–1981 | 35.8% | 32.5% | +288 | -3.3% | D | D |
| Ronald Reagan Ronald Reagan Ronald Wilson Reagan was the 40th President of the United States , the 33rd Governor of California and, prior to that, a radio, film and television actor.... |
R | 1981–1985 | 32.5% | 43.8% | +823 | +11.3% | D | R |
| Ronald Reagan Ronald Reagan Ronald Wilson Reagan was the 40th President of the United States , the 33rd Governor of California and, prior to that, a radio, film and television actor.... |
R | 1985–1989 | 43.8% | 53.1% | +1,050 | +9.3% | D | 99th R, 100th D |
| George H. W. Bush George H. W. Bush George Herbert Walker Bush is an American politician who served as the 41st President of the United States . He had previously served as the 43rd Vice President of the United States , a congressman, an ambassador, and Director of Central Intelligence.Bush was born in Milton, Massachusetts, to... |
R | 1989–1993 | 53.1% | 66.1% | +1,483 | +13.0% | D | D |
| Bill Clinton Bill Clinton William Jefferson "Bill" Clinton is an American politician who served as the 42nd President of the United States from 1993 to 2001. Inaugurated at age 46, he was the third-youngest president. He took office at the end of the Cold War, and was the first president of the baby boomer generation... |
D | 1993–1997 | 66.1% | 65.4% | +1,018 | -0.7% | 103rd D, 104th R | 103rd D, 104th R |
| Bill Clinton Bill Clinton William Jefferson "Bill" Clinton is an American politician who served as the 42nd President of the United States from 1993 to 2001. Inaugurated at age 46, he was the third-youngest president. He took office at the end of the Cold War, and was the first president of the baby boomer generation... |
D | 1997–2001 | 65.4% | 56.4% | +401 | -9.0% | R | R |
| George W. Bush George W. Bush George Walker Bush is an American politician who served as the 43rd President of the United States, from 2001 to 2009. Before that, he was the 46th Governor of Texas, having served from 1995 to 2000.... |
R | 2001–2005 | 56.4% | 63.5% | +2,135 | +7.1% | R | 107th Split, 108 R |
| George W. Bush George W. Bush George Walker Bush is an American politician who served as the 43rd President of the United States, from 2001 to 2009. Before that, he was the 46th Governor of Texas, having served from 1995 to 2000.... |
R | 2005–2009 | 63.5% | 84.2% | +4,521 | +20.7% | 109th R, 110th D | 109th R, 110th D |
| Barack Obama Barack Obama Barack Hussein Obama II is the 44th and current President of the United States. He is the first African American to hold the office. Obama previously served as a United States Senator from Illinois, from January 2005 until he resigned following his victory in the 2008 presidential election.Born in... |
D | 2009–2011 | 84.2% | 99.6% | +4,334 | +15.4% | 111th D, 112th R | D |
(Source: CBO Historical Budget Page and Whitehouse FY 2012 Budget - Table 7.1 Federal Debt at the End of Year PDF, Excel, Senate.gov)
Notes:
- For net jobs changes over the corresponding periods, see: Jobs created during U.S. presidential termsJobs created during U.S. presidential termsPoliticians and pundits frequently refer to the ability of the President of the United States to "create jobs" in the U.S. during his or her term in office. The numbers are most often seen during the election season or in regard to a President's economic legacy...
.
Public debt
United States public debt
The United States public debt is the money borrowed by the federal government of the United States at any one time through the issue of securities by the Treasury and other federal government agencies...
are different. Public debt is the gross debt minus intra-governmental obligations (such as the money that the government owes to the two Social Security Trust Fund
Social Security Trust Fund
In the United States, the Social Security Trust Fund is a fund operated by the Social Security Administration into which are paid contributions from workers and employers under the Social Security system and out of which benefit payments to retirees, survivors, and the disabled, and general...
s, the Old-Age, Survivors, and Disability Insurance
Social Security (United States)
In the United States, Social Security refers to the federal Old-Age, Survivors, and Disability Insurance program.The original Social Security Act and the current version of the Act, as amended encompass several social welfare and social insurance programs...
program, and the Social Security Disability Insurance
Social Security Disability Insurance
Social Security Disability Insurance is a payroll tax-funded, federal insurance program of the United States government. It is managed by the Social Security Administration and is designed to provide income supplements to people who are physically restricted in their ability to be employed...
program).
The figures show the trend in public debt with the background colored by the party controlling the executive and legislative branches of government. The color of the trend line does not represent party affiliation; only the background color does.
Federal spending, federal debt, and GDP
The table below shows the annual federal spending, gross federal debt, and gross domestic product for average presidential parties, specific presidential terms, and specific fiscal years. The Table Below is for Fiscal Years not Presidential Terms.| Fiscal Year | President | Party of President | Federal Spending | Federal Debt | Gross Domestic Product | Inflation Adjustor | ||||||
|---|---|---|---|---|---|---|---|---|---|---|---|---|
| Billions | Adjusted | Increase | Billions | Adjusted | Percentage Increase | Billions | Adjusted | Increase | ||||
| Yearly Average 1978-2009 |
Democratic | 2.4% | 1.0% | 3.0% | ||||||||
| Yearly Average 1978-2009 |
Republican | 3.0% | 7.3% | 2.5% | ||||||||
| 1978–1981 | Carter | Democratic | $678 | $1,219 | 17.2% | $994 | $1,787 | -0.4% | $3,055 | $5,492 | 9.4% | |
| 1982–1985 | Reagan | Republican | $946 | $1,396 | 14.5% | $1,817 | $2,680 | 49.0% | $4,142 | $6,108 | 11.2% | |
| 1986–1989 | Reagan | Republican | $1,144 | $1,499 | 7.4% | $2,867 | $3,757 | 40.2% | $5,401 | $7,077 | 15.9% | |
| 1990–1993 | Bush | Republican | $1,410 | $1,615 | 7.8% | $4,351 | $4,987 | 32.7% | $6,576 | $7,536 | 6.5% | |
| 1994–1997 | Clinton | Democratic | $1,601 | $1,684 | 4.3% | $5,369 | $5,647 | 13.2% | $8,182 | $8,606 | 14.2% | |
| 1998–2001 | Clinton | Democratic | $1,863 | $1,821 | 8.1% | $5,769 | $5,638 | -0.2% | $10,058 | $9,829 | 14.2% | |
| 2002–2005 | Bush | Republican | $2,472 | $2,165 | 18.9% | $7,905 | $6,923 | 22.8% | $12,238 | $10,717 | 9.0% | |
| 2006-2009* | Bush | Republican | $3,107 | $2,452 | 13.3% | $10,413 | $8,218 | 18.7% | $15,027 | $11,859 | 10.7% | |
| 1977 | Ford | Republican | $409 | $1,040 | $706 | $1,795 | $1,974 | $5,019 | 0.39 | |||
| 1978 | Carter | Democratic | $459 | $1,093 | 5.1% | $776 | $1,850 | 3.1% | $2,217 | $5,285 | 5.3% | 0.42 |
| 1979 | Carter | Democratic | $504 | $1,107 | 1.3% | $829 | $1,821 | -1.5% | $2,501 | $5,494 | 4.0% | 0.46 |
| 1980 | Carter | Democratic | $591 | $1,175 | 6.1% | $909 | $1,808 | -0.8% | $2,727 | $5,422 | -1.3% | 0.50 |
| 1981 | Carter | Democratic | $678 | $1,219 | 3.8% | $994 | $1,787 | -1.1% | $3,055 | $5,492 | 1.3% | 0.56 |
| 1982 | Reagan | Republican | $746 | $1,252 | 2.6% | $1,137 | $1,908 | 6.8% | $3,228 | $5,417 | -1.4% | 0.60 |
| 1983 | Reagan | Republican | $808 | $1,294 | 3.4% | $1,371 | $2,195 | 15.0% | $3,441 | $5,510 | 1.7% | 0.62 |
| 1984 | Reagan | Republican | $852 | $1,300 | 0.4% | $1,564 | $2,386 | 8.7% | $3,840 | $5,858 | 6.3% | 0.66 |
| 1985 | Reagan | Republican | $946 | $1,396 | 7.4% | $1,817 | $2,680 | 12.3% | $4,142 | $6,108 | 4.3% | 0.68 |
| 1986 | Reagan | Republican | $990 | $1,426 | 2.1% | $2,120 | $3,052 | 13.9% | $4,412 | $6,352 | 4.0% | 0.69 |
| 1987 | Reagan | Republican | $1,004 | $1,406 | -1.4% | $2,345 | $3,283 | 7.6% | $4,647 | $6,506 | 2.4% | 0.71 |
| 1988 | Reagan | Republican | $1,065 | $1,447 | 2.9% | $2,601 | $3,534 | 7.7% | $5,009 | $6,806 | 4.6% | 0.74 |
| 1989 | Reagan | Republican | $1,144 | $1,499 | 3.6% | $2,867 | $3,757 | 6.3% | $5,401 | $7,077 | 4.0% | 0.76 |
| 1990 | Bush | Republican | $1,253 | $1,590 | 6.1% | $3,206 | $4,067 | 8.3% | $5,735 | $7,277 | 2.8% | 0.79 |
| 1991 | Bush | Republican | $1,324 | $1,610 | 1.3% | $3,598 | $4,374 | 7.5% | $5,935 | $7,215 | -0.8% | 0.82 |
| 1992 | Bush | Republican | $1,382 | $1,624 | 0.9% | $4,001 | $4,703 | 7.5% | $6,240 | $7,334 | 1.7% | 0.85 |
| 1993 | Bush | Republican | $1,410 | $1,615 | -0.5% | $4,351 | $4,987 | 6.0% | $6,576 | $7,536 | 2.8% | 0.87 |
| 1994 | Clinton | Democratic | $1,462 | $1,642 | 1.7% | $4,643 | $5,216 | 4.6% | $6,961 | $7,820 | 3.8% | 0.89 |
| 1995 | Clinton | Democratic | $1,516 | $1,662 | 1.2% | $4,920 | $5,395 | 3.4% | $7,326 | $8,033 | 2.7% | 0.91 |
| 1996 | Clinton | Democratic | $1,561 | $1,673 | 0.7% | $5,181 | $5,554 | 3.0% | $7,694 | $8,248 | 2.7% | 0.93 |
| 1997 | Clinton | Democratic | $1,601 | $1,684 | 0.7% | $5,369 | $5,647 | 1.7% | $8,182 | $8,606 | 4.3% | 0.95 |
| 1998 | Clinton | Democratic | $1,653 | $1,721 | 2.2% | $5,478 | $5,704 | 1.0% | $8,628 | $8,985 | 4.4% | 0.96 |
| 1999 | Clinton | Democratic | $1,702 | $1,746 | 1.5% | $5,605 | $5,750 | 0.8% | $9,125 | $9,361 | 4.2% | 0.97 |
| 2000 | Clinton | Democratic | $1,789 | $1,789 | 2.5% | $5,628 | $5,628 | -2.1% | $9,710 | $9,710 | 3.7% | 1.00 |
| 2001 | Clinton | Democratic | $1,863 | $1,821 | 1.8% | $5,769 | $5,638 | 0.2% | $10,058 | $9,829 | 1.2% | 1.02 |
| 2002 | Bush | Republican | $2,011 | $1,929 | 6.0% | $6,198 | $5,945 | 5.5% | $10,377 | $9,954 | 1.3% | 1.04 |
| 2003 | Bush | Republican | $2,160 | $2,018 | 4.6% | $6,760 | $6,316 | 6.2% | $10,809 | $10,099 | 1.4% | 1.07 |
| 2004 | Bush | Republican | $2,293 | $2,082 | 3.2% | $7,354 | $6,677 | 5.7% | $11,500 | $10,441 | 3.4% | 1.10 |
| 2005 | Bush | Republican | $2,472 | $2,165 | 4.0% | $7,905 | $6,923 | 3.7% | $12,238 | $10,717 | 2.6% | 1.14 |
| 2006 | Bush | Republican | $2,655 | $2,249 | 3.9% | $8,451 | $7,158 | 3.4% | $13,016 | $11,024 | 2.9% | 1.18 |
| 2007 | Bush | Republican | $2,730 | $2,263 | 0.6% | $8,951 | $7,419 | 3.6% | $13,668 | $11,329 | 2.8% | 1.21 |
| 2008 | Bush | Republican | $2,931 | $2,366 | 4.6% | $9,654 | $7,793 | 5.0% | $14,312 | $11,553 | 0% | 1.24 |
| 2009* | Bush | Republican | $3,107 | $2,452 | 3.6% | $10,413 | $8,218 | 5.5% | $14,097 | $11,529 | 2.6% | 1.27 |
| 2010* | Obama | Democratic | $3,091 | $2,392 | -2.4% | $11,875 | $9,247 | 12.5% | $14,508 | $11,297 | -2.0% | 1.29 |
Notes
- The government fiscal year runs from October 1 (of the previous calendar year) to September 30. Budgets are enacted before the November general elections. This is why FY2001 falls under Clinton and FY2009 falls under G.W. Bush, they started in October 1, 2000 and October 1, 2008, respectively.
- The dollar amounts for each presidential term are taken from the last fiscal year in that term.
- The increase in each presidential term is the increase in the adjusted amount from the last fiscal year of the previous term to the last fiscal year of the current term.
- The value for each presidential party is the average of the values for all the presidents in that party.
- The values for the years 2009, and 2010 represent estimates from the source material.