
F-test
Encyclopedia
An F-test is any statistical test in which the test statistic
has an F-distribution under the null hypothesis
.
It is most often used when comparing statistical models
that have been fit to a data
set, in order to identify the model that best fits the population from which the data were sampled. Exact F-tests mainly arise when the models have been fit to the data using least squares
. The name was coined by George W. Snedecor
, in honour of Sir Ronald A. Fisher. Fisher initially developed the statistic as the variance ratio in the 1920s.
to non-normality. In the analysis of variance
(ANOVA), alternative tests include Levene's test
, Bartlett's test
, and the Brown–Forsythe test. However, when any of these tests are conducted to test the underlying assumption of homoscedasticity
(i.e. homogeneity of variance), as a preliminary step to testing for mean effects, there is an increase in the experiment-wise Type I error rate.
in a collection of data in terms of sums of squares
. The test statistic
in an F-test is the ratio of two scaled sums of squares reflecting different sources of variability. These sums of squares are constructed so that the statistic tends to be greater when the null hypothesis is not true. In order for the statistic to follow the F-distribution under the null hypothesis, the sums of squares should be statistically independent, and each should follow a scaled chi-squared distribution. The latter condition is guaranteed if the data values are independent and normally distributed with a common variance
.
s of a quantitative variable within several pre-defined groups differ from each other. For example, suppose that a medical trial compares four treatments. The ANOVA F-test can be used to assess whether any of the treatments is on average superior, or inferior, to the others versus the null hypothesis that all four treatments yield the same mean response. This is an example of an "omnibus" test, meaning that a single test is performed to detect any of several possible differences. Alternatively, we could carry out pairwise tests among the treatments (for instance, in the medical trial example with four treatments we could carry out six tests among pairs of treatments). The advantage of the ANOVA F-test is that we do not need to pre-specify which treatments are to be compared, and we do not need to adjust for making multiple comparisons
. The disadvantage of the ANOVA F-test is that if we reject the null hypothesis
, we do not know which treatments can be said to be significantly different from the others — if the F-test is performed at level α we cannot state that the treatment pair with the greatest mean difference is significantly different at level α.
The formula for the one-way ANOVA F-test statistic
is

or

The "explained variance", or "between-group variability" is

where denotes the sample mean
in the ith group, ni is the number of observations in the ith group, and denotes the overall mean of the data.
The "unexplained variance", or "within-group variability" is

where Yij is the jth observation in the ith out of K groups and N is the overall sample size. This F-statistic follows the F-distribution with K − 1, N −K degrees of freedom under the null hypothesis. The statistic will be large if the between-group variability is large relative to the within-group variability, which is unlikely to happen if the population means
of the groups all have the same value.
Note that when there are only two groups for the one-way ANOVA F-test, F = t2
where t is the Student's t statistic
.
If there are n data points to estimate parameters of both models from, then one can calculate the F statistic (coefficient of determination), given by

where RSSi is the residual sum of squares
of model i. If your regression model has been calculated with weights, then replace RSSi with χ2, the weighted sum of squared residuals. Under the null hypothesis that model 2 does not provide a significantly better fit than model 1, F will have an F distribution, with (p2 − p1, n − p2) degrees of freedom
. The null hypothesis is rejected if the F calculated from the data is greater than the critical value of the F distribution for some desired false-rejection probability (e.g. 0.05). The F-test is a Wald test.
The null hypothesis, denoted H0, for the overall F-test for this experiment would be that all three levels of the factor produce the same response, on average. To calculate the F-ratio:
Step 1: Calculate the mean within each group:
Test statistic
In statistical hypothesis testing, a hypothesis test is typically specified in terms of a test statistic, which is a function of the sample; it is considered as a numerical summary of a set of data that...
has an F-distribution under the null hypothesis
Null hypothesis
The practice of science involves formulating and testing hypotheses, assertions that are capable of being proven false using a test of observed data. The null hypothesis typically corresponds to a general or default position...
.
It is most often used when comparing statistical models
Model selection
Model selection is the task of selecting a statistical model from a set of candidate models, given data. In the simplest cases, a pre-existing set of data is considered...
that have been fit to a data
Data
The term data refers to qualitative or quantitative attributes of a variable or set of variables. Data are typically the results of measurements and can be the basis of graphs, images, or observations of a set of variables. Data are often viewed as the lowest level of abstraction from which...
set, in order to identify the model that best fits the population from which the data were sampled. Exact F-tests mainly arise when the models have been fit to the data using least squares
Least squares
The method of least squares is a standard approach to the approximate solution of overdetermined systems, i.e., sets of equations in which there are more equations than unknowns. "Least squares" means that the overall solution minimizes the sum of the squares of the errors made in solving every...
. The name was coined by George W. Snedecor
George W. Snedecor
George Waddel Snedecor was an American mathematician and statistician. He contributed to the foundations of analysis of variance, data analysis, experimental design, and statistical methodology. Snedecor's F distribution and the George W...
, in honour of Sir Ronald A. Fisher. Fisher initially developed the statistic as the variance ratio in the 1920s.
Common examples of F-tests
Examples of F-tests include:- The hypothesis that the means of several normally distributed populations, all having the same standard deviationStandard deviationStandard deviation is a widely used measure of variability or diversity used in statistics and probability theory. It shows how much variation or "dispersion" there is from the average...
, are equal. This is perhaps the best-known F-test, and plays an important role in the analysis of varianceAnalysis of varianceIn statistics, analysis of variance is a collection of statistical models, and their associated procedures, in which the observed variance in a particular variable is partitioned into components attributable to different sources of variation...
(ANOVA).
- The hypothesis that a proposed regression model fits the dataDataThe term data refers to qualitative or quantitative attributes of a variable or set of variables. Data are typically the results of measurements and can be the basis of graphs, images, or observations of a set of variables. Data are often viewed as the lowest level of abstraction from which...
well. See Lack-of-fit sum of squaresLack-of-fit sum of squaresIn statistics, a sum of squares due to lack of fit, or more tersely a lack-of-fit sum of squares, is one of the components of a partition of the sum of squares in an analysis of variance, used in the numerator in an F-test of the null hypothesis that says that a proposed model fits well.- Sketch of...
.
- The hypothesis that a data set in a regression analysisRegression analysisIn statistics, regression analysis includes many techniques for modeling and analyzing several variables, when the focus is on the relationship between a dependent variable and one or more independent variables...
follows the simpler of two proposed linear models that are nested within each other.
- Scheffé's methodScheffé's methodIn statistics, Scheffé's method, named after Henry Scheffé, is a method for adjusting significance levels in a linear regression analysis to account for multiple comparisons...
for multiple comparisons adjustment in linear models.
F-test of the equality of two variances
This F-test is extremely sensitiveRobust statistics
Robust statistics provides an alternative approach to classical statistical methods. The motivation is to produce estimators that are not unduly affected by small departures from model assumptions.- Introduction :...
to non-normality. In the analysis of variance
Analysis of variance
In statistics, analysis of variance is a collection of statistical models, and their associated procedures, in which the observed variance in a particular variable is partitioned into components attributable to different sources of variation...
(ANOVA), alternative tests include Levene's test
Levene's test
In statistics, Levene's test is an inferential statistic used to assess the equality of variances in different samples. Some common statistical procedures assume that variances of the populations from which different samples are drawn are equal. Levene's test assesses this assumption. It tests the...
, Bartlett's test
Bartlett's test
In statistics, Bartlett's test is used to test if k samples are from populations with equal variances. Equal variances across samples is called homoscedasticity or homogeneity of variances. Some statistical tests, for example the analysis of variance, assume that variances are equal across groups...
, and the Brown–Forsythe test. However, when any of these tests are conducted to test the underlying assumption of homoscedasticity
Homoscedasticity
In statistics, a sequence or a vector of random variables is homoscedastic if all random variables in the sequence or vector have the same finite variance. This is also known as homogeneity of variance. The complementary notion is called heteroscedasticity...
(i.e. homogeneity of variance), as a preliminary step to testing for mean effects, there is an increase in the experiment-wise Type I error rate.
Formula and calculation
Most F-tests arise by considering a decomposition of the variabilityVariance
In probability theory and statistics, the variance is a measure of how far a set of numbers is spread out. It is one of several descriptors of a probability distribution, describing how far the numbers lie from the mean . In particular, the variance is one of the moments of a distribution...
in a collection of data in terms of sums of squares
Sum of squares
The partition of sums of squares is a concept that permeates much of inferential statistics and descriptive statistics. More properly, it is the partitioning of sums of squared deviations or errors. Mathematically, the sum of squared deviations is an unscaled, or unadjusted measure of dispersion...
. The test statistic
Test statistic
In statistical hypothesis testing, a hypothesis test is typically specified in terms of a test statistic, which is a function of the sample; it is considered as a numerical summary of a set of data that...
in an F-test is the ratio of two scaled sums of squares reflecting different sources of variability. These sums of squares are constructed so that the statistic tends to be greater when the null hypothesis is not true. In order for the statistic to follow the F-distribution under the null hypothesis, the sums of squares should be statistically independent, and each should follow a scaled chi-squared distribution. The latter condition is guaranteed if the data values are independent and normally distributed with a common variance
Variance
In probability theory and statistics, the variance is a measure of how far a set of numbers is spread out. It is one of several descriptors of a probability distribution, describing how far the numbers lie from the mean . In particular, the variance is one of the moments of a distribution...
.
Multiple-comparison ANOVA problems
The F-test in one-way analysis of variance is used to assess whether the expected valueExpected value
In probability theory, the expected value of a random variable is the weighted average of all possible values that this random variable can take on...
s of a quantitative variable within several pre-defined groups differ from each other. For example, suppose that a medical trial compares four treatments. The ANOVA F-test can be used to assess whether any of the treatments is on average superior, or inferior, to the others versus the null hypothesis that all four treatments yield the same mean response. This is an example of an "omnibus" test, meaning that a single test is performed to detect any of several possible differences. Alternatively, we could carry out pairwise tests among the treatments (for instance, in the medical trial example with four treatments we could carry out six tests among pairs of treatments). The advantage of the ANOVA F-test is that we do not need to pre-specify which treatments are to be compared, and we do not need to adjust for making multiple comparisons
Multiple comparisons
In statistics, the multiple comparisons or multiple testing problem occurs when one considers a set of statistical inferences simultaneously. Errors in inference, including confidence intervals that fail to include their corresponding population parameters or hypothesis tests that incorrectly...
. The disadvantage of the ANOVA F-test is that if we reject the null hypothesis
Null hypothesis
The practice of science involves formulating and testing hypotheses, assertions that are capable of being proven false using a test of observed data. The null hypothesis typically corresponds to a general or default position...
, we do not know which treatments can be said to be significantly different from the others — if the F-test is performed at level α we cannot state that the treatment pair with the greatest mean difference is significantly different at level α.
The formula for the one-way ANOVA F-test statistic
Test statistic
In statistical hypothesis testing, a hypothesis test is typically specified in terms of a test statistic, which is a function of the sample; it is considered as a numerical summary of a set of data that...
is
or
The "explained variance", or "between-group variability" is
where
denotes the sample meanAverage
In mathematics, an average, or central tendency of a data set is a measure of the "middle" value of the data set. Average is one form of central tendency. Not all central tendencies should be considered definitions of average....
in the ith group, ni is the number of observations in the ith group, and
denotes the overall mean of the data.The "unexplained variance", or "within-group variability" is
where Yij is the jth observation in the ith out of K groups and N is the overall sample size. This F-statistic follows the F-distribution with K − 1, N −K degrees of freedom under the null hypothesis. The statistic will be large if the between-group variability is large relative to the within-group variability, which is unlikely to happen if the population means
Expected value
In probability theory, the expected value of a random variable is the weighted average of all possible values that this random variable can take on...
of the groups all have the same value.
Note that when there are only two groups for the one-way ANOVA F-test, F = t2
where t is the Student's t statistic
Student's t-test
A t-test is any statistical hypothesis test in which the test statistic follows a Student's t distribution if the null hypothesis is supported. It is most commonly applied when the test statistic would follow a normal distribution if the value of a scaling term in the test statistic were known...
.
Regression problems
Consider two models, 1 and 2, where model 1 is 'nested' within model 2. Model 1 is the Restricted model, and model two is the Unrestricted one. That is, model 1 has p1 parameters, and model 2 has p2 parameters, where p2 > p1, and for any choice of parameters in model 1, the same regression curve can be achieved by some choice of the parameters of model 2. (We use the convention that any constant parameter in a model is included when counting the parameters. For instance, the simple linear model y = mx + b has p = 2 under this convention.) The model with more parameters will always be able to fit the data at least as well as the model with fewer parameters. Thus typically model 2 will give a better (i.e. lower error) fit to the data than model 1. But one often wants to determine whether model 2 gives a significantly better fit to the data. One approach to this problem is to use an F test.If there are n data points to estimate parameters of both models from, then one can calculate the F statistic (coefficient of determination), given by
where RSSi is the residual sum of squares
Residual sum of squares
In statistics, the residual sum of squares is the sum of squares of residuals. It is also known as the sum of squared residuals or the sum of squared errors of prediction . It is a measure of the discrepancy between the data and an estimation model...
of model i. If your regression model has been calculated with weights, then replace RSSi with χ2, the weighted sum of squared residuals. Under the null hypothesis that model 2 does not provide a significantly better fit than model 1, F will have an F distribution, with (p2 − p1, n − p2) degrees of freedom
Degrees of freedom (statistics)
In statistics, the number of degrees of freedom is the number of values in the final calculation of a statistic that are free to vary.Estimates of statistical parameters can be based upon different amounts of information or data. The number of independent pieces of information that go into the...
. The null hypothesis is rejected if the F calculated from the data is greater than the critical value of the F distribution for some desired false-rejection probability (e.g. 0.05). The F-test is a Wald test.
One-way ANOVA example
Consider an experiment to study the effect of three different levels of a factor on a response (e.g. three levels of a fertilizer on plant growth). If we had 6 observations for each level, we could write the outcome of the experiment in a table like this, where a1, a2, and a3 are the three levels of the factor being studied.| a1 | a2 | a3 |
|---|---|---|
| 6 | 8 | 13 |
| 8 | 12 | 9 |
| 4 | 9 | 11 |
| 5 | 11 | 8 |
| 3 | 6 | 7 |
| 4 | 8 | 12 |
The null hypothesis, denoted H0, for the overall F-test for this experiment would be that all three levels of the factor produce the same response, on average. To calculate the F-ratio:
Step 1: Calculate the mean within each group:
-

Step 2: Calculate the overall mean:
- where a is the number of groups.
Step 3: Calculate the "between-group" sum of squares:
-

where n is the number of data values per group.
The between-group degrees of freedom is one less than the number of groups
so the between-group mean square value is
Step 4: Calculate the "within-group" sum of squares. Begin by centering the data in each group
a1 a2 a3 6 − 5 = 1 8 − 9 = -1 13 − 10 = 3 8 − 5 = 3 12 − 9 = 3 9 − 10 = -1 4 − 5 = -1 9 − 9 = 0 11 − 10 = 1 5 − 5 = 0 11 − 9 = 2 8 − 10 = -2 3 − 5 = -2 6 − 9 = -3 7 − 10 = -3 4 − 5 = -1 8 − 9 = -1 12 − 10 = 2
The within-group sum of squares is the sum of squares of all 18 values in this table
-

The within-group degrees of freedom is
Thus the within-group mean square value is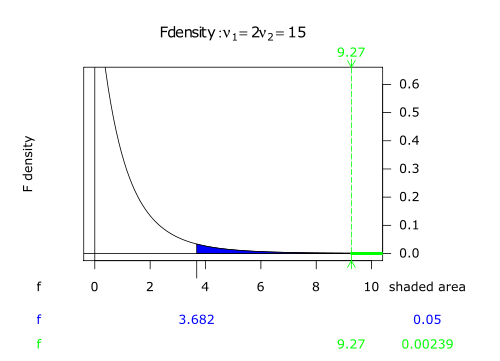

Step 5: The F-ratio is
The critical value is the number that the test statistic must exceed to reject the test. In this case, Fcrit(2,15) = 3.68 at α = 0.05. Since F = 9.3 > 3.68, the results are significantStatistical significanceIn statistics, a result is called statistically significant if it is unlikely to have occurred by chance. The phrase test of significance was coined by Ronald Fisher....
at the 5% significance level. One would reject the null hypothesis, concluding that there is strong evidence that the expected values in the three groups differ. The p-valueP-valueIn statistical significance testing, the p-value is the probability of obtaining a test statistic at least as extreme as the one that was actually observed, assuming that the null hypothesis is true. One often "rejects the null hypothesis" when the p-value is less than the significance level α ,...
for this test is 0.002.
After performing the F-test, it is common to carry out some "post-hoc" analysis of the group means. In this case, the first two group means differ by 4 units, the first and third group means differ by 5 units, and the second and third group means differ by only 1 unit. The standard error of each of these differences is . Thus the first group is strongly different from the other groups, as the mean difference is more times the standard error, so we can be highly confident that the population meanExpected valueIn probability theory, the expected value of a random variable is the weighted average of all possible values that this random variable can take on...
of the first group differs from the population means of the other groups. However there is no evidence that the second and third groups have different population means from each other, as their mean difference of one unit is comparable to the standard error.
Note F(x, y) denotes an F-distribution with x degrees of freedom in the numerator and y degrees of freedom in the denominator.
ANOVA's robustness with respect to Type I errors for departures from population normality
The oneway ANOVA can be generalized to the factorial and multivariate layouts, as well as to the analysis of covariance. None of these F-tests, however, are robustRobust statisticsRobust statistics provides an alternative approach to classical statistical methods. The motivation is to produce estimators that are not unduly affected by small departures from model assumptions.- Introduction :...
when there are severe violations of the assumption that each population follows the normal distribution, particularly for small alpha levels and unbalanced layouts. Furthermore, if the underlying assumption of homoscedasticity is violated, the Type I error properties degenerate much more severely. For nonparametric alternatives in the factorial layout, see Sawilowsky. For more discussion see ANOVA on ranks.
External links
-
-
-


