

Phase portrait
Encyclopedia
A phase portrait is a geometric representation of the trajectories of a dynamical system
Dynamical system
A dynamical system is a concept in mathematics where a fixed rule describes the time dependence of a point in a geometrical space. Examples include the mathematical models that describe the swinging of a clock pendulum, the flow of water in a pipe, and the number of fish each springtime in a...
in the phase plane
Phase plane
A phase plane is a visual display of certain characteristics of certain kinds of differential equations; it is a 2-dimensional version of the general n-dimensional phase space....
. Each set of initial conditions is representated by a different curve, or point.
Phase portraits are an invaluable tool in studying dynamical systems. They consist of a plot
Plot (graphics)
A plot is a graphical technique for representing a data set, usually as a graph showing the relationship between two or more variables. The plot can be drawn by hand or by a mechanical or electronic plotter. Graphs are a visual representation of the relationship between variables, very useful for...
of typical trajectories in the state space
State space
In the theory of discrete dynamical systems, a state space is a directed graph where each possible state of a dynamical system is represented by a vertex, and there is a directed edge from a to b if and only if ƒ = b where the function f defines the dynamical system.State spaces are...
. This reveals information such as whether an attractor
Attractor
An attractor is a set towards which a dynamical system evolves over time. That is, points that get close enough to the attractor remain close even if slightly disturbed...
, a repellor or limit cycle is present for the chosen parameter value. The concept of topological equivalence is important in classifying the behaviour of systems by specifying when two different phase portraits represent the same qualitative dynamic behavior.
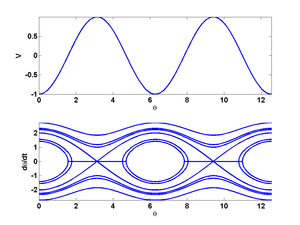
A phase portrait graph of a dynamical system depicts the system's trajectories (with arrows) and stable steady states (with dots) and unstable steady states (with circles) in a state space. The axes are of state variables.
Examples
- Simple pendulum see picture (right).
- Simple Harmonic Oscillator where the phase portrait is made up of ellipses centred at the origin, which is a fixed point.
- Van der Pol oscillator see picture (right).
- Bifurcation diagramBifurcation diagramIn mathematics, particularly in dynamical systems, a bifurcation diagram shows the possible long-term values of a system as a function of a bifurcation parameter in the system...
- Mandelbrot setMandelbrot setThe Mandelbrot set is a particular mathematical set of points, whose boundary generates a distinctive and easily recognisable two-dimensional fractal shape...