

Paired difference test
Encyclopedia
In statistics
, a paired difference test is a type of location test
that is used when comparing two sets of measurements to assess whether their population means
differ. A paired difference test uses additional information about the sample
that is not present in an ordinary unpaired testing situation, either to increase the statistical power
, or to reduce the effects of confounders.
Specific methods for carrying out paired difference tests are the paired t-test and the paired Z-test
.
The most familiar example of a paired difference test occurs when subjects are measured before and after a treatment. Such a "repeated measures" test compares these measurements within subjects, rather than across subjects, and will generally have greater power than an unpaired test.
. To illustrate the idea, suppose we are assessing the performance of a drug for treating high cholesterol. Under the design of our study, we enroll 100 subjects, and measure each subject's cholesterol level. Then all the subjects are treated with the drug for six months, after which their cholesterol levels are measured again. Our interest is in whether the drug has any effect on mean cholesterol levels, which can be inferred through a comparison of the post-treatment to pre-treatment measurements.
The key issue that motivates the paired difference test is that unless the study has very strict entry criteria, it is likely that the subjects will differ substantially from each other before the treatment begins. Important baseline differences among the subjects may be due to their gender, age, smoking status, activity level, and diet.
There are two natural approaches to analyzing these data:
If we only consider the means, the paired and unpaired approaches give the same result. To see this, let Yi1, Yi2 be the observed data for the ith pair, and let Di = Yi2 − Yi1. Also let D, Y1, and Y2 denote, respectively, the sample means
of the Di, the Yi1, and the Yi2. By rearranging terms we can see that

where n is the number of pairs. Thus the mean difference between the groups does not depend on whether we organize the data as pairs.
Although the mean difference is the same for the paired and unpaired statistics, their statistical significance levels can be very different, because it is easy to overstate the variance
of the unpaired statistic. The variance of D is
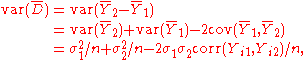
where σ1 and σ2 are the population standard deviations of the Yi1 and Yi2 data, respectively. Thus the variance of D is lower if there is positive correlation
within each pair. Such correlation is very common in the repeated measures setting, since many factors influencing the value being compared are unaffected by the treatment. For example, if cholesterol levels are associated with age, the effect of age will lead to positive correlations between the cholesterol levels measured within subjects, as long as the duration of the study is small relative to the variation in ages in the sample.
to analyze the data, where the variances of the pre-treatment and post-treatment data σ12 and σ22 are known (the situation with a t-test is similar). The unpaired Z-test statistic is

The power of the unpaired, one-sided
test carried out at level α = 0.05 can be calculated as follows:
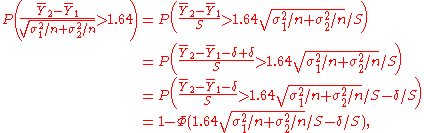
where S is the standard deviation of D, Φ is the standard normal cumulative distribution function
, and δ = EY2 − EY1 is the true effect of the treatment. The constant 1.64 is the 95th percentile of the standard normal distribution, which defines the rejection region of the test.
By a similar calculation, the power of the paired Z-test is

By comparing the expressions for power of the paired and unpaired tests, one can see that the paired test has more power as long as
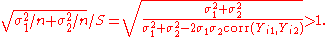
This condition is met whenever the within-pairs covariance is positive.
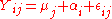
where αi is a random effect that is shared between the two values in the pair, and εij is a random noise term that is independent across all data points. The constant values μ1, μ2 are the expected value
s of the two measurements being compared, and our interest is in δ = μ2 − μ1.
In this model, the αi capture "stable confounders" that have the same effect on the pre-treatment and post-treatment measurements. When we subtract to form Di, the αi cancel out, so do not contribute to the variance. The within-pairs covariance is

This is non-negative, so it leads to better performance for the paired difference test compared to the unpaired test, unless the αi are constant over i, in which case the paired and unpaired tests are equivalent.
In less mathematical terms, the unpaired test assumes that the data in the two groups being compared are independent. This assumption determines the form for the variance of D. However when two measurements are made for each subject, it is unlikely that the two measurements are independent. If the two measurements within a subject are positively correlated, the unpaired test overstates the variance of D, making it a conservative test in the sense that its actual type I error
probability will be lower than the nominal level, with a corresponding loss of statistical power. In rare cases, the data may be negatively correlated within subjects, in which case the unpaired test becomes anti-conservative. The paired test is generally used when repeated measurements are made on the same subjects, since it has the correct level regardless of the correlation of the measurements within pairs.
, with the goal being to isolate the effect of one factor of interest from the effects of other factors that may play a role. For example, suppose teachers adopt one of two different approaches, denoted "A" and "B", to teaching a particular mathematical topic. We may be interested in whether the performances of the students on a standardized mathematics test differs according to the teaching approach. If the teachers are free to adopt approach A or approach B, it is possible that teachers whose students are already performing well in mathematics will preferentially choose method A (or vice-versa). In this situation, a simple comparison between the mean performances of students taught with approach A and approach B will likely show a difference, but this difference is partially or entirely due to the pre-existing differences between the two groups of students. In this situation, the baseline abilities of the students serve as a confounding variable, in that they are related to both the outcome (performance on the standardized test), and to the treatment assignment to approach A or approach B.
It is possible to reduce, but not necessarily eliminate, the effects of confounding variables by forming "artificial pairs" and performing a pairwise difference test. These artificial pairs are constructed based on additional variables that are thought to serve as confounders. By pairing students whose values on the confounding variables are similar, a greater fraction of the difference in the value of interest (e.g. the standardized test score in the example discussed above), is due to the factor of interest, and a lesser fraction is due to the confounder. Forming artificial pairs for paired difference testing is an example of a general approach for reducing the effects of confounding when making comparisons using observational data called matching
.
As a concrete example, suppose we observe student test scores X under teaching strategies A and B, and each student has either a "high" or "low" level of mathematical knowledge before the two teaching strategies are implemented. However, we do not know which students are in the "high" category and which are in the "low" category. The population mean
test scores in the four possible groups are
and the proportions of students in the groups are
where pHA + pHB + pLA + pLB = 1.
The "treatment difference" among students in the "high" group is μHA − μHB and the treatment difference among students in the "low" group is μLA − μLB. In general, it is possible that the two teaching strategies could differ in either direction, or show no difference, and the effects could differ in magnitude or even in sign between the "high" and "low" groups. For example, if strategy B were superior to strategy A for well-prepared students, but strategy A were superior to strategy B for poorly-prepared students, the two treatment differences would have opposite signs.
Since we do not know the baseline levels of the students, the expected value of the average test score XA among students in the A group is an average of those in the two baseline levels:

and similarly the average test score XB among students in the B group is

Thus the expected value of the observed treatment difference D = XA − XB is

A reasonable null hypothesis
is that there is no effect of the treatment within either the "high" or "low" student groups, so that μHA = μHB and μLA = μLB. Under this null hypothesis, the expected value of D will be zero if

and

This condition asserts that the assignment of students to the A and B teaching strategy groups is independent of their mathematical knowledge before the teaching strategies are implemented. If this holds, baseline mathematical knowledge is not a confounder, and conversely, if baseline mathematical knowledge is a confounder, the expected value of D will generally differ from zero. If the expected value of D under the null hypothesis is not equal to zero, then a situation where we reject the null hypothesis could either be due to an actual differential effect between teaching strategies A and B, or it could be due to non-independence in the assignment of students to the A and B groups (even in the complete absence of an effect due to the teaching strategy).
This example illustrates that if we make a direct comparison between two groups when confounders are present, we do not know whether any difference that is observed is due to the grouping itself, or is due to some other factor. If we are able to pair students by an exact or estimated measure of their baseline mathematical ability, then we are only comparing students "within rows" of the table of means given above. Consequently, if the null hypothesis holds, the expected value of D will equal zero, and statistical significance
levels have their intended interpretation.
Statistics
Statistics is the study of the collection, organization, analysis, and interpretation of data. It deals with all aspects of this, including the planning of data collection in terms of the design of surveys and experiments....
, a paired difference test is a type of location test
Location test
A location test is a statistical hypothesis test that compares the location parameter of a statistical population to a given constant, or that compares the location parameters of two statistical populations to each other...
that is used when comparing two sets of measurements to assess whether their population means
Expected value
In probability theory, the expected value of a random variable is the weighted average of all possible values that this random variable can take on...
differ. A paired difference test uses additional information about the sample
Sample (statistics)
In statistics, a sample is a subset of a population. Typically, the population is very large, making a census or a complete enumeration of all the values in the population impractical or impossible. The sample represents a subset of manageable size...
that is not present in an ordinary unpaired testing situation, either to increase the statistical power
Statistical power
The power of a statistical test is the probability that the test will reject the null hypothesis when the null hypothesis is actually false . The power is in general a function of the possible distributions, often determined by a parameter, under the alternative hypothesis...
, or to reduce the effects of confounders.
Specific methods for carrying out paired difference tests are the paired t-test and the paired Z-test
Z-test
A Z-test is any statistical test for which the distribution of the test statistic under the null hypothesis can be approximated by a normal distribution. Due to the central limit theorem, many test statistics are approximately normally distributed for large samples...
.
The most familiar example of a paired difference test occurs when subjects are measured before and after a treatment. Such a "repeated measures" test compares these measurements within subjects, rather than across subjects, and will generally have greater power than an unpaired test.
Use in reducing variance
Paired difference tests for reducing variance are a specific type of blockingBlocking (statistics)
In the statistical theory of the design of experiments, blocking is the arranging of experimental units in groups that are similar to one another. For example, an experiment is designed to test a new drug on patients. There are two levels of the treatment, drug, and placebo, administered to male...
. To illustrate the idea, suppose we are assessing the performance of a drug for treating high cholesterol. Under the design of our study, we enroll 100 subjects, and measure each subject's cholesterol level. Then all the subjects are treated with the drug for six months, after which their cholesterol levels are measured again. Our interest is in whether the drug has any effect on mean cholesterol levels, which can be inferred through a comparison of the post-treatment to pre-treatment measurements.
The key issue that motivates the paired difference test is that unless the study has very strict entry criteria, it is likely that the subjects will differ substantially from each other before the treatment begins. Important baseline differences among the subjects may be due to their gender, age, smoking status, activity level, and diet.
There are two natural approaches to analyzing these data:
- In an "unpaired analysis", the data are treated as if the study design had actually been to enroll 200 subjects, followed by random assignment of 100 subjects to each of the treatment and control groups. The treatment group in the unpaired design would be viewed as analogous to the post-treatment measurements in the paired design, and the control group would be viewed as analogous to the pre-treatment measurements. We could then calculate the sample means within the treated and untreated groups of subjects, and compare these means to each other.
- In a "paired difference analysis", we would first subtract the pre-treatment value from the post-treatment value for each subject, then compare these differences to zero.
If we only consider the means, the paired and unpaired approaches give the same result. To see this, let Yi1, Yi2 be the observed data for the ith pair, and let Di = Yi2 − Yi1. Also let D, Y1, and Y2 denote, respectively, the sample means
Average
In mathematics, an average, or central tendency of a data set is a measure of the "middle" value of the data set. Average is one form of central tendency. Not all central tendencies should be considered definitions of average....
of the Di, the Yi1, and the Yi2. By rearranging terms we can see that
where n is the number of pairs. Thus the mean difference between the groups does not depend on whether we organize the data as pairs.
Although the mean difference is the same for the paired and unpaired statistics, their statistical significance levels can be very different, because it is easy to overstate the variance
Variance
In probability theory and statistics, the variance is a measure of how far a set of numbers is spread out. It is one of several descriptors of a probability distribution, describing how far the numbers lie from the mean . In particular, the variance is one of the moments of a distribution...
of the unpaired statistic. The variance of D is
where σ1 and σ2 are the population standard deviations of the Yi1 and Yi2 data, respectively. Thus the variance of D is lower if there is positive correlation
Correlation
In statistics, dependence refers to any statistical relationship between two random variables or two sets of data. Correlation refers to any of a broad class of statistical relationships involving dependence....
within each pair. Such correlation is very common in the repeated measures setting, since many factors influencing the value being compared are unaffected by the treatment. For example, if cholesterol levels are associated with age, the effect of age will lead to positive correlations between the cholesterol levels measured within subjects, as long as the duration of the study is small relative to the variation in ages in the sample.
Power of the paired Z-test
Suppose we are using a Z-testZ-test
A Z-test is any statistical test for which the distribution of the test statistic under the null hypothesis can be approximated by a normal distribution. Due to the central limit theorem, many test statistics are approximately normally distributed for large samples...
to analyze the data, where the variances of the pre-treatment and post-treatment data σ12 and σ22 are known (the situation with a t-test is similar). The unpaired Z-test statistic is
The power of the unpaired, one-sided
Two-tailed test
The two-tailed test is a statistical test used in inference, in which a given statistical hypothesis, H0 , will be rejected when the value of the test statistic is either sufficiently small or sufficiently large...
test carried out at level α = 0.05 can be calculated as follows:
where S is the standard deviation of D, Φ is the standard normal cumulative distribution function
Cumulative distribution function
In probability theory and statistics, the cumulative distribution function , or just distribution function, describes the probability that a real-valued random variable X with a given probability distribution will be found at a value less than or equal to x. Intuitively, it is the "area so far"...
, and δ = EY2 − EY1 is the true effect of the treatment. The constant 1.64 is the 95th percentile of the standard normal distribution, which defines the rejection region of the test.
By a similar calculation, the power of the paired Z-test is
By comparing the expressions for power of the paired and unpaired tests, one can see that the paired test has more power as long as
This condition is met whenever the within-pairs covariance is positive.
A random effects model for paired testing
The following statistical model is useful for understanding the paired difference testwhere αi is a random effect that is shared between the two values in the pair, and εij is a random noise term that is independent across all data points. The constant values μ1, μ2 are the expected value
Expected value
In probability theory, the expected value of a random variable is the weighted average of all possible values that this random variable can take on...
s of the two measurements being compared, and our interest is in δ = μ2 − μ1.
In this model, the αi capture "stable confounders" that have the same effect on the pre-treatment and post-treatment measurements. When we subtract to form Di, the αi cancel out, so do not contribute to the variance. The within-pairs covariance is
This is non-negative, so it leads to better performance for the paired difference test compared to the unpaired test, unless the αi are constant over i, in which case the paired and unpaired tests are equivalent.
In less mathematical terms, the unpaired test assumes that the data in the two groups being compared are independent. This assumption determines the form for the variance of D. However when two measurements are made for each subject, it is unlikely that the two measurements are independent. If the two measurements within a subject are positively correlated, the unpaired test overstates the variance of D, making it a conservative test in the sense that its actual type I error
Type I and type II errors
In statistical test theory the notion of statistical error is an integral part of hypothesis testing. The test requires an unambiguous statement of a null hypothesis, which usually corresponds to a default "state of nature", for example "this person is healthy", "this accused is not guilty" or...
probability will be lower than the nominal level, with a corresponding loss of statistical power. In rare cases, the data may be negatively correlated within subjects, in which case the unpaired test becomes anti-conservative. The paired test is generally used when repeated measurements are made on the same subjects, since it has the correct level regardless of the correlation of the measurements within pairs.
Use in reducing confounding
Another application of paired difference testing arises when comparing two groups in a set of observational dataObservational study
In epidemiology and statistics, an observational study draws inferences about the possible effect of a treatment on subjects, where the assignment of subjects into a treated group versus a control group is outside the control of the investigator...
, with the goal being to isolate the effect of one factor of interest from the effects of other factors that may play a role. For example, suppose teachers adopt one of two different approaches, denoted "A" and "B", to teaching a particular mathematical topic. We may be interested in whether the performances of the students on a standardized mathematics test differs according to the teaching approach. If the teachers are free to adopt approach A or approach B, it is possible that teachers whose students are already performing well in mathematics will preferentially choose method A (or vice-versa). In this situation, a simple comparison between the mean performances of students taught with approach A and approach B will likely show a difference, but this difference is partially or entirely due to the pre-existing differences between the two groups of students. In this situation, the baseline abilities of the students serve as a confounding variable, in that they are related to both the outcome (performance on the standardized test), and to the treatment assignment to approach A or approach B.
It is possible to reduce, but not necessarily eliminate, the effects of confounding variables by forming "artificial pairs" and performing a pairwise difference test. These artificial pairs are constructed based on additional variables that are thought to serve as confounders. By pairing students whose values on the confounding variables are similar, a greater fraction of the difference in the value of interest (e.g. the standardized test score in the example discussed above), is due to the factor of interest, and a lesser fraction is due to the confounder. Forming artificial pairs for paired difference testing is an example of a general approach for reducing the effects of confounding when making comparisons using observational data called matching
Matching (statistics)
Matching is a statistical technique which is used to evaluate the effect of a treatment by comparing the treated and the non-treated in non experimental design . People use this technique with observational data...
.
As a concrete example, suppose we observe student test scores X under teaching strategies A and B, and each student has either a "high" or "low" level of mathematical knowledge before the two teaching strategies are implemented. However, we do not know which students are in the "high" category and which are in the "low" category. The population mean
Expected value
In probability theory, the expected value of a random variable is the weighted average of all possible values that this random variable can take on...
test scores in the four possible groups are
| A | B | |
| High |  |
 |
| Low |  |
 |
and the proportions of students in the groups are
| A | B | |
| High |  |
 |
| Low |  |
 |
where pHA + pHB + pLA + pLB = 1.
The "treatment difference" among students in the "high" group is μHA − μHB and the treatment difference among students in the "low" group is μLA − μLB. In general, it is possible that the two teaching strategies could differ in either direction, or show no difference, and the effects could differ in magnitude or even in sign between the "high" and "low" groups. For example, if strategy B were superior to strategy A for well-prepared students, but strategy A were superior to strategy B for poorly-prepared students, the two treatment differences would have opposite signs.
Since we do not know the baseline levels of the students, the expected value of the average test score XA among students in the A group is an average of those in the two baseline levels:
and similarly the average test score XB among students in the B group is
Thus the expected value of the observed treatment difference D = XA − XB is
A reasonable null hypothesis
Null hypothesis
The practice of science involves formulating and testing hypotheses, assertions that are capable of being proven false using a test of observed data. The null hypothesis typically corresponds to a general or default position...
is that there is no effect of the treatment within either the "high" or "low" student groups, so that μHA = μHB and μLA = μLB. Under this null hypothesis, the expected value of D will be zero if
and
This condition asserts that the assignment of students to the A and B teaching strategy groups is independent of their mathematical knowledge before the teaching strategies are implemented. If this holds, baseline mathematical knowledge is not a confounder, and conversely, if baseline mathematical knowledge is a confounder, the expected value of D will generally differ from zero. If the expected value of D under the null hypothesis is not equal to zero, then a situation where we reject the null hypothesis could either be due to an actual differential effect between teaching strategies A and B, or it could be due to non-independence in the assignment of students to the A and B groups (even in the complete absence of an effect due to the teaching strategy).
This example illustrates that if we make a direct comparison between two groups when confounders are present, we do not know whether any difference that is observed is due to the grouping itself, or is due to some other factor. If we are able to pair students by an exact or estimated measure of their baseline mathematical ability, then we are only comparing students "within rows" of the table of means given above. Consequently, if the null hypothesis holds, the expected value of D will equal zero, and statistical significance
Statistical significance
In statistics, a result is called statistically significant if it is unlikely to have occurred by chance. The phrase test of significance was coined by Ronald Fisher....
levels have their intended interpretation.