

Normalized Difference Vegetation Index
Encyclopedia
Remote sensing
Remote sensing is the acquisition of information about an object or phenomenon, without making physical contact with the object. In modern usage, the term generally refers to the use of aerial sensor technologies to detect and classify objects on Earth by means of propagated signals Remote sensing...
measurements, typically but not necessarily from a space platform, and assess whether the target being observed contains live green vegetation or not.
Brief history
The exploration of outer space started in earnest with the launch of Sputnik 1 by the Soviet UnionSoviet Union
The Soviet Union , officially the Union of Soviet Socialist Republics , was a constitutionally socialist state that existed in Eurasia between 1922 and 1991....
on 4 October 1957. This was the first man-made satellite
Satellite
In the context of spaceflight, a satellite is an object which has been placed into orbit by human endeavour. Such objects are sometimes called artificial satellites to distinguish them from natural satellites such as the Moon....
orbiting the Earth
Earth
Earth is the third planet from the Sun, and the densest and fifth-largest of the eight planets in the Solar System. It is also the largest of the Solar System's four terrestrial planets...
. Subsequent successful launches, both in the Soviet Union (e.g., the Sputnik and Cosmos
Cosmos (satellite)
Kosmos is a designation given to a large number of satellites operated by the Soviet Union and subsequently Russia. Kosmos 1, the first spacecraft to be given a Kosmos designation, was launched on March 16, 1962....
programs), and in the U.S. (e.g., the Explorer program
Explorer program
The Explorer program is a United States space exploration program that provides flight opportunities for physics, heliophysics, and astrophysics investigations from space. Over 90 space missions have been launched from 1958 to 2011, and it is still active...
), quickly led to the design and operation of dedicated meteorological satellites
Weather satellite
The weather satellite is a type of satellite that is primarily used to monitor the weather and climate of the Earth. Satellites can be either polar orbiting, seeing the same swath of the Earth every 12 hours, or geostationary, hovering over the same spot on Earth by orbiting over the equator while...
. These are orbiting platforms embarking instruments specially designed to observe the Earth's atmosphere and surface with a view to improve weather forecasting
Weather forecasting
Weather forecasting is the application of science and technology to predict the state of the atmosphere for a given location. Human beings have attempted to predict the weather informally for millennia, and formally since the nineteenth century...
. Starting in 1960, the TIROS
TIROS
TIROS, or Television Infrared Observation Satellite, is a series of early weather satellites launched by NASA, beginning with TIROS-1 in 1960. TIROS was the first satellite that was capable of remote sensing of the Earth. This initial remote-sensing effort was significant because it enabled Earth...
series of satellites embarked television cameras and radiometers. This was later (from 1964 onwards) followed by the Nimbus
Nimbus program
The Nimbus satellites were second-generation U.S. robotic spacecraft used for meteorological research and development. The spacecraft were designed to serve as stabilized, Earth-oriented platforms for the testing of advanced systems to sense and collect atmospheric science data...
satellites and the family of Advanced Very High Resolution Radiometer
Advanced Very High Resolution Radiometer
The Advanced Very High Resolution Radiometer is a space-borne sensor embarked on the National Oceanic and Atmospheric Administration family of polar orbiting platforms . AVHRR instruments measure the reflectance of the Earth in 5 relatively wide spectral bands...
instruments on-board the National Oceanic and Atmospheric Administration
National Oceanic and Atmospheric Administration
The National Oceanic and Atmospheric Administration , pronounced , like "noah", is a scientific agency within the United States Department of Commerce focused on the conditions of the oceans and the atmosphere...
(NOAA) platforms. The latter measures the reflectance of the planet in red and near-infrared bands, as well as in the thermal infrared. In parallel, NASA developed the Earth Resources Technology Satellite (ERTS), which became the precursor to the Landsat program
Landsat program
The Landsat program is the longest running enterprise for acquisition of satellite imagery of Earth. On July 26, 1972 the Earth Resources Technology Satellite was launched. This was eventually renamed to Landsat. The most recent, Landsat 7, was launched on April 15, 1999. The instruments on the...
. These early sensors had minimal spectral resolution, but tended to include bands in the red and near-infrared, which are useful to distinguish vegetation and clouds, amongst other targets.
With the launch of the first ERTS satellite – which was soon to be renamed Landsat 1
Landsat 1
Landsat 1, originally named "Earth Resources Technology Satellite 1", was the first satellite of the United States' Landsat program. It was a modified version of the Nimbus 4 meteorological satellite and was launched on July 23, 1972 by a Delta 900 rocket from Vandenberg Air Force Base in California...
– on July 23, 1972 with its MultiSpectral Scanner (MSS) NASA funded a number of investigations to determine its capabilities for Earth remote sensing. One of those early studies was directed toward examining the spring vegetation green-up and subsequent summer and fall dry-down (the so-called “vernal advancement and retrogradation”) throughout the north to south expanse of the Great Plains
Great Plains
The Great Plains are a broad expanse of flat land, much of it covered in prairie, steppe and grassland, which lies west of the Mississippi River and east of the Rocky Mountains in the United States and Canada. This area covers parts of the U.S...
region of the central U.S. This region covered a wide range of latitudes from the southern tip of Texas
Texas
Texas is the second largest U.S. state by both area and population, and the largest state by area in the contiguous United States.The name, based on the Caddo word "Tejas" meaning "friends" or "allies", was applied by the Spanish to the Caddo themselves and to the region of their settlement in...
to the U.S.-Canadian border, which resulted in a wide range of solar zenith angles at the time of the satellite observations.
The researchers for this Great Plains study (PhD student Donald Deering and his advisor Dr. Robert Haas) found that their ability to correlate, or quantify, the biophysical characteristics of the rangeland vegetation of this region from the satellite spectral signals was confounded by these differences in solar zenith angle across this strong latitudinal gradient. With the assistance of a resident mathematician (Dr. John Schell), they studied solutions to this dilemma and subsequently developed the ratio of the difference of the red and infrared radiances over their sum as a means to adjust for or “normalize” the effects of the solar zenith angle. Originally, they called this ratio the “Vegetation Index” (and another variant, the square-root transformation of the difference-sum ratio, the “Transformed Vegetation Index”); but as several other remote sensing researchers were identifying the simple red/infrared ratio and other spectral ratios as the “vegetation index,” they eventually began to identify the difference/sum ratio formulation as the Normalized Difference Vegetation Index. The earliest reported use of NDVI in the Great Plains study was in 1973 by Rouse et al. (Dr. John Rouse was the Director of the Remote Sensing Center of Texas A&M University
Texas A&M University
Texas A&M University is a coeducational public research university located in College Station, Texas . It is the flagship institution of the Texas A&M University System. The sixth-largest university in the United States, A&M's enrollment for Fall 2011 was over 50,000 for the first time in school...
where the Great Plains study was conducted). However, they were preceded in formulating a normalized difference spectral index by Kriegler et al. in 1969. Soon after the launch of ERTS-1 (Landsat-1), Compton Tucker of NASA's Goddard Space Flight Center
Goddard Space Flight Center
The Goddard Space Flight Center is a major NASA space research laboratory established on May 1, 1959 as NASA's first space flight center. GSFC employs approximately 10,000 civil servants and contractors, and is located approximately northeast of Washington, D.C. in Greenbelt, Maryland, USA. GSFC,...
produced a series of early scientific journal articles describing uses of the NDVI.
Thus, NDVI was one of the most successful of many attempts to simply and quickly identify vegetated areas and their "condition," and it remains the most well-known and used index to detect live green plant canopies in multispectral remote sensing data. Once the feasibility to detect vegetation had been demonstrated, users tended to also use the NDVI to quantify the photosynthetic capacity of plant canopies. This, however, can be a rather more complex undertaking if not done properly, as is discussed below.
Rationale

Photosynthetically active radiation
Photosynthetically active radiation, often abbreviated PAR, designates the spectral range of solar radiation from 400 to 700 nanometers that photosynthetic organisms are able to use in the process of photosynthesis. This spectral region corresponds more or less with the range of light visible to...
(PAR) spectral region, which they use as a source of energy in the process of photosynthesis
Photosynthesis
Photosynthesis is a chemical process that converts carbon dioxide into organic compounds, especially sugars, using the energy from sunlight. Photosynthesis occurs in plants, algae, and many species of bacteria, but not in archaea. Photosynthetic organisms are called photoautotrophs, since they can...
. Leaf cells have also evolved to scatter (i.e., reflect and transmit) solar radiation in the near-infrared spectral region (which carries approximately half of the total incoming solar energy), because the energy level per photon in that domain (wavelengths longer than about 700 nanometers) is not sufficient to be useful to synthesize organic molecules. A strong absorption at these wavelengths would only result in overheating the plant and possibly damaging the tissues. Hence, live green plants appear relatively dark in the PAR and relatively bright in the near-infrared. By contrast, clouds and snow tend to be rather bright in the red (as well as other visible wavelengths) and quite dark in the near-infrared.
The pigment in plant leaves, chlorophyll, strongly absorbs visible light (from 0.4 to 0.7 µm) for use in photosynthesis. The cell structure of the leaves, on the other hand, strongly reflects near-infrared light (from 0.7 to 1.1 µm). The more leaves a plant has, the more these wavelengths of light are affected, respectively.
Since early instruments of Earth Observation, such as NASA
NASA
The National Aeronautics and Space Administration is the agency of the United States government that is responsible for the nation's civilian space program and for aeronautics and aerospace research...
's ERTS and NOAA's AVHRR, acquired data in visible and near-infrared, it was natural to exploit the strong differences in plant reflectance to determine their spatial distribution in these satellite images.
The NDVI is calculated from these individual measurements as follows:
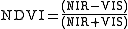
where VIS and NIR stand for the spectral reflectance measurements acquired in the visible (red) and near-infrared regions, respectively (http://earthobservatory.nasa.gov/Features/MeasuringVegetation/measuring_vegetation_2.php). These spectral reflectances are themselves ratios of the reflected over the incoming radiation in each spectral band individually, hence they take on values between 0.0 and 1.0. By design, the NDVI itself thus varies between -1.0 and +1.0. It should be noted that NDVI is functionally, but not linearly, equivalent to the simple infrared/red ratio (NIR/VIS). The advantage of NDVI over a simple infrared/red ratio is therefore generally limited to any possible linearity of its functional relationship with vegetation properties (e.g. biomass). The simple ratio (unlike NDVI) is always positive, which may have practical advantages, but it also has a mathematically infinite range (0 to infinity), which can be a practical disadvantage as compared to NDVI. Also in this regard, note that the VIS term in the numerator of NDVI only scales the result, thereby creating negative values. NDVI is functionally and linearly equivalent to the ratio NIR / (NIR+VIS), which ranges from 0 to 1 and is thus never negative nor limitless in range. But the most important concept in the understanding of the NDVI algebraic formula is that, despite its name, it is a transformation of a spectral ratio (NIR/VIS), and it has no functional relationship to a spectral difference (NIR-VIS).
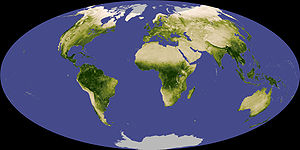
In general, if there is much more reflected radiation in near-infrared wavelengths than in visible wavelengths, then the vegetation in that pixel is likely to be dense and may contain some type of forest.
Subsequent work has shown that the NDVI is directly related to the photosynthetic capacity and hence energy absorption of plant canopies.
Performance and limitations
It can be seen from its mathematical definition that the NDVI of an area containing a dense vegetation canopy will tend to positive values (say 0.3 to 0.8) while clouds and snow fields will be characterized by negative values of this index. Other targets on Earth visible from space include- free standing water (e.g., oceans, seas, lakes and rivers) which have a rather low reflectance in both spectral bands (at least away from shores) and thus result in very low positive or even slightly negative NDVI values,
- soils which generally exhibit a near-infrared spectral reflectance somewhat larger than the red, and thus tend to also generate rather small positive NDVI values (say 0.1 to 0.2).
In addition to the simplicity of the algorithm and its capacity to broadly distinguish vegetated areas from other surface types, the NDVI also has the advantage of compressing the size of the data to be manipulated by a factor 2 (or more), since it replaces the two spectral bands by a single new field (eventually coded on 8 bits instead of the 10 or more bits of the original data).
Using the NDVI for quantitative assessments (as opposed to qualitative surveys as indicated above) raises a number of issues that may seriously limit the actual usefulness of this index if they are not properly addressed. Also, the NDVI has tended to be over-used (if not abused) in applications for which it was never designed. The following subsections review some of these issues.
- Mathematically, the sum and the difference of the two spectral channels contain the same information as the original data, but the difference alone (or the normalized difference) carries only part of the initial information. Whether the missing information is relevant or valuable is for the user to judge, but it is important to understand that an NDVI product carries only a fraction of the information available in the original spectral reflectance data.
- Users of NDVI have tended to estimate a large number of vegetation properties from the value of this index. Typical examples include the Leaf Area IndexLeaf Area IndexLeaf Area Index The Global Climate Observing System defines LAI as "one half the total green leaf area per unit groundsurface area. On sloping surfaces, the LAI should be projected to the normal to the slope. LAI is expressed in terms of square meters of leaf per square meter of ground...
, biomassBiomassBiomass, as a renewable energy source, is biological material from living, or recently living organisms. As an energy source, biomass can either be used directly, or converted into other energy products such as biofuel....
, chlorophyll concentration in leaves, plant productivity, fractional vegetation cover, accumulated rainfall, etc. Such relations are often derived by correlating space-derived NDVI values with ground-measured values of these variables. This approach raises further issues related to the spatial scale associated with the measurements, as satellite sensors always measure radiation quantities for areas substantially larger than those sampled by field instruments. Furthermore, it is of course illogical to claim that all these relations hold at once, because that would imply that all of these environmental properties would be directly and unequivocally related between themselves.
- The reflectance measurements should be relative to the same area and be acquired simultaneously. This may not be easy to achieve with instruments that acquire different spectral channels through different cameras or focal planes. Mis-registration of the spectral images may lead to substantial errors and unusable results.
Also, the calculation of the NDVI value turns out to be sensitive to a number of perturbing factors including
- Atmospheric effects: The actual composition of the atmosphere (in particular with respect to water vapor and aerosols) can significantly affect the measurements made in space. Hence, the latter may be misinterpreted if these effects are not properly taken into account (as is the case when the NDVI is calculated directly on the basis of raw measurements).
- Clouds: Deep (optically thick) clouds may be quite noticeable in satellite imagery and yield characteristic NDVI values that ease their screening. However, thin clouds (such as the ubiquitous cirrus), or small clouds with typical linear dimensions smaller than the diameter of the area actually sampled by the sensors, can significantly contaminate the measurements. Similarly, cloud shadows in areas that appear clear can affect NDVI values and lead to misinterpretations. These considerations are minimized by forming composite images from daily or near-daily images. Composite NDVI images have led to a large number of new vegetation applications where the NDVI or photosynthetic capacity varies over time.
- Soil effects: Soils tend to darken when wet, so that their reflectance is a direct function of water content. If the spectral response to moistening is not exactly the same in the two spectral bands, the NDVI of an area can appear to change as a result of soil moisture changes (precipitation or evaporation) and not because of vegetation changes.
- Anisotropic effects: All surfaces (whether natural or man-made) reflect light differently in different directions, and this form of anisotropy is generally spectrally dependent, even if the general tendency may be similar in these two spectral bands. As a result, the value of NDVI may depend on the particular anisotropy of the target and on the angular geometry of illumination and observation at the time of the measurements, and hence on the position of the target of interest within the swath of the instrument or the time of passage of the satellite over the site. This is particularly crucial in analyzing AVHRR data since the orbit of the NOAA platforms tended to drift in time. At the same time, the use of composite NDVI images minimizes these considerations and has led to global time series NDVI data sets spanning more than 25 years.
- Spectral effects: Since each sensor has its own characteristics and performances, in particular with respect to the position, width and shape of the spectral bands, a single formula like NDVI yields different results when applied to the measurements acquired by different instruments.
For these reasons, the NDVI should be used with great caution. In any quantitative application that necessitates a given level of accuracy, all the perturbing factors that could result in errors or uncertainties of that order of magnitude should be explicitly taken into account; this may require extensive processing based on ancillary data and other sources of information. More recent versions of NDVI datasets have attempted to account for these complicating factors through processing.http://earlywarning.usgs.gov/adds/readme.php?symbol=nd
A number of derivatives and alternatives to NDVI have been proposed in the scientific literature to address these limitations, including the Perpendicular Vegetation Index, the Soil-Adjusted Vegetation Index, the Atmospherically Resistant Vegetation Index and the Global Environment Monitoring Index. Each of these attempted to include intrinsic correction(s) for one or more perturbing factors. It is not until the mid-1990s, however, that a new generation of algorithms were proposed to estimate directly the biogeophysical variables of interest (e.g., the Fraction of Absorbed Photosynthetically Active Radiation or FAPAR
FAPAR
The Fraction of Absorbed Photosynthetically Active Radiation is the fraction of the incoming solar radiation in the Photosynthetically Active Radiation spectral region that is absorbed by a photosynthetic organism...
), taking advantage of the enhanced performance and characteristics of modern sensors (in particular their multispectral and multiangular capabilities) to take all the perturbing factors into account. In spite of many possible perturbing factors upon the NDVI, it remains a valuable quantitative vegetation monitoring tool when the photosynthetic capacity of the land surface needs to be studied at the appropriate spatial scale for various phenomena.