

Functional flow block diagram
Encyclopedia
System
System is a set of interacting or interdependent components forming an integrated whole....
’s functional flow.
The FFBD notation was developed in the 1950s, and is widely used in classical systems engineering
Systems engineering
Systems engineering is an interdisciplinary field of engineering that focuses on how complex engineering projects should be designed and managed over the life cycle of the project. Issues such as logistics, the coordination of different teams, and automatic control of machinery become more...
. FFBDs are one of the classic business process modeling
Business process modeling
Business Process Modeling in systems engineering is the activity of representing processes of an enterprise, so that the current process may be analyzed and improved. BPM is typically performed by business analysts and managers who are seeking to improve process efficiency and quality...
methodologies, along with flow charts, data flow diagram
Data flow diagram
A data flow diagram is a graphical representation of the "flow" of data through an information system, modelling its process aspects. Often they are a preliminary step used to create an overview of the system which can later be elaborated...
s, control flow diagram
Control flow diagram
A control flow diagram is a diagram to describe the control flow of a business process, process or program.Control flow diagrams were developed in the 1950s, and are widely used in multiple engineering disciplines...
s, Gantt chart
Gantt chart
A Gantt chart is a type of bar chart that illustrates a project schedule. Gantt charts illustrate the start and finish dates of the terminal elements and summary elements of a project. Terminal elements and summary elements comprise the work breakdown structure of the project. Some Gantt charts...
s, PERT diagrams, and IDEF
IDEF
IDEF, an abbreviation of Integration Definition, refers to a family of modeling languages in the field of systems and software engineering. They cover a wide range of uses, from functional modeling to data, simulation, object-oriented analysis/design and knowledge acquisition. These "definition...
.
FFBDs are also referred to as Functional Flow Diagrams, functional block diagrams, and functional flows.
History
The first structured method for documenting process flow, the flow process chartFlow process chart
The flow process chart in industrial engineering is a graphical and symbolic representation of the processing activities performed on the work piece.- History :...
, was introduced by Frank Gilbreth to members of American Society of Mechanical Engineers
American Society of Mechanical Engineers
The American Society of Mechanical Engineers is a professional body, specifically an engineering society, focused on mechanical engineering....
(ASME) in 1921 as the presentation “Process Charts—First Steps in Finding the One Best Way”. Gilbreth's tools quickly found their way into industrial engineering
Industrial engineering
Industrial engineering is a branch of engineering dealing with the optimization of complex processes or systems. It is concerned with the development, improvement, implementation and evaluation of integrated systems of people, money, knowledge, information, equipment, energy, materials, analysis...
curricula. In the early 1930s, an industrial engineer, Allan H. Mogensen began training business people in the use of some of the tools of industrial engineering at his Work Simplification Conferences in Lake Placid
Lake Placid, New York
Lake Placid is a village in the Adirondack Mountains in Essex County, New York, United States. As of the 2000 census, the village had a population of 2,638....
, New York
New York
New York is a state in the Northeastern region of the United States. It is the nation's third most populous state. New York is bordered by New Jersey and Pennsylvania to the south, and by Connecticut, Massachusetts and Vermont to the east...
. A 1944 graduate of Mogensen's class, Art Spinanger, took the tools back to Procter and Gamble where he developed their Deliberate Methods Change Program. Another 1944 graduate, Ben S. Graham, Director of Formcraft Engineering at Standard Register Corporation, adapted the flow process chart to information processing with his development of the multi-flow process chart to displays multiple documents and their relationships. In 1947, ASME adopted a symbol set as the ASME Standard for Operation and Flow Process Charts, derived from Gilbreth's original work.
The modern FFBD was developed by TRW
TRW
TRW Inc. was an American corporation involved in a variety of businesses, mainly aerospace, automotive, and credit reporting. It was a pioneer in multiple fields including electronic components, integrated circuits, computers, software and systems engineering. TRW built many spacecraft,...
Incorporated, a defense-related business, in the 1950s. In the 1960s it was exploited by NASA
NASA
The National Aeronautics and Space Administration is the agency of the United States government that is responsible for the nation's civilian space program and for aeronautics and aerospace research...
to visualize the time sequence of events in space systems and flight missions. FFBDs became widely used in classical systems engineering
Systems engineering
Systems engineering is an interdisciplinary field of engineering that focuses on how complex engineering projects should be designed and managed over the life cycle of the project. Issues such as logistics, the coordination of different teams, and automatic control of machinery become more...
to show the order of execution of system functions.
Development of functional flow block diagrams
Spacecraft
A spacecraft or spaceship is a craft or machine designed for spaceflight. Spacecraft are used for a variety of purposes, including communications, earth observation, meteorology, navigation, planetary exploration and transportation of humans and cargo....
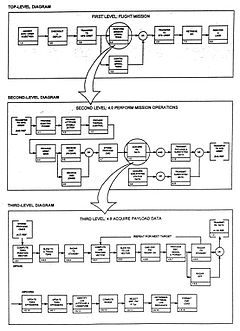
can be defined in a top level FFBD, as shown in Figure 2. Each block in the first level diagram can then be expanded to a series of functions, as shown in the second level diagram for "perform mission operations." Note that the diagram shows both input (transfer to operational orbit) and output (transfer to space transportation system orbit), thus initiating the interface identification and control process. Each block in the second level diagram can be progressively developed into a series of functions, as shown in the third level diagram on Figure 2.
These diagrams are used both to develop requirements and to identify profitable trade studies. For example, does the
spacecraft antenna acquire the tracking and data relay satellite (TDRS) only when the payload data are to be transmitted, or does it track TDRS continually to allow for the reception of emergency commands or transmission of emergency data? The FFBD also incorporates alternate and contingency operations, which improve the probability of mission success. The flow diagram provides an understanding of total operation of the system, serves as a basis for development of operational and contingency procedures, and pinpoints areas where changes in operational procedures could simplify the overall system operation. In certain cases, alternate FFBDs may be used to represent various means of satisfying a particular function until data are acquired, which permits selection among the alternatives.
Key attributes
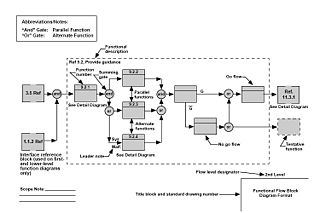
An overview of the key FFBD attributes:
- Function block: Each function on an FFBD should be separate and be represented by single box (solid line). Each function needs to stand for definite, finite, discrete action to be accomplished by system elements.
- Function numbering: Each level should have a consistent number scheme and provide information concerning function origin. These numbers establish identification and relationships that will carry through all Functional Analysis and Allocation activities and facilitate traceability from lower to top levels.
- Functional reference: Each diagram should contain a reference to other functional diagrams by using a functional reference (box in brackets).
- Flow connection: Lines connecting functions should only indicate function flow and not a lapse in time or intermediate activity.
- Flow direction: Diagrams should be laid out so that the flow direction is generally from left to right. Arrows are often used to indicate functional flows.
- Summing gates: A circle is used to denote a summing gate and is used when AND/OR is present. AND is used to indicate parallel functions and all conditions must be satisfied to proceed. OR is used to indicate that alternative paths can be satisfied to proceed.
- GO and NO-GO paths: “G” and “bar G” are used to denote “go” and “no-go” conditions. These symbols are placed adjacent to lines leaving a particular function to indicate alternative paths.
Function symbolism
A function shall be represented by a rectangle containing the title of the function (an action verb followed by a noun phrase) and its unique decimal delimited number. A horizontal line shall separate this number and the title, as shown in see Figure 3 above. The figure also depicts how to represent a reference function, which provides context within a specific FFBD. See Figure 9 for an example regarding use of a reference function. |
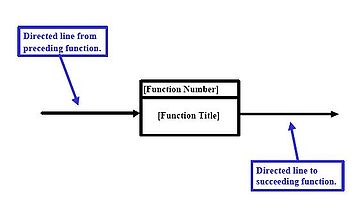 |
Directed lines
A line with a single arrowhead shall depict functional flow from left to right, see Figure 4.Logic Symbols
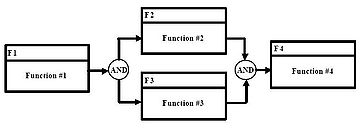
The following basic logic symbols shall be used.- AND: A condition in which all preceding or succeeding paths are required. The symbol may contain a single input with multiple outputs or multiple inputs with a single output, but not multiple inputs and outputs combined (Figure 5). Read the figure as follows: F2 AND F3 may begin in parallel after completion of F1. Likewise, F4 may begin after completion of F2 AND F3.
 |
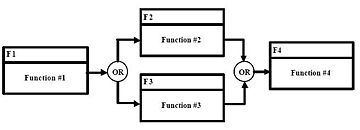 |
- Exclusive OR: A condition in which one of multiple preceding or succeeding paths is required, but not all. The symbol may contain a single input with multiple outputs or multiple inputs with single output, but not multiple inputs and outputs combined (Figure 6). Read the figure as follows: F2 OR F3 may begin after completion of F1. Likewise, F4 may begin after completion of either F2 OR F3.
- Inclusive OR: A condition in which one, some, or all of the multiple preceding or succeeding paths are required. Figure 7 depicts Inclusive OR logic using a combination of the AND symbol (Figure 5) and the Exclusive OR symbol (Figure 6). Read Figure 7 as follows: F2 OR F3 (exclusively) may begin after completion of F1, OR (again exclusive) F2 AND F3 may begin after completion of F1. Likewise, F4 may begin after completion of either F2 OR F3 (exclusively), OR (again exclusive) F4 may begin after completion of both F2 AND F3

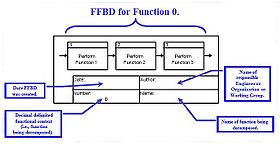
Contextual and Administrative Data
Each FFBD shall contain the following contextual and administrative data:- Date the diagram was created
- Name of the engineer, organization, or working group that created the diagram
- Unique decimal delimited number of the function being diagrammed
- Unique function name of the function being diagrammed.
Figure 8 and Figure 9 present the data in an FFBD. Figure 9 is a decomposition of the function F2 contained in Figure 8 and illustrates the context between functions at different levels of the model.
 |
 |
See also
- Block diagramBlock diagramBlock diagram is a diagram of a system, in which the principal parts or functions are represented by blocks connected by lines, that show the relationships of the blocks....
- Business Process MappingBusiness Process MappingBusiness process mapping refers to activities involved in defining exactly what a business entity does, who is responsible, to what standard a process should be completed and how the success of a business process can be determined. Once this is done, there can be no uncertainty as to the...
- DataflowDataflowDataflow is a term used in computing, and may have various shades of meaning. It is closely related to message passing.-Software architecture:...
- Flow diagramFlow diagramFlow diagram may refer to:* Alluvial diagram, highlights and summarizes the significant structural changes in networks* Flowchart, schematic representation of a process which can give a step-by-step solution to a given problem....
- Flow process chartFlow process chartThe flow process chart in industrial engineering is a graphical and symbolic representation of the processing activities performed on the work piece.- History :...
- Function modelFunction modelA function model or functional model in systems engineering and software engineering is a structured representation of the functions within the modeled system or subject area....
- Function block diagramFunction block diagramA function block diagram is a block diagram that describes a function between input variables and output variables. A function is described as a set of elementary blocks. Input and output variables are connected to blocks by connection lines...
- IDEF0IDEF0IDEF0 is a function modeling methodology for describing manufacturing functions, which offers a functional modeling language for the analysis, development, reengineering, and integration of information systems; business processes; or software engineering analysis.IDEF0 is part of the IDEF family...
- N2 ChartN2 ChartThe N 2 chart, also referred to as N 2 diagram, N-squared diagram or N-squared chart, is a diagram in the shape of a matrix, representing functional or physical interfaces between system elements. It is used to systematically identify, define, tabulate, design, and analyze functional and...
- SADTStructured Analysis and Design TechniqueStructured Analysis and Design Technique is a software engineering methodology for describing systems as a hierarchy of functions.- Overview :...
- Signal flowSignal flowAudio signal flow is the path an audio signal takes from source to output, including all the processing involved in generating audible sound from electronic impulses or recorded media.- Analog recording :...
- Signal-flow graphSignal-flow graphA signal-flow graph is a special type of block diagram—and directed graph—consisting of nodes and branches. Its nodes are the variables of a set of linear algebraic relations. An SFG can only represent multiplications and additions. Multiplications are represented by the weights of the branches;...
Further reading
- DAU (2001) Systems Engineering Fundamentals. Defense Acquisition University Press.
- FAA (2007) System Engineering Manual. Federal Aviation Administration Washington.
External links
- Functional Flow Block Diagram (FFBD), NASA PBMA.