
Phase diagram
WiktionaryText
Noun
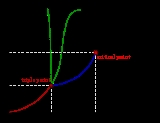
- A graph, with axes representing temperature and pressure, showing the equilibrium conditions for a given substance to be a solid, liquid or gas.
- a similar diagram for a binary mixture of substances, with axes representing composition and temperature.
Related terms
- solidus
- liquidus
- critical point
- triple point
- eutectic
- eutectic point
- phase space