
.gif)
Trend lines (technical analysis)
Encyclopedia
A trend line is formed when you can draw a diagonal line between two or more price pivot points. They are commonly used to judge entry and exit investment timing when trading securities. It can also be referred to a dutch line as it was first used in Holland.
A trend line is a bounding line for the price movement of a security. A support trend line is formed when a securities price decreases and then rebounds at a pivot point that aligns with at least two previous support pivot points. Similarly a resistance trend line is formed when a securities price increases and then rebounds at a pivot point that aligns with at least two previous resistance pivot points.
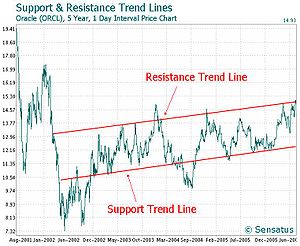 Trend lines are a simple and widely used technical analysis
approach to judging entry and exit investment timing. To establish a trend line historical data, typically presented in the format of a chart such as the above price chart, is required. Historically, trend lines have been drawn by hand on paper charts, but it is now more common to use charting software that enables trend lines to be drawn on computer based charts. There are some charting software that will automatically generate trend lines, however most traders prefer to draw their own trend lines.
When establishing trend lines it is important to choose a chart based on a price interval period that aligns with your trading strategy. Short term traders tend to use charts based on interval periods, such as 1 minute (i.e. the price of the security is plotted on the chart every 1 minute), with longer term traders using price charts based on hourly, daily, weekly and monthly interval periods.
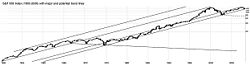
However, time periods can also be viewed in terms of years. For example, below is a chart of the S&P 500
since the earliest data point until April 2008. Please note that while the Oracle example above uses a linear scale of price changes, long term data is more often viewed as logarithmic
: e.g. the changes are really an attempt to approximate percentage changes than pure numerical value.
 Trend lines are typically used with price charts, however they can also be used with a range of technical analysis
charts such as MACD
and RSI
. Trend lines can be used to identify positive and negative trending charts, whereby a positive trending chart forms an upsloping line when the support and the resistance pivots points are aligned, and a negative trending chart forms a downsloping line when the support and resistance pivot points are aligned.
Trend lines are used in many ways by traders. If a stock price is moving between support and resistance trend lines, then a basic investment strategy commonly used by traders, is to buy a stock at support and sell at resistance, then short at resistance and cover the short at support. The logic behind this, is that when the price returns to an existing principal trend line it may be an opportunity to open new positions in the direction of the trend, in the belief that the trend line will hold and the trend will continue further. A second way is that when price action breaks through the principal trend line of an existing trend, it is evidence that the trend may be going to fail, and a trader may consider trading in the opposite direction to the existing trend, or exiting positions in the direction of the trend.
A trend line is a bounding line for the price movement of a security. A support trend line is formed when a securities price decreases and then rebounds at a pivot point that aligns with at least two previous support pivot points. Similarly a resistance trend line is formed when a securities price increases and then rebounds at a pivot point that aligns with at least two previous resistance pivot points.
Technical analysis
In finance, technical analysis is security analysis discipline for forecasting the direction of prices through the study of past market data, primarily price and volume. Behavioral economics and quantitative analysis incorporate technical analysis, which being an aspect of active management stands...
approach to judging entry and exit investment timing. To establish a trend line historical data, typically presented in the format of a chart such as the above price chart, is required. Historically, trend lines have been drawn by hand on paper charts, but it is now more common to use charting software that enables trend lines to be drawn on computer based charts. There are some charting software that will automatically generate trend lines, however most traders prefer to draw their own trend lines.
When establishing trend lines it is important to choose a chart based on a price interval period that aligns with your trading strategy. Short term traders tend to use charts based on interval periods, such as 1 minute (i.e. the price of the security is plotted on the chart every 1 minute), with longer term traders using price charts based on hourly, daily, weekly and monthly interval periods.
However, time periods can also be viewed in terms of years. For example, below is a chart of the S&P 500
S&P 500
The S&P 500 is a free-float capitalization-weighted index published since 1957 of the prices of 500 large-cap common stocks actively traded in the United States. The stocks included in the S&P 500 are those of large publicly held companies that trade on either of the two largest American stock...
since the earliest data point until April 2008. Please note that while the Oracle example above uses a linear scale of price changes, long term data is more often viewed as logarithmic
Logarithmic
Logarithmic can refer to:* Logarithm, a transcendental function in mathematics* Logarithmic scale, the use of the logarithmic function to describe measurements* Logarithmic growth* Logarithmic distribution, a discrete probability distribution...
: e.g. the changes are really an attempt to approximate percentage changes than pure numerical value.
Technical analysis
In finance, technical analysis is security analysis discipline for forecasting the direction of prices through the study of past market data, primarily price and volume. Behavioral economics and quantitative analysis incorporate technical analysis, which being an aspect of active management stands...
charts such as MACD
MACD
MACD is a technical analysis indicator created by Gerald Appel in the late 1970s. It is used to spot changes in the strength, direction, momentum, and duration of a trend in a stock's price....
and RSI
Relative strength index
The Relative Strength Index is a technical indicator used in the technical analysis of financial markets. It is intended to chart the current and historical strength or weakness of a stock or market based on the closing prices of a recent trading period...
. Trend lines can be used to identify positive and negative trending charts, whereby a positive trending chart forms an upsloping line when the support and the resistance pivots points are aligned, and a negative trending chart forms a downsloping line when the support and resistance pivot points are aligned.
Trend lines are used in many ways by traders. If a stock price is moving between support and resistance trend lines, then a basic investment strategy commonly used by traders, is to buy a stock at support and sell at resistance, then short at resistance and cover the short at support. The logic behind this, is that when the price returns to an existing principal trend line it may be an opportunity to open new positions in the direction of the trend, in the belief that the trend line will hold and the trend will continue further. A second way is that when price action breaks through the principal trend line of an existing trend, it is evidence that the trend may be going to fail, and a trader may consider trading in the opposite direction to the existing trend, or exiting positions in the direction of the trend.