
Relative strength index
Encyclopedia
The Relative Strength Index (RSI) is a technical indicator used in the technical analysis
of financial market
s. It is intended to chart the current and historical strength or weakness of a stock or market based on the closing prices of a recent trading period. The indicator should not be confused with relative strength
.
The RSI is classified as a momentum oscillator
, measuring the velocity and magnitude of directional price movements. Momentum
is the rate of the rise or fall in price. The RSI computes momentum as the ratio of higher closes to lower closes: stocks which have had more or stronger positive changes have a higher RSI than stocks which have had more or stronger negative changes.
The RSI is most typically used on a 14 day timeframe, measured on a scale from 0 to 100, with high and low levels marked at 70 and 30, respectively. Shorter or longer timeframes are used for alternately shorter or longer outlooks. More extreme high and low levels—80 and 20, or 90 and 10—occur less frequently but indicate stronger momentum.
The Relative Strength Index was developed by J. Welles Wilder
and published in a 1978 book, New Concepts in Technical Trading Systems, and in Commodities magazine (now Futures
magazine) in the June 1978 issue.
Conversely, a down period is characterized by the close being lower than the previous period's (note that D is nonetheless a positive number),
If the last close is the same as the previous, both U and D are zero. The average U and D are calculated using an n-period exponential moving average (EMA). The ratio of these averages is the Relative Strength:
If the average of D values is zero, then the RSI value is defined as 100.
The Relative Strength is then converted to a Relative Strength Index between 0 and 100:
The exponential moving averages should be appropriately initialized with a simple average using the first n values in the price series.
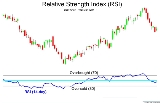
 The RSI is presented on a graph above or below the price chart. The indicator has an upper line, typically at 70, a lower line at 30, and a dashed mid-line at 50. Wilder recommended a smoothing period of 14 (see EMA smoothing, i.e. α = 1/14 or N = 27).
The level of the RSI is a measure of the stock's recent trading strength. The slope of the RSI is directly proportional to the velocity of a change in the trend. The distance traveled by the RSI is proportional to the magnitude of the move.
Wilder believed that tops and bottoms are indicated when RSI goes above 70 or drops below 30. Traditionally, RSI readings greater than the 70 level are considered to be in overbought territory, and RSI readings lower than the 30 level are considered to be in oversold territory. In between the 30 and 70 level is considered neutral, with the 50 level a sign of no trend.
Finally, Wilder wrote that chart formations and areas of support and resistance could sometimes be more easily seen on the RSI chart as opposed to the price chart. The center line for the relative strength index is 50, which is often seen as both the support and resistance line for the indicator.
If the relative strength index is below 50, it generally means that the stock's losses are greater than the gains. When the relative strength index is above 50, it generally means that the gains are greater than the losses.
 Next, Cardwell noted that bearish divergence: 1) only occurs in uptrends, and 2) mostly only leads to a brief correction instead of a reversal in trend. Therefore bearish divergence is a sign confirming an uptrend. Similarly, bullish divergence is a sign confirming a downtrend.
In other words, despite stronger momentum as seen by the higher high or lower low in the RSI, price could not make a higher high or lower low. This is evidence the main trend is about to resume. Cardwell noted that positive reversals only happen in uptrends while negative reversals only occur in downtrends, and therefore their existence confirms the trend.
Cutler's RSI generally comes out slightly different from the normal Wilder RSI, but the two are similar, since SMA and EMA are also similar.
Technical analysis
In finance, technical analysis is security analysis discipline for forecasting the direction of prices through the study of past market data, primarily price and volume. Behavioral economics and quantitative analysis incorporate technical analysis, which being an aspect of active management stands...
of financial market
Financial market
In economics, a financial market is a mechanism that allows people and entities to buy and sell financial securities , commodities , and other fungible items of value at low transaction costs and at prices that reflect supply and demand.Both general markets and...
s. It is intended to chart the current and historical strength or weakness of a stock or market based on the closing prices of a recent trading period. The indicator should not be confused with relative strength
Relative strength
Relative strength is a ratio of a stock price to a market average. It is used in technical analysis.It is not to be confused with Relative Strength Index....
.
The RSI is classified as a momentum oscillator
Oscillator (technical analysis)
An oscillator is a technical analysis indicator that varies over time within a band . Oscillators are used to discover short-term overbought or oversold conditions....
, measuring the velocity and magnitude of directional price movements. Momentum
Momentum (technical analysis)
Momentum and rate of change are simple technical analysis indicators showing the difference between today's closing price and the close N days ago. Momentum is the absolute difference in stock, commodity:...
is the rate of the rise or fall in price. The RSI computes momentum as the ratio of higher closes to lower closes: stocks which have had more or stronger positive changes have a higher RSI than stocks which have had more or stronger negative changes.
The RSI is most typically used on a 14 day timeframe, measured on a scale from 0 to 100, with high and low levels marked at 70 and 30, respectively. Shorter or longer timeframes are used for alternately shorter or longer outlooks. More extreme high and low levels—80 and 20, or 90 and 10—occur less frequently but indicate stronger momentum.
The Relative Strength Index was developed by J. Welles Wilder
J. Welles Wilder
J. Welles Wilder Jr. is an American mechanical engineer, best known for his work in technical analysis. Wilder is the father of several technical indicators that are now considered to be core indicators in technical analysis software. These include Average True Range, the Relative Strength Index ,...
and published in a 1978 book, New Concepts in Technical Trading Systems, and in Commodities magazine (now Futures
Futures (magazine)
Futures magazine is a U.S.-based monthly magazine about commodity futures contracts, stocks, options, derivatives, and forex.Another periodical called Futures is a journal on policy, planning and futures studies....
magazine) in the June 1978 issue.
Calculation
For each trading period an upward change U or downward change D is calculated. Up periods are characterized by the close being higher than the previous close:

Conversely, a down period is characterized by the close being lower than the previous period's (note that D is nonetheless a positive number),


If the last close is the same as the previous, both U and D are zero. The average U and D are calculated using an n-period exponential moving average (EMA). The ratio of these averages is the Relative Strength:

If the average of D values is zero, then the RSI value is defined as 100.
The Relative Strength is then converted to a Relative Strength Index between 0 and 100:

The exponential moving averages should be appropriately initialized with a simple average using the first n values in the price series.
Basic configuration
Principles
Wilder posited that when price moves up very rapidly, at some point it is considered overbought. Likewise, when price falls very rapidly, at some point it is considered oversold. In either case, Wilder deemed a reaction or reversal imminent.The level of the RSI is a measure of the stock's recent trading strength. The slope of the RSI is directly proportional to the velocity of a change in the trend. The distance traveled by the RSI is proportional to the magnitude of the move.
Wilder believed that tops and bottoms are indicated when RSI goes above 70 or drops below 30. Traditionally, RSI readings greater than the 70 level are considered to be in overbought territory, and RSI readings lower than the 30 level are considered to be in oversold territory. In between the 30 and 70 level is considered neutral, with the 50 level a sign of no trend.
Divergence
Wilder further believed that divergence between RSI and price action is a very strong indication that a market turning point is imminent. Bearish divergence occurs when price makes a new high but the RSI makes a lower high, thus failing to confirm. Bullish divergence occurs when price makes a new low but RSI makes a higher low.Overbought and oversold conditions
Wilder thought that "failure swings" above 70 and below 30 on the RSI are strong indications of market reversals. For example, assume the RSI hits 76, pulls back to 72, then rises to 77. If it falls below 72, Wilder would consider this a "failure swing" above 70.Finally, Wilder wrote that chart formations and areas of support and resistance could sometimes be more easily seen on the RSI chart as opposed to the price chart. The center line for the relative strength index is 50, which is often seen as both the support and resistance line for the indicator.
If the relative strength index is below 50, it generally means that the stock's losses are greater than the gains. When the relative strength index is above 50, it generally means that the gains are greater than the losses.
Uptrends and downtrends
In addition to Wilder's original theories of RSI interpretation, Andrew Cardwell has developed several new interpretations of RSI to help determine and confirm trend. First, Cardwell noticed that uptrends generally traded between RSI 40 and 80, while downtrends usually traded between RSI 60 and 20. Cardwell observed when securities change from uptrend to downtrend and vice versa, the RSI will undergo a "range shift."Reversals
Finally, Cardwell discovered the existence of positive and negative reversals in the RSI. Reversals are the opposite of divergence. For example, a positive reversal occurs when an uptrend price correction results in a higher low compared to the last price correction, while RSI results in a lower low compared to the prior correction. A negative reversal happens when a downtrend rally results in a lower high compared to the last downtrend rally, but RSI makes a higher high compared to the prior rally.In other words, despite stronger momentum as seen by the higher high or lower low in the RSI, price could not make a higher high or lower low. This is evidence the main trend is about to resume. Cardwell noted that positive reversals only happen in uptrends while negative reversals only occur in downtrends, and therefore their existence confirms the trend.
Cutler's RSI
A variation called Cutler's RSI is based on a simple moving average of U and D, instead of the exponential average above. Cutler had found that since Wilder used an exponential moving average to calculate RSI, the value of Wilder's RSI depended upon where in the data file his calculations started. Cutler termed this Data Length Dependency. Cutler's RSI is not data length dependent, and returns consistent results regardless of the length of, or the starting point within a data file.
Cutler's RSI generally comes out slightly different from the normal Wilder RSI, but the two are similar, since SMA and EMA are also similar.
See also
- MACDMACDMACD is a technical analysis indicator created by Gerald Appel in the late 1970s. It is used to spot changes in the strength, direction, momentum, and duration of a trend in a stock's price....
moving average convergence/divergence - True Strength IndexTrue Strength IndexThe True Strength Index was first published in 1995 by William Blau as an indicator of both trend direction and overbought / oversold conditions, using moving averages of the underlying momentum of a financial instrument. Momentum is considered a leading indicator of price movements, and a moving...
, a similar momentum-based indicator