
MACD
Encyclopedia
MACD is a technical analysis
indicator created by Gerald Appel in the late 1970s. It is used to spot changes in the strength, direction, momentum
, and duration of a trend in a stock's price.
The MACD is a computation of the difference between two exponential moving averages (EMAs) of closing prices. This difference is charted over time, alongside a moving average of the difference. The divergence between the two is shown as a histogram
or bar graph.
Exponential moving averages highlight recent changes in a stock's price. By comparing EMAs of different periods, the MACD line illustrates changes in the trend of a stock. Then by comparing that difference to an average, an analyst can chart subtle shifts in the stock's trend.
Since the MACD is based on moving averages, it is inherently a lagging indicator. As a metric of price trends, the MACD is less useful for stocks that are not trending or are trading erratically.
The term "MACD" is used both generally, to refer to the indicator as a whole, and specifically, to the MACD line itself.
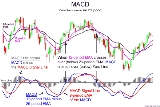
 The graph above shows a stock with a MACD indicator underneath it. The indicator shows a blue line, a red line, and a histogram or bar chart which calculates the difference between the two lines. Values are calculated from the price of the stock in the main part of the graph.
For the example above this means:
Mathematically:
The period for the moving averages on which an MACD is based can vary, but the most commonly used parameters involve a faster EMA of 12 days, a slower EMA of 26 days, and the signal line as a 9 day EMA of the difference between the two. It is written in the form, MACD (faster, slower, signal) or in this case, MACD(12,26,9).
Traders recognize three meaningful signals generated by the MACD indicator.
When:
Graphically this corresponds to:
And mathematically:
The upwards move is called a bullish crossover and the downwards move a bearish crossover. Respectively, they indicate that the trend in the stock is about to accelerate in the direction of the crossover.
The histogram shows when a crossing occurs. Since the histogram is the difference between the MACD line and the signal line, when they cross there is no difference between them.
The histogram can also help in visualizing when the two lines are approaching a crossover. Though it may show a difference, the changing size of the difference can indicate the acceleration of a trend. A narrowing histogram suggests a crossover may be approaching, and a widening histogram suggests that an ongoing trend is likely to get even stronger.
While it is theoretically possible for a trend to increase indefinitely, under normal circumstances, even stocks moving drastically will eventually slow down, lest they go up to infinity or down to nothing.
Divergence may also occur between the stock price and the histogram. If new high price levels are not confirmed by new high histogram levels, it is considered bearish; alternatively, if new low price levels are not confirmed by new low histogram levels, it is considered bullish.
Longer and sharper divergences—distinct peaks or troughs—are regarded as more significant than small, shallow patterns.
A prudent strategy would be to apply a filter to signal line crossovers to ensure that they will hold. An example of a price filter would be to buy if the MACD line breaks above the signal line and then remains above it for three days. As with any filtering strategy, this reduces the probability of false signals but increases the frequency of missed profit.
Analysts use a variety of approaches to filter out false signals and confirm true ones.
While an APO will show greater levels for higher priced securities and smaller levels for lower priced securities, a PPO calculates changes relative to price. Subsequently, a PPO is preferred when: comparing oscillator values between different securities, especially those with substantially different prices; or comparing oscillator values for the same security at significantly different times, especially a security whose value has changed greatly.
A third member of the price oscillator family is the detrended price oscillator (DPO)
, which ignores long term trends while emphasizing short term patterns.
terms, the MACD is a filtered
measure of velocity. The velocity has been passed through two first-order linear low-pass filters. The "signal line" is that resulting velocity, filtered again. The difference between those two, the histogram, is a measure of the acceleration, with all three filters applied. A MACD crossover of the signal line indicates that the direction of the acceleration is changing. The MACD line crossing zero suggests that the average velocity is changing direction.
Technical analysis
In finance, technical analysis is security analysis discipline for forecasting the direction of prices through the study of past market data, primarily price and volume. Behavioral economics and quantitative analysis incorporate technical analysis, which being an aspect of active management stands...
indicator created by Gerald Appel in the late 1970s. It is used to spot changes in the strength, direction, momentum
Momentum (finance)
In finance, momentum is the empirically observed tendency for rising asset prices to rise further, and falling prices to keep falling. For instance, it was shown that stocks with strong past performance continue to outperform stocks with poor past performance in the next period with an average...
, and duration of a trend in a stock's price.
The MACD is a computation of the difference between two exponential moving averages (EMAs) of closing prices. This difference is charted over time, alongside a moving average of the difference. The divergence between the two is shown as a histogram
Histogram
In statistics, a histogram is a graphical representation showing a visual impression of the distribution of data. It is an estimate of the probability distribution of a continuous variable and was first introduced by Karl Pearson...
or bar graph.
Exponential moving averages highlight recent changes in a stock's price. By comparing EMAs of different periods, the MACD line illustrates changes in the trend of a stock. Then by comparing that difference to an average, an analyst can chart subtle shifts in the stock's trend.
Since the MACD is based on moving averages, it is inherently a lagging indicator. As a metric of price trends, the MACD is less useful for stocks that are not trending or are trading erratically.
The term "MACD" is used both generally, to refer to the indicator as a whole, and specifically, to the MACD line itself.
Basic components
For the example above this means:
- MACD line (blue line): difference between the 12 and 26 days EMAs
- signal (red line): 9 day EMA of the blue line
- histogram (bar graph): difference between the blue and red lines
Mathematically:
- MACD = EMA[stockPrices,12] – EMA[stockPrices,26]
- signal = EMA[MACD,9]
- histogram = MACD – signal
The period for the moving averages on which an MACD is based can vary, but the most commonly used parameters involve a faster EMA of 12 days, a slower EMA of 26 days, and the signal line as a 9 day EMA of the difference between the two. It is written in the form, MACD (faster, slower, signal) or in this case, MACD(12,26,9).
Interpretation
Exponential moving averages highlight recent changes in a stock's price. By comparing EMAs of different lengths, the MACD line gauges changes in the trend of a stock. By then comparing differences in the change of that line to an average, an analyst can identify subtle shifts in the strength and direction of a stock's trend.Traders recognize three meaningful signals generated by the MACD indicator.
When:
- the MACD line crosses the signal line
- the MACD line crosses zero
- there is a divergence between the MACD line and the price of the stock or between the histogram and the price of the stock
Graphically this corresponds to:
- the blue line crossing the red line
- the blue line crossing the x-axis (the straight black line in the middle of the indicator)
- higher highs (lower lows) on the price graph but not on the blue line, or higher highs (lower lows) on the price graph but not on the bar graph
And mathematically:
- MACD – signal = 0
- EMA[fast,12] – EMA[slow,26] = 0
- Sign (relative price extremumfinal – relative price extremuminitial) ≠ Sign (relative MACD extremumfinal – MACD extremuminitial)
Signal–line crossover
Signal–line crossovers are the primary cues provided by the MACD. The standard interpretation is to buy when the MACD line crosses up through the signal line, or sell when it crosses down through the signal line.The upwards move is called a bullish crossover and the downwards move a bearish crossover. Respectively, they indicate that the trend in the stock is about to accelerate in the direction of the crossover.
The histogram shows when a crossing occurs. Since the histogram is the difference between the MACD line and the signal line, when they cross there is no difference between them.
The histogram can also help in visualizing when the two lines are approaching a crossover. Though it may show a difference, the changing size of the difference can indicate the acceleration of a trend. A narrowing histogram suggests a crossover may be approaching, and a widening histogram suggests that an ongoing trend is likely to get even stronger.
While it is theoretically possible for a trend to increase indefinitely, under normal circumstances, even stocks moving drastically will eventually slow down, lest they go up to infinity or down to nothing.
Zero crossover
A crossing of the MACD line through zero happens when there is no difference between the fast and slow EMAs. A move from positive to negative is bearish and from negative to positive, bullish. Zero crossovers provide evidence of a change in the direction of a trend but less confirmation of its momentum than a signal line crossover.Divergence
The third cue, divergence, refers to a discrepancy between the MACD line and the graph of the stock price. Positive divergence between the MACD and price arises when price hits a new low, but the MACD doesn't. This is interpreted as bullish, suggesting the downtrend may be nearly over. Negative divergence is when the stock price hits a new high but the MACD does not. This is interpreted as bearish, suggesting that recent price increases will not continue.Divergence may also occur between the stock price and the histogram. If new high price levels are not confirmed by new high histogram levels, it is considered bearish; alternatively, if new low price levels are not confirmed by new low histogram levels, it is considered bullish.
Longer and sharper divergences—distinct peaks or troughs—are regarded as more significant than small, shallow patterns.
Timing
The MACD is only as useful as the context in which it is applied. An analyst might apply the MACD to a weekly scale before looking at a daily scale, in order to avoid making short term trades against the direction of the intermediate trend. Analysts will also vary the parameters of the MACD to track trends of varying duration. One popular short-term set-up, for example, is the (5,35,5).False signals
Like any indicator, the MACD can generate false signals. A false positive, for example, would be a bullish crossover followed by a sudden decline in a stock. A false negative would be a situation where there was no bullish crossover, yet the stock accelerated suddenly upwards.A prudent strategy would be to apply a filter to signal line crossovers to ensure that they will hold. An example of a price filter would be to buy if the MACD line breaks above the signal line and then remains above it for three days. As with any filtering strategy, this reduces the probability of false signals but increases the frequency of missed profit.
Analysts use a variety of approaches to filter out false signals and confirm true ones.
Oscillator classification
The MACD is an absolute price oscillator (APO), because it deals with the actual prices of moving averages rather than percentage changes. A percentage price oscillator (PPO), on the other hand, computes the difference between two moving averages of price divided by the longer moving average value.While an APO will show greater levels for higher priced securities and smaller levels for lower priced securities, a PPO calculates changes relative to price. Subsequently, a PPO is preferred when: comparing oscillator values between different securities, especially those with substantially different prices; or comparing oscillator values for the same security at significantly different times, especially a security whose value has changed greatly.
A third member of the price oscillator family is the detrended price oscillator (DPO)
Detrended price oscillator
MACDThe detrended price oscillator is an indicator in technical analysis that attempts to eliminate the long-term trends in prices...
, which ignores long term trends while emphasizing short term patterns.
Signal processing theory
In signal processingSignal processing
Signal processing is an area of systems engineering, electrical engineering and applied mathematics that deals with operations on or analysis of signals, in either discrete or continuous time...
terms, the MACD is a filtered
Low-pass filter
A low-pass filter is an electronic filter that passes low-frequency signals but attenuates signals with frequencies higher than the cutoff frequency. The actual amount of attenuation for each frequency varies from filter to filter. It is sometimes called a high-cut filter, or treble cut filter...
measure of velocity. The velocity has been passed through two first-order linear low-pass filters. The "signal line" is that resulting velocity, filtered again. The difference between those two, the histogram, is a measure of the acceleration, with all three filters applied. A MACD crossover of the signal line indicates that the direction of the acceleration is changing. The MACD line crossing zero suggests that the average velocity is changing direction.