

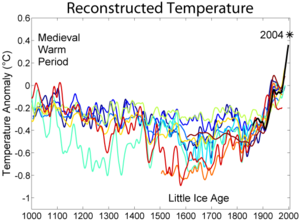
Temperature record of the past 1000 years
Encyclopedia
- For information on the description of the Medieval Warm PeriodMedieval Warm PeriodThe Medieval Warm Period , Medieval Climate Optimum, or Medieval Climatic Anomaly was a time of warm climate in the North Atlantic region, that may also have been related to other climate events around the world during that time, including in China, New Zealand, and other countries lasting from...
and Little Ice AgeLittle Ice AgeThe Little Ice Age was a period of cooling that occurred after the Medieval Warm Period . While not a true ice age, the term was introduced into the scientific literature by François E. Matthes in 1939...
in various IPCC reports see MWP and LIA in IPCC reportsMWP and LIA in IPCC reportsThe description of the Medieval Warm Period and Little Ice Age in IPCC reports has changed since the first report in 1990 as scientific understanding of the temperature record of the past 1000 years has improved...
2nd millennium
File:2nd millennium montage.png|From left, clockwise: In 1492, Christopher Columbus; The American Revolution; The French Revolution; The Atomic Bomb from World War II; An alternate source of light, the Light Bulb; For the first time, a human being sets foot on the moon in 1969 during the Apollo 11...
describes the reconstruction of temperatures since 1000 CE on the Northern Hemisphere
Northern Hemisphere
The Northern Hemisphere is the half of a planet that is north of its equator—the word hemisphere literally means “half sphere”. It is also that half of the celestial sphere north of the celestial equator...
, later extended back to 1 CE and also to cover the southern hemisphere. A reconstruction is needed because a reliable surface temperature record exists only since about 1850. Studying past climate is of interest for scientists in order to improve the understanding of current climate variability and, relatedly, providing a better basis for future climate projections. In particular, if the nature and magnitude of natural climate variability can be established, scientists will be able to better detect and attribute anthropogenic global warming
Global warming
Global warming refers to the rising average temperature of Earth's atmosphere and oceans and its projected continuation. In the last 100 years, Earth's average surface temperature increased by about with about two thirds of the increase occurring over just the last three decades...
. Note, however, that although temperature reconstructions from proxy data help us understand the character of natural climate variability, attribution of recent climate change
Attribution of recent climate change
Attribution of recent climate change is the effort to scientifically ascertain mechanisms responsible for recent changes observed in the Earth's climate...
relies on a broad range of methodologies of which the proxy reconstructions are only a small part.
According to all major temperature reconstructions published in peer-reviewed journals (see graph), the increase in temperature in the 20th century and the temperature in the late 20th century is the highest in the record. Attention has tended to focus on the early work of Michael E. Mann, Bradley and Hughes (1998), whose "hockey stick" graph was featured in the 2001 United Nations
United Nations
The United Nations is an international organization whose stated aims are facilitating cooperation in international law, international security, economic development, social progress, human rights, and achievement of world peace...
Intergovernmental Panel on Climate Change
Intergovernmental Panel on Climate Change
The Intergovernmental Panel on Climate Change is a scientific intergovernmental body which provides comprehensive assessments of current scientific, technical and socio-economic information worldwide about the risk of climate change caused by human activity, its potential environmental and...
report. The methodology and data sets used in creating the Mann et al. (1998) version of the hockey stick graph are disputed
Hockey stick controversy
The hockey stick controversy refers to debates over the technical correctness and implications for global warming of graphs showing reconstructed estimates of the temperature record of the past 1000 years...
by Stephen McIntyre
Stephen McIntyre
Stephen McIntyre is a Canadian mathematician, former minerals prospector, and semi-retired mining consultant who is best known as the founder and editor of Climate Audit, a blog devoted to the analysis and discussion of climate data...
and Ross McKitrick
Ross McKitrick
Ross McKitrick is a Canadian economist specializing in environmental economics and policy analysis. He is professor of economics at the University of Guelph; a senior fellow of the Fraser Institute, a Canadian free-market public policy think tank; and a member of the academic advisory boards of the...
, but the graph is overall acknowledged by the scientific community.
General techniques and accuracy
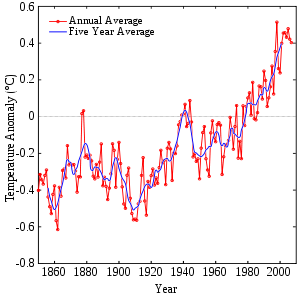
By far the best observed period is from 1850 to the present day, with coverage improving over time. Over this period the recent instrumental recordInstrumental temperature record
The instrumental temperature record shows fluctuations of the temperature of the global land surface and oceans. This data is collected from several thousand meteorological stations, Antarctic research stations and satellite observations of sea-surface temperature. Currently, the longest-running...
, mainly based on direct thermometer
Thermometer
Developed during the 16th and 17th centuries, a thermometer is a device that measures temperature or temperature gradient using a variety of different principles. A thermometer has two important elements: the temperature sensor Developed during the 16th and 17th centuries, a thermometer (from the...
readings, has approximately global coverage. It shows a general warming in global temperatures.
Before this time various proxies must be used. These proxies are less accurate than direct thermometer measurements, have lower temporal resolution, and have less spatial coverage. Their only advantage is that they enable a longer record to be reconstructed. Since the direct temperature record is more accurate than the proxies (indeed, it is needed to calibrate them) it is used when available: i.e., from 1850 onwards.
Quantitative methods using proxy data
As there are few instrumental records before 1850, temperatures before then must be reconstructed based on proxyProxy (climate)
In the study of past climates is known as paleoclimatology, climate proxies are preserved physical characteristics of the past that stand in for direct measurements , to enable scientists to reconstruct the climatic conditions that prevailed during much of the Earth's history...
methods. One such method, based on principles of dendroclimatology
Dendroclimatology
Dendroclimatology is the science of determining past climates from trees . Tree rings are wider when conditions favor growth, narrower when times are difficult. Other properties of the annual rings, such as maximum latewood density have been shown to be better proxies than simple ring width...
, uses the width and other characteristics of tree rings to infer temperature. The isotopic
Isotope
Isotopes are variants of atoms of a particular chemical element, which have differing numbers of neutrons. Atoms of a particular element by definition must contain the same number of protons but may have a distinct number of neutrons which differs from atom to atom, without changing the designation...
composition of snow, corals, and stalactites can also be used to infer temperature. Other techniques which have been used include examining records of the time of crop harvests, the treeline in various locations, and other historical records to make inferences about the temperature. These proxy reconstructions are indirect inferences of temperature and thus tend to have greater uncertainty than instrumental data.
In general, the recent history of the proxy records is calibrated against local temperature records to estimate the relationship between temperature and the proxy. The longer history of the proxy is then used to reconstruct temperature from earlier periods. Proxy records must be averaged in some fashion if a global or hemispheric record is desired. Considerable care must be taken in the averaging process; for example, if a certain region has a large number of tree ring records, a simple average of all the data would strongly over-weight that region. Hence data-reduction techniques such as principal components analysis
Principal components analysis
Principal component analysis is a mathematical procedure that uses an orthogonal transformation to convert a set of observations of possibly correlated variables into a set of values of uncorrelated variables called principal components. The number of principal components is less than or equal to...
are used to combine some of these regional records before they are globally combined.
An important distinction is between so-called 'multi-proxy' reconstructions, which attempt to obtain a global temperature reconstructions by using multiple proxy records distributed over the globe and more regional reconstructions. Usually, the various proxy records are combined arithmetically, in some weighted average. More recently, Osborn and Briffa used a simpler technique, counting the proportion of records that are positive, negative or neutral in any time period. This produces a result in general agreement with the conventional multi-proxy studies.
Several reconstructions suggest there was minimal variability in temperatures prior to the 20th century (see, for example, http://www.cru.uea.ac.uk/cru/info/milltemp/). More recently, Mann and Jones have extended their reconstructions to cover the 1st and 2nd millennia (GRL, 2003 ). The work was reproduced by Wahl and Ammann in 2005 .
The Mann, Bradley and Hughes (1998) version of the temperature record is known as the "Hockey Stick" graph, first coined by Jerry Mahlman
Jerry Mahlman
-Biography:Mahlman received his undergraduate degree from Chadron State College in 1962 and his Ph.D. from Colorado State University in 1967. From 1970 until 2000 he worked at the Geophysical Fluid Dynamics Laboratory of the National Oceanic and Atmospheric Administration at Princeton, serving as...
, director of the Geophysical Fluid Dynamics Laboratory
Geophysical Fluid Dynamics Laboratory
The Geophysical Fluid Dynamics Laboratory is a laboratory in the National Oceanic and Atmospheric Administration /Office of Oceanic and Atmospheric Research . The current director is Dr. V...
.
The work of Mann et al., Jones et al., Briffa and others forms a major part of the IPCC TAR's conclusion that "the rate and magnitude of global or hemispheric surface 20th century warming is likely to have been the largest of the millennium, with the 1990s and 1998 likely to have been the warmest decade and year". The IPCC AR4 concluced that "Average Northern Hemisphere temperatures during the second half of the 20th century were very likely higher than during any other 50-year period in the last 500 years and likely the highest in at least the past 1,300 years" .
Qualitative reconstruction using historical records
It is also possible to use historical data such as times of grape harvests, sea-ice-free periods in harbours and diary entries of frost or heatwaves to produce indications of when it was warm or cold in particular regions. These records are harder to calibrate, are often only available sparsely through time, may be available only from developed regions, and are unlikely to come with good error estimates. These historical observations of the same time period show periods of both warming and cooling.Astrophysicist Sallie Baliunas
Sallie Baliunas
Sallie Baliunas is an astrophysicist at the Harvard-Smithsonian Center for Astrophysics in the Solar, Stellar, and Planetary Sciences Division and formerly Deputy Director of the Mount Wilson Observatory. She serves as Senior Scientist at the George C. Marshall Institute in Washington, DC, and...
notes that these temperature variations correlate with solar variation
Solar variation
Solar variation is the change in the amount of radiation emitted by the Sun and in its spectral distribution over years to millennia. These variations have periodic components, the main one being the approximately 11-year solar cycle . The changes also have aperiodic fluctuations...
and asserts that the number of observed sunspot
Sunspot
Sunspots are temporary phenomena on the photosphere of the Sun that appear visibly as dark spots compared to surrounding regions. They are caused by intense magnetic activity, which inhibits convection by an effect comparable to the eddy current brake, forming areas of reduced surface temperature....
s give us a rough measure of how bright the sun is. Balunias and others have suggested that periods of decreased solar radiation are partially responsible for historically recorded periods of cooling such as the Maunder Minimum
Maunder Minimum
The Maunder Minimum is the name used for the period roughly spanning 1645 to 1715 when sunspots became exceedingly rare, as noted by solar observers of the time....
and the Little Ice Age
Little Ice Age
The Little Ice Age was a period of cooling that occurred after the Medieval Warm Period . While not a true ice age, the term was introduced into the scientific literature by François E. Matthes in 1939...
. The same argument would imply that periods of increased solar radiation contributed to the Medieval Warm Period
Medieval Warm Period
The Medieval Warm Period , Medieval Climate Optimum, or Medieval Climatic Anomaly was a time of warm climate in the North Atlantic region, that may also have been related to other climate events around the world during that time, including in China, New Zealand, and other countries lasting from...
, when Greenland
Greenland
Greenland is an autonomous country within the Kingdom of Denmark, located between the Arctic and Atlantic Oceans, east of the Canadian Arctic Archipelago. Though physiographically a part of the continent of North America, Greenland has been politically and culturally associated with Europe for...
's icy coastal areas thawed enough to permit farming and colonisation.
Limitations
The apparent differences between the quantitative and qualitative approaches are not fully reconciled. The reconstructions mentioned above rely on various assumptions to generate their results. If these assumptions do not hold, the reconstructions would be unreliable. For quantitative reconstructions, the most fundamental assumptions are that proxy records vary with temperature and that non-temperature factors do not confound the results. In the historical records temperature fluctuations may be regional rather than hemispheric in scale.In a letter to Nature (August 10, 2006) Bradley, Hughes and Mann pointed at the original title of their 1998 article: Northern Hemisphere temperatures during the past millennium: inferences, uncertainties, and limitations and pointed out more widespread high-resolution data are needed before more confident conclusions can be reached and that the uncertainties were the point of the article.
The hockey stick controversy
There is an ongoing debate about the details of the temperature record and the means of its reconstruction, centered on the Mann, Bradley and Hughes (1998), "hockey stick" graph. Stephen McIntyre and Ross McKitrick claimed various errors in the methodology of Mann et al. (1998) and that the method of Mann, Bradley, and Hughes "when tested on persistent red noise, nearly always produces a hockey stick shaped first principal component". In turn, Michael E. Mann (supported by Tim Osborn, Keith BriffaKeith Briffa
Professor Keith R. Briffa is a climatologist employed since 1977 by the Climatic Research Unit at the University of East Anglia, of which he is currently deputy director. In his professional work, he focuses on the climate change in late Holocene, with a special focus on northern portions of...
and Phil Jones of the Climatic Research Unit
Climatic Research Unit
The Climatic Research Unit is a component of the University of East Anglia and is one of the leading institutions concerned with the study of natural and anthropogenic climate change....
) has disputed the claims made by McIntyre and McKitrick. The IPCC Fourth Assessment Report
IPCC Fourth Assessment Report
Climate Change 2007, the Fourth Assessment Report of the United Nations Intergovernmental Panel on Climate Change , is the fourth in a series of reports intended to assess scientific, technical and socio-economic information concerning climate change, its potential effects, and options for...
says that McIntyre and McKitrick "may have some theoretical foundation, but Wahl and Ammann (2006) also show that the impact on the amplitude of the final reconstruction is very small (~0.05°C)."
See also
- Temperature record since 1880
- CLIWOCCliwocThe Climatological database for the world's oceans was a research project to convert ships' logbooks into a computerised database. It was funded by the European Union, and the bulk of the work was done between 2001 and 2003...
- Climatological database for the world's oceans - DendroclimatologyDendroclimatologyDendroclimatology is the science of determining past climates from trees . Tree rings are wider when conditions favor growth, narrower when times are difficult. Other properties of the annual rings, such as maximum latewood density have been shown to be better proxies than simple ring width...
- Table of historic and prehistoric climate indicatorsTable of Historic and Prehistoric Climate IndicatorsThis table is a reference tool for rapidly locating Wikipedia articles on Historic and Prehistoric climate indicators of all types.To Add:* Alkenone analysis* TEX-86 analysis* Nile river flood levels* Trace mineral ratios in deltaic sediment...