
Spectrogram
Overview
Spectral density
In statistical signal processing and physics, the spectral density, power spectral density , or energy spectral density , is a positive real function of a frequency variable associated with a stationary stochastic process, or a deterministic function of time, which has dimensions of power per hertz...
of a signal varies with time. Also known as spectral waterfalls, sonograms, voiceprints, or voicegrams, spectrograms are used to identify phonetic
Phonetics
Phonetics is a branch of linguistics that comprises the study of the sounds of human speech, or—in the case of sign languages—the equivalent aspects of sign. It is concerned with the physical properties of speech sounds or signs : their physiological production, acoustic properties, auditory...
sounds, to analyse the cries of animals; they were also used in many other fields including music
Music
Music is an art form whose medium is sound and silence. Its common elements are pitch , rhythm , dynamics, and the sonic qualities of timbre and texture...
, sonar
Sonar
Sonar is a technique that uses sound propagation to navigate, communicate with or detect other vessels...
/radar
Radar
Radar is an object-detection system which uses radio waves to determine the range, altitude, direction, or speed of objects. It can be used to detect aircraft, ships, spacecraft, guided missiles, motor vehicles, weather formations, and terrain. The radar dish or antenna transmits pulses of radio...
, speech processing
Speech processing
Speech processing is the study of speech signals and the processing methods of these signals.The signals are usually processed in a digital representation, so speech processing can be regarded as a special case of digital signal processing, applied to speech signal.It is also closely tied to...
, seismology
Seismology
Seismology is the scientific study of earthquakes and the propagation of elastic waves through the Earth or through other planet-like bodies. The field also includes studies of earthquake effects, such as tsunamis as well as diverse seismic sources such as volcanic, tectonic, oceanic,...
, etc. The instrument that generates a spectrogram is called a spectrograph and is equivalent to a sonograph.
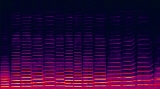
The most common format is a graph with two geometric dimensions: the horizontal axis represents time
Time
Time is a part of the measuring system used to sequence events, to compare the durations of events and the intervals between them, and to quantify rates of change such as the motions of objects....
, the vertical axis is frequency
Frequency
Frequency is the number of occurrences of a repeating event per unit time. It is also referred to as temporal frequency.The period is the duration of one cycle in a repeating event, so the period is the reciprocal of the frequency...
; a third dimension indicating the amplitude
Amplitude
Amplitude is the magnitude of change in the oscillating variable with each oscillation within an oscillating system. For example, sound waves in air are oscillations in atmospheric pressure and their amplitudes are proportional to the change in pressure during one oscillation...
of a particular frequency at a particular time is represented by the intensity or colour of each point in the image.
There are many variations of format: sometimes the vertical and horizontal axes are switched, so time runs up and down; sometimes the amplitude is represented as the height of a 3D surface instead of color or intensity.