
Personal income in the United States
Encyclopedia
Personal income is an individual’s total earnings from wages, investment interest, and other sources. In the United States
United States
The United States of America is a federal constitutional republic comprising fifty states and a federal district...
the most widely cited personal income statistics are the Bureau of Economic Analysis
Bureau of Economic Analysis
The Bureau of Economic Analysis is an agency in the United States Department of Commerce that provides important economic statistics including the gross domestic product of the United States. Its stated mission is to "promote a better understanding of the U.S...
’s personal income and the Census Bureau’s per capita money income. The two statistics spring from different traditions of measurement—personal income from national economic accounts and money income from household surveys. BEA's statistics relate personal income to measures of production, including GDP, and is considered an indicator of consumer spending. Census's statistics provide detail on income distribution and demographics and are used to produce the nation's official poverty statistics.
Income patterns are evident on the basis of age, sex, race and educational characteristics
Educational attainment in the United States
The educational attainment of the U.S. population is similar to that of many other industrialized countries with the vast majority of the population having completed secondary education and a rising number of college graduates that outnumber high school dropouts. As a whole, the population of the...
. In 2005 roughly half of all those with graduate degrees were among the nation's top 15% of income earners. Among different demographics (sex, marital status, race, gender) for those over the age of 18, median personal income ranged from $3,317 for an unemployed, married Asian American
Asian American
Asian Americans are Americans of Asian descent. The U.S. Census Bureau definition of Asians as "Asian” refers to a person having origins in any of the original peoples of the Far East, Southeast Asia, or the Indian subcontinent, including, for example, Cambodia, China, India, Indonesia, Japan,...
female to $55,935 for a full-time, year-round employed Asian American male.
According to the US Census men tended to have higher income than women while Asians and Whites
White American
White Americans are people of the United States who are considered or consider themselves White. The United States Census Bureau defines White people as those "having origins in any of the original peoples of Europe, the Middle East, or North Africa...
earned more than African American
African American
African Americans are citizens or residents of the United States who have at least partial ancestry from any of the native populations of Sub-Saharan Africa and are the direct descendants of enslaved Africans within the boundaries of the present United States...
s and Hispanics
Hispanic and Latino Americans
Hispanic or Latino Americans are Americans with origins in the Hispanic countries of Latin America or in Spain, and in general all persons in the United States who self-identify as Hispanic or Latino.1990 Census of Population and Housing: A self-designated classification for people whose origins...
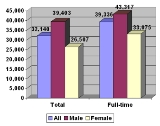
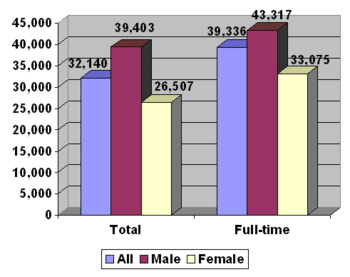
. The overall median personal income for all individuals over the age of 18 was $24,062 ($32,140 for those age 25 or above) in the year 2005. The overall median income for all 155 million persons over the age of 15 who worked with earnings in 2005 was $28,567.
As a reference point, the minimum wage rate in 2009 was $7.25 per hour or $15,080 for the 2080 hours in a typical work year. The minimum wage is a little more than the poverty level for the 1 person family unit and about 50% of the poverty level for a family of four (see Poverty in the United States
Poverty in the United States
Poverty is defined as the state of one who lacks a usual or socially acceptable amount of money or material possessions. According to the U.S. Census Bureau data released Tuesday September 13th, 2011, the nation's poverty rate rose to 15.1% in 2010, up from 14.3% in 2009 and to its highest level...
). Annual wages of $30,160; $45,240; $75,400; $150,800 and $1.5M correspond to 2, 3, 5, 10 and 100 times minimum wage respectively.
Personal Income and Disposable Personal Income
BEAY’s personal income measures the income received by persons from participation in production, from government and business transfers, and from holding interest-bearing securities and corporate stocks. Personal income also includes income received by nonprofit institutions serving households, by private non-insured welfare funds, and by private trust funds. BEA also publishes disposable personal income, which measures the income available to households after paying federal and state and local government income taxes.Income from production is generated both by the labor of individuals (for example, in the form of wages and salaries and of proprietors’ income) and by the capital that they own (in the form of rental income of persons). Income that is not earned from production in the current period—such as capital gains, which relate to changes in the price of assets over time—is excluded.
BEA’s monthly personal income estimates are one of several key macroeconomic indicators that the National Bureau of Economic Research considers when dating the business cycle.
Personal income and disposable personal income are provided both as aggregate and as per capita statistics. BEA produces monthly estimates of personal income for the nation, quarterly estimates of state personal income, and annual estimates of local-area personal income. More information is found on BEA's website.
Census Money Income
The Census Bureau collects income data on several major surveys, including the Annual Social and Economic Supplement (ASEC) of the Current Population Survey (CPS), the Survey of Income and Program Participation (SIPP), and the American Community Survey (ACS). The CPS is the source of the official national estimates of poverty and the most widely cited source of annual household income estimates for the United States.The CPS measure of money income is defined as the total pre-tax cash income received by people on a regular basis, excluding certain lump-sum payments and excluding capital gains.
The Census Bureau also produces alternative estimates of income and poverty based on broadened definitions of income that include many of these income components that are not included in money income.
The Census Bureau releases estimates of household money income as medians, percent distributions by income categories, and on a per capita basis. Estimates are available by demographic characteristics of householders and by the composition of households. More details on income concepts and sources are found on the Census Bureau’s website.
By educational attainment
| Measure | Some High School | High school graduate | Some college | Associate's degree Associate's degree An associate degree is an undergraduate academic degree awarded by community colleges, junior colleges, technical colleges, and bachelor's degree-granting colleges and universities upon completion of a course of study usually lasting two years... |
Bachelor's degree or higher Bachelor's degree or higher Bachelor's degree or higher is a commonly used term by the United States Census Bureau and other U.S. government agencies on the federal as well as state and local level. The term describes the portion of the population that has either a bachelor's degree or a higher degree such as a master's or... |
Bachelor's degree Bachelor's degree A bachelor's degree is usually an academic degree awarded for an undergraduate course or major that generally lasts for three or four years, but can range anywhere from two to six years depending on the region of the world... |
Master's degree Master's degree A master's is an academic degree granted to individuals who have undergone study demonstrating a mastery or high-order overview of a specific field of study or area of professional practice... |
Professional degree | Doctorate degree Doctorate A doctorate is an academic degree or professional degree that in most countries refers to a class of degrees which qualify the holder to teach in a specific field, A doctorate is an academic degree or professional degree that in most countries refers to a class of degrees which qualify the holder... |
|---|---|---|---|---|---|---|---|---|---|
| Persons, age 25+ w/ earnings | $20,321 | $26,505 | $31,056 | $35,009 | $49,303 | $43,143 | $52,390 | $82,473 | $69,432 |
| Male, age 25+ w/ earnings | $24,192 | $32,085 | $39,150 | $42,382 | $60,493 | $52,265 | $67,123 | $100,000 | $78,324 |
| Female, age 25+ w/ earnings | $15,073 | $21,117 | $25,185 | $29,510 | $40,483 | $36,532 | $45,730 | $66,055 | $54,666 |
| Persons, age 25+, employed full-time | $25,039 | $31,539 | $37,135 | $40,588 | $56,078 | $50,944 | $61,273 | $100,000 | $79,401 |
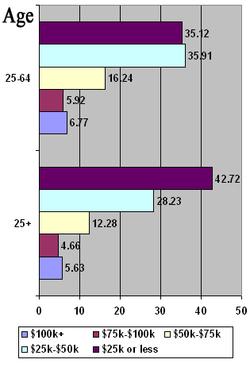
Income distribution
Of those individuals with income who were older than 25 years of age, over 42% had incomes below $25,000 while the top 10% had incomes exceeding $82,500 a year. The distribution of income among individuals differs substantially from household incomesHousehold income in the United States
Household income is a measure commonly used by the United States government and private institutions, that counts the income of all residents over the age of 18 in each household, including not only all wages and salaries, but such items as unemployment insurance, disability payments, child support...
as 42% of all households had two or more income earners. As a result 20.5% of households have six figure incomes, even though only 6.24% of Americans had incomes exceeding $100,000. The following chart shows the income distribution among all 211,832,000 individuals aged 15 or higher as recorded by the United States Census Bureau.
| Income range | Number of individuals (in thousands) | Percent in group | Percent Below | Cumulative percentages | |||
|---|---|---|---|---|---|---|---|
| Under $2,500 | 12,945 | 6.11 | 0 | less than $25k 47.39% |
less than $50k 75.40% |
||
| $2,500 to $4,999 | 7,408 | 3.50 | 6.11 | ||||
| $5,000 to $7,499 | 9,980 | 4.71 | 9.61 | ||||
| $7,500 to $9,999 | 11,496 | 5.43 | 14.32 | ||||
| $10,000 to $12,499 | 12,874 | 6.08 | 19.75 | ||||
| $12,500 to $14,999 | 9,107 | 4.30 | 25.83 | ||||
| $15,000 to $17,499 | 11,052 | 5.22 | 30.13 | ||||
| $17,500 to $19,999 | 7,749 | 3.66 | 35.35 | ||||
| $20,000 to $22,499 | 10,944 | 5.17 | 39.01 | ||||
| $22,500 to $24,999 | 6,798 | 3.21 | 44.18 | ||||
| $25,000 to $50,000 | |||||||
| $25,000 to $27,499 | 9,192 | 4.34 | 47.39 | $25k-$50k 28.01% |
|||
| $27,500 to $29,999 | 5,749 | 2.71 | 51.73 | ||||
| $30,000 to $32,499 | 9,835 | 4.64 | 54.44 | ||||
| $32,500 to $34,999 | 4,243 | 2.00 | 59.08 | ||||
| $35,000 to $37,499 | 7,917 | 3.74 | 61.08 | ||||
| $37,500 to $39,999 | 3,978 | 1.88 | 64.82 | ||||
| $40,000 to $42,499 | 7,568 | 3.57 | 66.70 | ||||
| $42,500 to $44,999 | 2,879 | 1.36 | 70.27 | ||||
| $45,000 to $47,499 | 5,106 | 2.41 | 71.63 | ||||
| $47,500 to $49,999 | 2,888 | 1.36 | 74.04 | ||||
| $50,000 to $75,000 | |||||||
| $50,000 to $52,499 | 6,569 | 3.10 | 75.40 | $50k-$75k 13.17% |
$50k-$100k 18.36% |
||
| $52,500 to $54,999 | 2,394 | 1.13 | 78.50 | ||||
| $55,000 to $57,499 | 3,360 | 1.59 | 79.63 | ||||
| $57,500 to $59,999 | 1,776 | 0.84 | 81.22 | ||||
| $60,000 to $62,499 | 4,345 | 2.05 | 82.06 | ||||
| $62,500 to $64,999 | 1,576 | 0.74 | 84.11 | ||||
| $65,000 to $67,499 | 2,602 | 1.23 | 84.85 | ||||
| $67,500 to $69,999 | 1,307 | 0.62 | 86.08 | ||||
| $70,000 to $72,499 | 2,857 | 1.35 | 86.70 | ||||
| $72,500 to $74,999 | 1,104 | 0.52 | 88.05 | ||||
| $75,000 to $100,000 | |||||||
| $75,000 to $77,499 | 2,166 | 1.02 | 88.57 | $75k-$100k 5.19% |
|||
| $77,500 to $79,999 | 973 | 0.46 | 89.59 | ||||
| $80,000 to $82,499 | 2,135 | 1.01 | 90.05 | ||||
| $82,500 to $84,999 | 751 | 0.35 | 91.06 | ||||
| $85,000 to $87,499 | 1,193 | 0.56 | 91.41 | ||||
| $87,500 to $89,999 | 613 | 0.29 | 91.97 | ||||
| $90,000 to $92,499 | 1,385 | 0.65 | 92.26 | ||||
| $92,500 to $94,999 | 525 | 0.25 | 92.91 | ||||
| $95,000 to $97,499 | 830 | 0.39 | 93.16 | ||||
| $97,500 to $99,999 | 448 | 0.21 | 93.55 | ||||
| $100,000 or more | |||||||
| $100,000 or more | 13,215 | 6.24 | 93.76 | ||||
SOURCE: US Census Bureau, 2008
Over time - by Race & Sex
This chart is median income of 15 year olds or older, who have non-zero income. Amounts are shown in nominal dollars and in real dollars in parentheses, 2004 dollars.| 1950 | 1960 | 1970 | 1980 | 1990 | 2000 | 2004 | ||
| Overall | Male | $2,570 ($17,076) | $4,080 ($22,051) | $6,670 ($28,100) | $12,530 ($27,206) | $20,293 ($28,439) | $28,343 ($31,089) | $30,513 |
| Female | $953 ($6,333) | $1,261 ($6,815) | $2,237 ($9,424) | $4,920 ($10,683) | $10,070 ($14,112) | $16,063 ($17,619) | $17,629 | |
| White/European American | Male | $2,709 ($18,001) | $4,296 ($23,219) | $7,011 ($30,536) | $13,328 ($28,939) | $21,170 ($29,668) | $29,797 ($32,684) | $31,335 |
| Female | $1,060 ($7,044) | $1,352 ($7,307) | $2,266 ($9,546) | $4,947 ($10,741) | $10,317 ($14,459) | $16,079 ($17,637) | $17,648 | |
| Black/African American | Male | $1,471 ($9,775) | $2,260 ($12,215) | $4,157 ($17,513) | $8,009 ($17,390) | $12,868 ($18,034) | $21,343 ($23,411) | $22,740 |
| Female | $474 ($3,150) | $837 ($4,524) | $2,063 ($8,691) | $4,580 ($9,944) | $8,328 ($11,671) | $15,581 ($17,420) | $18,379 | |
| Asian | Male | NA | NA | NA | NA | $19,394 ($27,179) | $30,833 ($33,820) | $32,419 |
| Female | NA | NA | NA | NA | $11,086 ($15,536) | $17,356 ($19,038) | $20,618 | |
Race
Personal income varied significantly with an individual's racial characteristics with racial discrepancies having remained largely stagnant since 1996. Overall, Asian AmericanAsian American
Asian Americans are Americans of Asian descent. The U.S. Census Bureau definition of Asians as "Asian” refers to a person having origins in any of the original peoples of the Far East, Southeast Asia, or the Indian subcontinent, including, for example, Cambodia, China, India, Indonesia, Japan,...
s enjoyed higher median personal incomes than any other racial demographic. The only exception was among the holders of graduate degrees
Educational attainment in the United States
The educational attainment of the U.S. population is similar to that of many other industrialized countries with the vast majority of the population having completed secondary education and a rising number of college graduates that outnumber high school dropouts. As a whole, the population of the...
who consititute 8.9% of the population. Among those with a Master's, Professional or Doctorate degree those who identified as White
White American
White Americans are people of the United States who are considered or consider themselves White. The United States Census Bureau defines White people as those "having origins in any of the original peoples of Europe, the Middle East, or North Africa...
had the highest median individual income. Asian Americans had a median income roughly ten percent higher than that of Whites. This racial income gap was relatively small.
Those identifying as Hispanic or Latino (who may have been of any "race") had the lowest overall median personal income, earning 28.51% less than Whites and 35% less than Asian American
Asian American
Asian Americans are Americans of Asian descent. The U.S. Census Bureau definition of Asians as "Asian” refers to a person having origins in any of the original peoples of the Far East, Southeast Asia, or the Indian subcontinent, including, for example, Cambodia, China, India, Indonesia, Japan,...
s. The second largest racial or ethnic gap was between Whites and African American
African American
African Americans are citizens or residents of the United States who have at least partial ancestry from any of the native populations of Sub-Saharan Africa and are the direct descendants of enslaved Africans within the boundaries of the present United States...
s with the former earning roughly 22% more than the latter. Thus one can observe a significant discrepancy with the median income of Asians and Whites and that of African Americans and Hispanics.
Overall the race gap between African Americans and Whites has remained roughly equal between both races over the past decade. Both races saw a gain in median income between 1996 and 2006, with the income growth among African Americans slightly outpacing that of Whites. In 1996 the median income for Whites was $5,957 (31%) higher than for Blacks. In 2006 the gap in median incomes was nearly identical with the median income for Whites being $5,929 (22%) higher than that for African Americans. While the gap remains numerically unchanged, the percentage difference between the two races has decreased as a result of mutual increases in median personal income.
Measuring income by per capita is another way to look at personal earnings by race. Unlike median statistics, per capita statistics are
affected by extremely high and low incomes. According to the U.S Census Bureau "The per capita income for the overall population in 2008 was $26,964; for non-Hispanic Whites, it was $31,313; for Blacks, it was $18,406; for Asians, it was $30,292; and for Hispanics, it was $15,674".
| Race | Overall Median | High School | Some College | College Graduate | Bachelor's Degree | Master's Degree | Doctorate Degree | |
|---|---|---|---|---|---|---|---|---|
| Total population | All, age 25+ | 32,140 | 26,505 | 31,054 | 49,303 | 43,143 | 52,390 | 70,853 |
| Full-time workers, age 25-64 | 39,509 | 31,610 | 37,150 | 56,027 | 50,959 | 61,324 | 79,292 | |
| White alone | All, age 25+ | 33,030 | 27,311 | 31,564 | 49,972 | 43,833 | 52,318 | 85,658 |
| Full-time workers, age 25-64 | 40,422 | 32,427 | 38,481 | 56,903 | 51,543 | 61,441 | 77,906 | |
| Asian alone | All, age 25+ | 36,152 | 25,285 | 29,982 | 51,481 | 42,466 | 61,452 | 69,653 |
| Full-time workers, age 25-64 | 42,109 | 27,041 | 33,120 | 60,532 | 51,040 | 71,316 | 91,430 | |
| African American | All, age 25+ | 27,101 | 22,379 | 27,648 | 44,534 | 41,572 | 48,266 | 61,894 |
| Full-time workers, age 25-64 | 32,021 | 26,230 | 32,392 | 47,758 | 45,505 | 52,858 | N/A | |
| Hispanic or Latino | All, age 25+ | 23,613 | 22,941 | 28,698 | 41,596 | 37,819 | 50,901 | 67,274 |
| Full-time workers, age 25-64 | 27,266 | 26,461 | 33,120 | 46,594 | 41,831 | 53,880 | N/A | |
SOURCE: US Census Bureau, 2006
See also
- Adjusted Gross IncomeAdjusted Gross IncomeFor United States individual income tax, taxable income is adjusted gross income less allowances for personal exemptions and itemized deductions. Adjusted gross income is total gross income minus specific items laid out in the tax code...
which includes AGI by year for the USA. - Economy of the United StatesEconomy of the United StatesThe economy of the United States is the world's largest national economy. Its nominal GDP was estimated to be nearly $14.5 trillion in 2010, approximately a quarter of nominal global GDP. The European Union has a larger collective economy, but is not a single nation...
- Income inequality metricsIncome inequality metricsThe concept of inequality is distinct from that of poverty and fairness. Income inequality metrics or income distribution metrics are used by social scientists to measure the distribution of income, and economic inequality among the participants in a particular economy, such as that of a specific...
- Atkinson indexAtkinson indexThe Atkinson index is a measure of income inequality developed by British economist Anthony Barnes Atkinson...
- Gini coefficientGini coefficientThe Gini coefficient is a measure of statistical dispersion developed by the Italian statistician and sociologist Corrado Gini and published in his 1912 paper "Variability and Mutability" ....
- Hoover index
- Theil indexTheil indexThe Theil index is a statistic used to measure economic inequality. It has also been used to measure the lack of racial diversity. The basic Theil index TT is the same as redundancy in information theory which is the maximum possible entropy of the data minus the observed entropy. It is a special...
- Atkinson index
External links
- Census Bureau Personal Income Statistics Forum
- Google - public data: GDP and Personal Income of the U.S. (annual): Personal Income
- Google - public data: GDP and Personal Income of the U.S. (annual): Personal Income per capita