
Morphometrics
Encyclopedia
Morphometrics refers to the quantitative analysis of form, a concept that encompasses size and shape. Morphometric analyses are commonly performed on organisms, and are useful in analyzing their fossil record, the impact of mutations on shape, developmental changes in form, covariances between ecological factors and shape, as well for estimating quantitative-genetic parameters of shape. Morphometrics can be used to quantify a trait of evolutionary significance, and by detecting changes in the shape, deduce something of their , function or evolutionary relationships. A major objective of morphometrics is to statistically test hypotheses about the factors that affect shape.
"Morphometrics", in the broader sense of the term, is also used to precisely locate certain areas of featureless organs such as the brain, and is used in describing the shapes of other things.
There are three recognized categories of landmarks . Type 1 landmarks are locally defined, meaning that they are defined in terms of structures close to that point; for example, an intersection between three sutures, or intersections between veins on an insect wing are locally defined and surrounded by tissue on all sides. Type 3 landmarks, in contrast, are defined in terms of points far away from the landmark, and are often defined in terms of a point "furthest away" from another point. Type 2 landmarks are intermediate; this category includes points such as the tip structure, or local minima and maxima of curvature. They are defined in terms of local features, but they are not surrounded on all sides. In addition to landmarks, there are "semilandmarks," points along a curve. Their position along the curve is arbitrary but these points provide information about curvature in two or three dimensions
Procrustes-based analyses have some limitations. One is that the Procrustes superimposition uses a least-squares criterion to find the optimal rotation; consequently, variation that is localized to a single landmark will be smeared out across many. This is called the "“Pinocchio Effect.” Another is that the superimposition may itself impose a pattern of covariation on the landmarks. Additionally, any information that cannot be captured by landmarks and semilandmarks cannot be analyzed, including classical measurements like "greatest skull breadth." Moreover, there are criticisms of Procrustes-based methods that motivate an alternative approach to analyzing landmark data.
 Outline analysis is another approach to analyzing shape. What distinguishes outline analysis is that coefficients of mathematical functions are fitted to points sampled along the outline. There are a number of ways of quantifying an outline. Older techniques such as the "fit to a polynomial curve"
and Principal components quantitative analysis have been superseded by the two main modern approaches: eigenshape analysis
,
name=Lohmann1983> and elliptical
fourier analysis (EFA),
name=Ferson1985> using hand- or computer-traced outlines. The former involves fitting a preset number of semilandmarks at equal intervals around the outline of a shape, recording the deviation of each step from semilandmark to semilandmark from what the angle of that step would be were the object a simple circle. The latter defines the outline as the sum of the minimum number of ellipses required to mimic the shape.
Both methods have their weaknesses; the most dangerous (and easily overcome) is their susceptibility to noise in the outline. Likewise, neither compares homologous points, and global change is always given more weight than local variation (which may have large biological consequences).
Eigenshape analysis requires an equivalent starting point to be set for each specimen, which can be a source of error
EFA also suffers from redundancy in that not all variables are independent. On the other hand, it is possible to apply them to complex curves without having to define a centroid; this makes removing the effect of location, size and rotation much simpler.
The perceived failings of outline morphometrics are that it doesn't compare points of a homologous origin, and that it oversimplifies complex shapes by restricting itself to considering the outline and not internal changes. Also, since it works by approximating the outline by a series of ellipses, it deals poorly with pointed shapes.
One criticism of outline-based methods is that they disregard homology – a famous example of this disregard being the ability of outline-based methods to compare a scapula
to a potato chip. Such a comparison which would not be possible if the data were restricted to biologically homologous points. An argument against that critique is that, if landmark approaches to morphometrics can be used to test biological hypotheses in the absence of homology data, it is inappropriate to fault outline-based approaches for enabling the same types of studies
Landmark data allow the difference between population means, or the deviation an individual from its population mean, to be visualized in at least two ways. One depicts vectors at landmarks that show the magnitude and direction in which that landmark is displaced relative to the others. The second depicts the difference via the thin plate splines, an interpolation function that models change between landmarks from the data of changes in coordinates of landmarks. This function produces what look like deformed grids; where regions that relatively elongated, the grid will look stretched and where those regions are relatively shortened, the grid will look compressed.
, the most common variants are voxel-based morphometry, deformation-based morphometry and surface-based morphometry of the brain
.
and processing of bone specimens in the laboratory, obtaining estimates of the proportional volumes and surfaces occupied by different components of bone. Obtaining a bone biopsy is accomplished by using a bone biopsy trephine
.
in the form of geomorphometrics
. It also has a host of other applications.
"Morphometrics", in the broader sense of the term, is also used to precisely locate certain areas of featureless organs such as the brain, and is used in describing the shapes of other things.
Forms of morphometrics
Three general approaches to form are usually distinguished: traditional morphometrics, landmark-based morphometrics and outline-based morphometrics."Traditional" morphometrics
Traditional morphometrics analyzes lengths, widths, masses, angles, ratios and areas (image). In general, traditional morphometric data are measurements of size. A drawback of using many measurements of size is that most will be highly correlated; as a result, there are few independent variables despite the many measurements. For instance, tibia length will vary femur length and also with humerus and ulna length and even with measurements of the head. Traditional morphometric data are nonetheless useful when either absolute or relative sizes are of particular interest, such as in studies of growth. These data are also useful when size measurements are of theoretical importance such as body mass and limb cross-sectional area and length in studies of functional morphology. However, these measurements have one important limitation: they contain little information about the spatial distribution of shape changes across the organism.
Landmark-based geometric morphometrics
In landmark-based geometric morphometrics that spatial information is contained in the data because the data are coordinates of "landmarks": discrete anatomical loci that are arguably homologous in all individuals in the analysis. For example, where intersect is a landmark as are intersections between veins on an insect wing or leaf. So are foramina, small holes through which veins and blood vessels pass. These points can be regarded as the "same" point in all specimens in the study. Landmark-based studies have traditionally analyzed 2D data, but with the increasing availability of 3D imaging techniques, 3D analysis are becoming more feasible even for small structures such as teeth. Finding enough landmarks to provide a comprehensive description of shape can be difficult when working with fossils or easily damaged specimens. That is because all landmarks must be present in all specimens, although coordinates of missing landmarks can be estimated. The data for each individual consists of a configuration of landmarks.There are three recognized categories of landmarks . Type 1 landmarks are locally defined, meaning that they are defined in terms of structures close to that point; for example, an intersection between three sutures, or intersections between veins on an insect wing are locally defined and surrounded by tissue on all sides. Type 3 landmarks, in contrast, are defined in terms of points far away from the landmark, and are often defined in terms of a point "furthest away" from another point. Type 2 landmarks are intermediate; this category includes points such as the tip structure, or local minima and maxima of curvature. They are defined in terms of local features, but they are not surrounded on all sides. In addition to landmarks, there are "semilandmarks," points along a curve. Their position along the curve is arbitrary but these points provide information about curvature in two or three dimensions
Procrustes-based geometric morphometrics
Shape analysis begins by removing the information that is not about shape. By definition, shape is not altered by translation, scaling or rotation. Thus, to compare shapes, the non-shape information is removed from the coordinates of landmarks. There is more than one way to do these three operations. One method is to fix the coordinates of two points to (0,0) and (0,1), which are the two ends of a baseline. In one step, the shapes are translated to the same position (the same two coordinates are fixed to those values), the shapes are scaled (to unit baseline length) and the shapes are rotated. An alternative, and preferred method, is Procrustes superimposition. This method translates the centroid of the shapes to (0,0); the x centroid of the centroid is the average of the x coordinates of the landmarks of an individual, and the y coordinate of the centroid is the average of the y-coordinates. Shapes are scaled to unit centroid size, which is the square root of the summed squared distances of each landmark to the centroid. The configuration is rotated to minimize the deviation between it and a reference, typically the mean shape. In the case of semi-landmarks, variation in position along the curve is also removed. Because shape space is curved, analyses are done by projecting shapes onto a space tangent to shape space. Within the tangent space, conventional multivariate statistical methods such as multivariate analysis of variance and multivariate regression, can be used to test statistical hypotheses about shape.Procrustes-based analyses have some limitations. One is that the Procrustes superimposition uses a least-squares criterion to find the optimal rotation; consequently, variation that is localized to a single landmark will be smeared out across many. This is called the "“Pinocchio Effect.” Another is that the superimposition may itself impose a pattern of covariation on the landmarks. Additionally, any information that cannot be captured by landmarks and semilandmarks cannot be analyzed, including classical measurements like "greatest skull breadth." Moreover, there are criticisms of Procrustes-based methods that motivate an alternative approach to analyzing landmark data.
Outline analysis
and Principal components quantitative analysis have been superseded by the two main modern approaches: eigenshape analysis
Ellipse
In geometry, an ellipse is a plane curve that results from the intersection of a cone by a plane in a way that produces a closed curve. Circles are special cases of ellipses, obtained when the cutting plane is orthogonal to the cone's axis...
,
name=Lohmann1983> and elliptical
Ellipse
In geometry, an ellipse is a plane curve that results from the intersection of a cone by a plane in a way that produces a closed curve. Circles are special cases of ellipses, obtained when the cutting plane is orthogonal to the cone's axis...
fourier analysis (EFA),
name=Ferson1985> using hand- or computer-traced outlines. The former involves fitting a preset number of semilandmarks at equal intervals around the outline of a shape, recording the deviation of each step from semilandmark to semilandmark from what the angle of that step would be were the object a simple circle. The latter defines the outline as the sum of the minimum number of ellipses required to mimic the shape.
Both methods have their weaknesses; the most dangerous (and easily overcome) is their susceptibility to noise in the outline. Likewise, neither compares homologous points, and global change is always given more weight than local variation (which may have large biological consequences).
Eigenshape analysis requires an equivalent starting point to be set for each specimen, which can be a source of error
EFA also suffers from redundancy in that not all variables are independent. On the other hand, it is possible to apply them to complex curves without having to define a centroid; this makes removing the effect of location, size and rotation much simpler.
The perceived failings of outline morphometrics are that it doesn't compare points of a homologous origin, and that it oversimplifies complex shapes by restricting itself to considering the outline and not internal changes. Also, since it works by approximating the outline by a series of ellipses, it deals poorly with pointed shapes.
One criticism of outline-based methods is that they disregard homology – a famous example of this disregard being the ability of outline-based methods to compare a scapula
Scapula
In anatomy, the scapula , omo, or shoulder blade, is the bone that connects the humerus with the clavicle ....
to a potato chip. Such a comparison which would not be possible if the data were restricted to biologically homologous points. An argument against that critique is that, if landmark approaches to morphometrics can be used to test biological hypotheses in the absence of homology data, it is inappropriate to fault outline-based approaches for enabling the same types of studies
Analyzing data
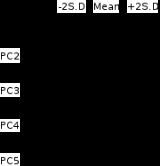
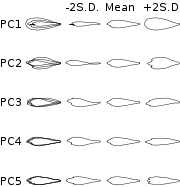
To display the differences in shape, the data need to be reduced to a comprehensible (low-dimensional) form. Principal component analysis (PCA) is the most commonly employed tool to do this. Simply put, the technique projects as much of the overall variation as possible into a few dimensions. See the figure (upload imminent) for an example. Each axis on a PCA plot is an eigenvector of the covariance matrix of shape variables. The first axis accounts for maximum variation in the sample, with further axes representing further ways in which the samples vary. The pattern of clustering of samples in this morphospace represents similarities and differences in shapes, which can reflect relationships. As well as exploring patterns of variation, Multivariate statistical methods can be used to test statistical hypotheses about factors that affect shape and to visualize their effects.Landmark data allow the difference between population means, or the deviation an individual from its population mean, to be visualized in at least two ways. One depicts vectors at landmarks that show the magnitude and direction in which that landmark is displaced relative to the others. The second depicts the difference via the thin plate splines, an interpolation function that models change between landmarks from the data of changes in coordinates of landmarks. This function produces what look like deformed grids; where regions that relatively elongated, the grid will look stretched and where those regions are relatively shortened, the grid will look compressed.
Neuroimaging
In neuroimagingNeuroimaging
Neuroimaging includes the use of various techniques to either directly or indirectly image the structure, function/pharmacology of the brain...
, the most common variants are voxel-based morphometry, deformation-based morphometry and surface-based morphometry of the brain
Brain
The brain is the center of the nervous system in all vertebrate and most invertebrate animals—only a few primitive invertebrates such as sponges, jellyfish, sea squirts and starfishes do not have one. It is located in the head, usually close to primary sensory apparatus such as vision, hearing,...
.
Bone histomorphometry
Histomorphometry of bone involves obtaining a bone biopsy specimenTrephine
A trephine is a surgical instrument with a cylindrical blade. It can be of one of several dimensions and designs depending on what it is going to be used for. They may be specially designed for obtaining a cylindrically shaped core of bone that can be used for tests and bone studies, cutting holes...
and processing of bone specimens in the laboratory, obtaining estimates of the proportional volumes and surfaces occupied by different components of bone. Obtaining a bone biopsy is accomplished by using a bone biopsy trephine
Rochester bone biopsy trephine
The Rochester bone biopsy trephine is a surgical instrument that enables a 7.5 mm percutaneous bone biopsy of the iliac crest, or hip, in a human patient. Samples are used for bone histology and histomorphometry.Stephen F...
.
Other applications
The application of morphometrics is not restricted to biological uses. It can also be applied to terrainTerrain
Terrain, or land relief, is the vertical and horizontal dimension of land surface. When relief is described underwater, the term bathymetry is used...
in the form of geomorphometrics
Geomorphometrics
Geomorphometrics is the discipline based on the computational measures of the geometry, topography and shape of the Earth's horizons, and their temporal change...
. It also has a host of other applications.
See also
- Allometry
- D'Arcy Wentworth ThompsonD'Arcy Wentworth ThompsonSir D'Arcy Wentworth Thompson CB FRS FRSE was a Scottish biologist, mathematician, and classics scholar. A pioneering mathematical biologist, he is mainly remembered as the author of the 1917 book On Growth and Form, written largely in Dundee in 1915...
- Phylogenetic comparative methodsPhylogenetic comparative methodsPhylogenetic comparative methods use information on the evolutionary relationships of organisms to compare species...
- Allometric engineeringAllometric engineeringAllometric engineering is the process of experimentally shifting the scaling relationships of a population. More specifically, the process of experimentally breaking the tight covariance evident among component traits of a complex phenotype by altering the variance of one trait relative to another....
- Statistical shape analysisStatistical shape analysisStatistical shape analysis is a geometrical analysis from a set of shapes in which statistics are measured to describe geometrical properties from similar shapes or different groups, for instance, the difference between male and female Gorilla skull shapes, normal and pathological bone shapes, etc...
- Voxel-based morphometry
- Brain morphometryBrain morphometryBrain morphometry is a subfield of both morphometry and the brain sciences, concerned with the measurement of brain structures and changes thereof during development, aging, learning, disease and evolution...
Software
- PAST
- SHAPE – Elliptic Fourier Descriptors
- Morphometric software – Archive of many different types of software for use in morphometrics - especially geometric morphometrics.