

List of countries by traffic-related death rate
Encyclopedia
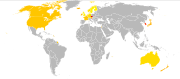
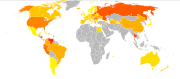
This list of countries by traffic-related death rate shows the annual number of road fatalities per capita per year and per vehicle-km in some countries in the year the data was collected.
According to the World Health Organization
, road traffic injuries caused an estimated 1.26 million deaths worldwide in the year 2000. The average rate was 20.8 per 100,000 people, 30.8 for males, 11.0 for females. 90% occurred in low and middle income countries, with South-East Asia and Africa having the highest rates.
According to the World Health Organization
World Health Organization
The World Health Organization is a specialized agency of the United Nations that acts as a coordinating authority on international public health. Established on 7 April 1948, with headquarters in Geneva, Switzerland, the agency inherited the mandate and resources of its predecessor, the Health...
, road traffic injuries caused an estimated 1.26 million deaths worldwide in the year 2000. The average rate was 20.8 per 100,000 people, 30.8 for males, 11.0 for females. 90% occurred in low and middle income countries, with South-East Asia and Africa having the highest rates.
| Country | Road fatalities per 100,000 inhabitants per year |
Road fatalities per 100,000 motor vehicles |
Road fatalities per 1 billion vehicle-km |
Total fatalities latest year | Source |
|---|---|---|---|---|---|
| 20.8 | 2000 | ||||
 Afghanistan Afghanistan |
39.0 | ||||
 Albania Albania |
13.9 | ||||
 Angola Angola |
37.7 | ||||
 Argentina Argentina |
13.7 | ||||
 Armenia Armenia |
13.9 | ||||
 Australia Australia |
5.2 | 8 | 6 | 379 | |
 Austria Austria |
8.2 | 12 | 8.9 | ||
 Azerbaijan Azerbaijan |
13.0 | ||||
 The Bahamas The Bahamas |
14.5 | 8.9 | |||
 Bahrain Bahrain |
12.1 | ||||
 Bangladesh Bangladesh |
12.6 | ||||
 Barbados Barbados |
12.2 | ||||
 Belarus Belarus |
15.7 | ||||
| 10.1 | 17 | 10.8 | |||
 Belize Belize |
15.6 | ||||
 Benin Benin |
31.2 | ||||
 Bhutan Bhutan |
14.4 | ||||
 Bolivia Bolivia |
16.7 | ||||
 Bosnia and Herzegovina Bosnia and Herzegovina |
10.9 | ||||
 Botswana Botswana |
33.8 | ||||
 Brazil Brazil |
19.9 | 70.9 | 55.9 | 37,694 | |
 British Virgin Islands British Virgin Islands |
21.7 | ||||
 Brunei Brunei |
13.8 | ||||
 Kingdom of Bulgaria Kingdom of Bulgaria |
13.5 | 48.4 | 32.8 | ||
 Burkina Faso Burkina Faso |
31.1 | ||||
 Burundi Burundi |
23.4 | ||||
 Cambodia Cambodia |
12.1 | ||||
 Cameroon Cameroon |
28.1 | ||||
 Canada Canada |
9.2 | 13 | 8.2 | ||
 Cape Verde Cape Verde |
25.1 | ||||
 Central African Republic Central African Republic |
32.2 | ||||
 Chad Chad |
34.3 | ||||
 Chile Chile |
13.7 | ||||
 Mainland China Mainland China |
16.5 | ||||
 Colombia Colombia |
11.7 | ||||
 Comoros Comoros |
30.3 | ||||
 Republic of the Congo Republic of the Congo |
28.8 | ||||
 Cook Islands Cook Islands |
45.0 | ||||
 Costa Rica Costa Rica |
15.4 | ||||
 Independent State of Croatia Independent State of Croatia |
13.6 | ||||
 Cuba Cuba |
8.6 | ||||
 Cyprus Cyprus |
10.4 | 23.6 | 16.7 | ||
 Czech Republic Czech Republic |
10.4 | 20 | 19.5 | ||
 Democratic Republic of the Congo Democratic Republic of the Congo |
32.2 | ||||
 Denmark Denmark |
7.4 | 14 | 8.2 | ||
 Dominican Republic Dominican Republic |
17.3 | ||||
 Ecuador Ecuador |
11.7 | ||||
 Egypt Egypt |
8.1 | 6,486 | 2009 | ||
 El Salvador El Salvador |
12.6 | ||||
 Eritrea Eritrea |
48.4 | ||||
 Estonia Estonia |
15.2 | 38.9 | 17.5 | ||
 Ethiopia Ethiopia |
35.0 | ||||
 Fiji Fiji |
7.0 | ||||
 Finland Finland |
6.5 | 11 | 7.0 | ||
 Early Modern France Early Modern France |
6.9 | 12 | 7.7 | ||
 The Gambia The Gambia |
36.6 | ||||
 Georgia (country) Georgia (country) |
16.8 | ||||
 Germany Germany |
4.5 | 7.2 | 7.2(2009) | 3,657 | 2010 official figures |
 Ghana Ghana |
29.6 | ||||
 Greece Greece |
14.4 | 21 | 17.4 | ||
 Guatemala Guatemala |
14.7 | ||||
 Guinea-Bissau Guinea-Bissau |
34.4 | ||||
 Guyana Guyana |
19.9 | ||||
 Honduras Honduras |
13.5 | ||||
 Hungary Hungary |
9.9 | 27 | 27.1 | ||
 Iceland Iceland |
3.8 | 5 | 3.9 | ||
 India India |
16.8 | ||||
 Indonesia Indonesia |
16.2 | ||||
 Iran Iran |
35.8 | ||||
 Iraq Iraq |
38.1 | ||||
 Republic of Ireland Republic of Ireland |
4.7 | 10 | 4.9 | 212* (Prelim. Estimate for 2010) | |
 Israel Israel |
5.7 | 18 | 8.5 | 370 | 2009 official |
 Italy Italy |
8.7 | 12 | |||
 Jamaica Jamaica |
12.3 | ||||
 Japan Japan |
3.85 | 6.8 | 4,914 | 2009 official figures | |
 Jordan Jordan |
34.2 | ||||
 Kazakhstan Kazakhstan |
30.6 | ||||
 Kenya Kenya |
34.4 | ||||
 Kiribati Kiribati |
7.4 | ||||
 South Korea South Korea |
12.7 | 29 | 19.3 | ||
 Kuwait Kuwait |
16.9 | ||||
 Kyrgyzstan Kyrgyzstan |
22.8 | ||||
 Laos Laos |
18.3 | ||||
 Latvia Latvia |
17.9 | 52 | 25.6 | ||
 Lebanon Lebanon |
28.5 | ||||
 Lesotho Lesotho |
26.7 | ||||
 Liberia Liberia |
32.9 | ||||
 Libya Libya |
40.5 | ||||
 Lithuania Lithuania |
14.8 | 49.8 | 19.1 | ||
 Luxembourg Luxembourg |
9.0 | 8 | 5.4 | ||
 Madagascar Madagascar |
33.7 | ||||
 Malawi Malawi |
26.0 | ||||
 Malaysia Malaysia |
24.1 | 36.5 | 6,745 | 2009 end/ | |
 Maldives Maldives |
18.3 | ||||
 Mali Mali |
32.1 | ||||
 Malta Malta |
3.4 | 4.6 | 4.9 | ||
 Marshall Islands Marshall Islands |
1.7 | ||||
 Mauritania Mauritania |
35.5 | ||||
 Mauritius Mauritius |
11.1 | ||||
 Mexico Mexico |
20.7 | ||||
 Federated States of Micronesia Federated States of Micronesia |
14.4 | ||||
 Mongolia Mongolia |
19.3 | 280 | 5,278 | 2003 | |
 Kingdom of Montenegro Kingdom of Montenegro |
14.6 | 44.5 | 95 | 2010 | |
 Morocco Morocco |
28.3 | ||||
 Mozambique Mozambique |
34.7 | ||||
 Myanmar Myanmar |
23.4 | ||||
 Namibia Namibia |
28.6 | ||||
 Nauru Nauru |
9.9 | ||||
 Nepal Nepal |
15.1 | ||||
 Netherlands Netherlands |
4.1 | 7 | 7.7 | 640 | |
 New Zealand New Zealand |
8.6 | 11 | 9.1 | ||
 Nicaragua Nicaragua |
14.2 | ||||
 Niger Niger |
37.7 | ||||
 Nigeria Nigeria |
32.3 | ||||
 Norway Norway |
5.4 | 8 | 6.1 | ||
 Oman Oman |
21.3 | ||||
 Pakistan Pakistan |
25.3 | ||||
 Palau Palau |
14.8 | ||||
 Palestinian territories Palestinian territories |
4.9 | ||||
 Panama Panama |
12.7 | ||||
 Papua New Guinea Papua New Guinea |
14.2 | ||||
 Paraguay Paraguay |
19.7 | ||||
 Peru Peru |
21.5 | ||||
 Philippines Philippines |
20.0 | ||||
 Poland Poland |
14.7 | 28 | 23.5 | ||
 Portugal Portugal |
11.8 | 18 | 13.1 | ||
 Puerto Rico Puerto Rico |
12.8 | ||||
| 23.7 | 12 | ||||
 Republic of Macedonia Republic of Macedonia |
6.9 | ||||
 Moldova Moldova |
15.1 | ||||
 Kingdom of Romania Kingdom of Romania |
12.7 | 71.1 | 39.8 | ||
 Russia Russia |
25.2 | ||||
 Rwanda Rwanda |
31.6 | ||||
 Saint Lucia Saint Lucia |
17.6 | ||||
 Saint Vincent and the Grenadines Saint Vincent and the Grenadines |
6.6 | ||||
 Samoa Samoa |
12.8 | ||||
 San Marino San Marino |
3.2 | ||||
 São Tomé and Príncipe São Tomé and Príncipe |
33.0 | ||||
 Saudi Arabia Saudi Arabia |
29.0 | ||||
 Senegal Senegal |
32.5 | ||||
 Serbia Serbia |
9.8 | ||||
 Seychelles Seychelles |
18.5 | ||||
 Sierra Leone Sierra Leone |
28.3 | ||||
 Singapore Singapore |
4.8 | ||||
 Slovakia Slovakia |
15.1 | 43.9 | 21.5 | ||
 Slovenia Slovenia |
10.4 | 17 | 17.2 | ||
 Solomon Islands Solomon Islands |
16.9 | ||||
 South Africa South Africa |
33.2 | ||||
 Spain Spain |
6.9 | 10 | 11.7 | ||
 Sri Lanka Sri Lanka |
13.5 | ||||
 Sudan Sudan |
34.7 | ||||
 Suriname Suriname |
18.3 | ||||
 Swaziland Swaziland |
26.3 | ||||
 Sweden Sweden |
2.9 | 7 | 5.1 | 270 | (2008) (Preliminary results for 2010) |
 Switzerland Switzerland |
4.7 | 7 | 5.6 | ||
| 32.9 | |||||
 Tajikistan Tajikistan |
14.1 | ||||
 Thailand Thailand |
19.6 | ||||
 East Timor East Timor |
16.1 | ||||
 Togo Togo |
28.1 | ||||
 Tonga Tonga |
7.0 | ||||
 Trinidad and Tobago Trinidad and Tobago |
15.5 | ||||
 Tunisia Tunisia |
34.5 | ||||
 Turkey Turkey |
13.4 | ||||
 Turkmenistan Turkmenistan |
18.6 | ||||
 Tuvalu Tuvalu |
9.5 | ||||
 Uganda Uganda |
24.7 | v | |||
 Ukraine Ukraine |
21.5 | v | |||
 United Arab Emirates United Arab Emirates |
37.1 | 310 | |||
 United Kingdom United Kingdom |
3.59 | 7 | 5.7 | 2,222 | 2009 Dft results (per capita) else |
| 34.3 | |||||
| 12.3 | 15 | 8.5 | 33,808 | ||
 Uruguay Uruguay |
12.8 | ||||
 Uzbekistan Uzbekistan |
9.7 | ||||
 Vanuatu Vanuatu |
18.6 | ||||
 Venezuela Venezuela |
21.8 | ||||
 Vietnam Vietnam |
16.1 | ||||
 Yemen Yemen |
29.3 | ||||
 Zambia Zambia |
25.6 | ||||
 Zimbabwe Zimbabwe |
27.5 |
See also
- Epidemiology of motor vehicle collisions
- Traffic collision
- List of causes of death by rate
- Road-traffic safetyRoad-traffic safetyThe term road traffic safety is about the risk of a person being killed or seriously injured while using the road network as a pedestrian, cyclist, motorist or user of on road public transport...
- Management systems for road safetyManagement systems for road safety-Paradigms:Progress in the area of prevention is formulated in an environment of beliefs, called paradigms as can be seen in the next table. Some of them can be refereed as professional folklore, i.e. a widely supported set of beliefs with no real basis...
- Smeed's lawSmeed's lawSmeed's Law, named after R. J. Smeed, who first proposed the relationship in 1949, is an empirical rule relating traffic fatalities to traffic congestion as measured by the proxy of motor vehicle registrations and country population. Thus, increasing traffic volume leads to an increase in...
- List of motor vehicle deaths in Australia by year
- List of motor vehicle deaths in Japan by year
- List of motor vehicle deaths in U.S. by year