

Demographics of Belarus
Encyclopedia
Demographics
Demographics are the most recent statistical characteristics of a population. These types of data are used widely in sociology , public policy, and marketing. Commonly examined demographics include gender, race, age, disabilities, mobility, home ownership, employment status, and even location...
features of the population
Population
A population is all the organisms that both belong to the same group or species and live in the same geographical area. The area that is used to define a sexual population is such that inter-breeding is possible between any pair within the area and more probable than cross-breeding with individuals...
of Belarus
Belarus
Belarus , officially the Republic of Belarus, is a landlocked country in Eastern Europe, bordered clockwise by Russia to the northeast, Ukraine to the south, Poland to the west, and Lithuania and Latvia to the northwest. Its capital is Minsk; other major cities include Brest, Grodno , Gomel ,...
, including population growth, population density
Population density
Population density is a measurement of population per unit area or unit volume. It is frequently applied to living organisms, and particularly to humans...
, ethnicity
Ethnic group
An ethnic group is a group of people whose members identify with each other, through a common heritage, often consisting of a common language, a common culture and/or an ideology that stresses common ancestry or endogamy...
, education level, health, economic status, religious affiliations, and other aspects of the population. The ethnic majority in Belarus call themselves Belarusians
Belarusians
Belarusians ; are an East Slavic ethnic group who populate the majority of the Republic of Belarus. Introduced to the world as a new state in the early 1990s, the Republic of Belarus brought with it the notion of a re-emerging Belarusian ethnicity, drawn upon the lines of the Old Belarusian...
.
Demographic trends
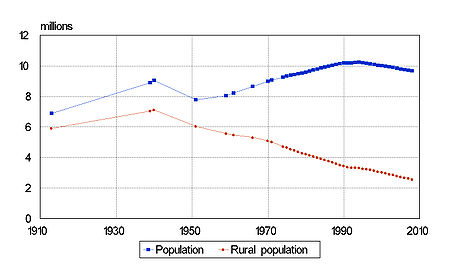
The population of Belarus suffered a dramatic decline during World War II, dropping from more than 9 million in 1940 to 7.7 million in 1951. It then resumed its long-term growth, rising to 10 million in 1999. After that the population began a steady decline, dropping to 9.7 million in 2006-2007. Originally a highly agrarian country with nearly 80% of its population in rural areas, Belarus has been undergoing a process of continuous urbanization. The share of its rural population decreased from 70% in 1959 to less than 30% in the 2000s.| width="32%"|
| width="2%"|
| width="32%"|
| width="2%"|
| width="32%"|
|-
|1970 - 1989
|
|1970 - 2010
|
|1999 - 2010
|}>
Ethnic groups
- BelarusiansBelarusiansBelarusians ; are an East Slavic ethnic group who populate the majority of the Republic of Belarus. Introduced to the world as a new state in the early 1990s, the Republic of Belarus brought with it the notion of a re-emerging Belarusian ethnicity, drawn upon the lines of the Old Belarusian...
81.2%, RussiansRussiansThe Russian people are an East Slavic ethnic group native to Russia, speaking the Russian language and primarily living in Russia and neighboring countries....
11.4%, PolesPolesthumb|right|180px|The state flag of [[Poland]] as used by Polish government and diplomatic authoritiesThe Polish people, or Poles , are a nation indigenous to Poland. They are united by the Polish language, which belongs to the historical Lechitic subgroup of West Slavic languages of Central Europe...
3.9%, UkrainiansUkrainiansUkrainians are an East Slavic ethnic group native to Ukraine, which is the sixth-largest nation in Europe. The Constitution of Ukraine applies the term 'Ukrainians' to all its citizens...
2.4%, JewsHistory of the Jews in BelarusThe Jews in Belarus were the third largest ethnic group in the country in the first half of the 20th century. Before World War II, Jews were the third among the ethnic groups in Belarus, and in cities and towns comprised more than 40% of the population. The population of cities such as Minsk,...
0.3%, ArmeniansArmeniansArmenian people or Armenians are a nation and ethnic group native to the Armenian Highland.The largest concentration is in Armenia having a nearly-homogeneous population with 97.9% or 3,145,354 being ethnic Armenian....
0.1%, Lipka TatarsLipka TatarsThe Lipka Tatars are a group of Tatars who originally settled in the Grand Duchy of Lithuania at the beginning of 14th century. The first settlers tried to preserve their shamanistic religion and sought asylum amongst the non-Christian Lithuanians...
0.1%, Ruska RomaRuska RomaThe Ruska Roma , also known as Russian Gypsies , are a subgroup of Romani people, the biggest Romani group of Russia. Initially were known as Xaladitka Roma...
0.1%, LithuaniansLithuaniansLithuanians are the Baltic ethnic group native to Lithuania, where they number around 2,765,600 people. Another million or more make up the Lithuanian diaspora, largely found in countries such as the United States, Brazil, Canada, Colombia, Russia, United Kingdom and Ireland. Their native language...
0.1%, Azeris 0.1%, others 0.3% (1999 census).
Prior to WW II
Prior to World War IIWorld War II
World War II, or the Second World War , was a global conflict lasting from 1939 to 1945, involving most of the world's nations—including all of the great powers—eventually forming two opposing military alliances: the Allies and the Axis...
, Jews
Jews
The Jews , also known as the Jewish people, are a nation and ethnoreligious group originating in the Israelites or Hebrews of the Ancient Near East. The Jewish ethnicity, nationality, and religion are strongly interrelated, as Judaism is the traditional faith of the Jewish nation...
were the second largest ethnic group in Belarus, and at 400,000 in the 1926 and 1939 censuses they even exceeded the number of Russians (although admittedly by a small margin). Jews accounted for 7%-8% of the total population at that time, comprising more than 40% of the population in cities and towns, where Jews and Poles were the majority, while Belarusians mostly lived in rural areas.
The Poles were the fourth largest ethnic group before World War II, comprising 1%-2% of the population in the pre-war censuses (less than 100,000).
| Ethnic group |
census 19261 | census 19392 | ||
|---|---|---|---|---|
| Number | % | Number | % | |
| Belarusians Belarusians Belarusians ; are an East Slavic ethnic group who populate the majority of the Republic of Belarus. Introduced to the world as a new state in the early 1990s, the Republic of Belarus brought with it the notion of a re-emerging Belarusian ethnicity, drawn upon the lines of the Old Belarusian... |
4,017,301 | 80.6 | 4,615,496 | 82.9 |
| Jews Jews The Jews , also known as the Jewish people, are a nation and ethnoreligious group originating in the Israelites or Hebrews of the Ancient Near East. The Jewish ethnicity, nationality, and religion are strongly interrelated, as Judaism is the traditional faith of the Jewish nation... |
407,059 | 8.2 | 375,092 | 6.7 |
| Russians Russians The Russian people are an East Slavic ethnic group native to Russia, speaking the Russian language and primarily living in Russia and neighboring countries.... |
383,806 | 7.7 | 364,705 | 6.6 |
| Ukrainians Ukrainians Ukrainians are an East Slavic ethnic group native to Ukraine, which is the sixth-largest nation in Europe. The Constitution of Ukraine applies the term 'Ukrainians' to all its citizens... |
34,681 | 0.7 | 104,247 | 1.9 |
| Poles Poles thumb|right|180px|The state flag of [[Poland]] as used by Polish government and diplomatic authoritiesThe Polish people, or Poles , are a nation indigenous to Poland. They are united by the Polish language, which belongs to the historical Lechitic subgroup of West Slavic languages of Central Europe... |
97,498 | 2.0 | 58,380 | 1.1 |
| Germans Germans The Germans are a Germanic ethnic group native to Central Europe. The English term Germans has referred to the German-speaking population of the Holy Roman Empire since the Late Middle Ages.... |
7,075 | 0.1 | 8,448 | 0.2 |
| Latvians Latvians Latvians or Letts are the indigenous Baltic people of Latvia.-History:Latvians occasionally refer to themselves by the ancient name of Latvji, which may have originated from the word Latve which is a name of the river that presumably flowed through what is now eastern Latvia... |
14,080 | 0.3 | 8,117 | 0.2 |
| Tatars Tatars Tatars are a Turkic speaking ethnic group , numbering roughly 7 million.The majority of Tatars live in the Russian Federation, with a population of around 5.5 million, about 2 million of which in the republic of Tatarstan.Significant minority populations are found in Uzbekistan, Kazakhstan,... |
3,777 | 0.1 | 7,664 | 0.1 |
| Lithuanians Lithuanians Lithuanians are the Baltic ethnic group native to Lithuania, where they number around 2,765,600 people. Another million or more make up the Lithuanian diaspora, largely found in countries such as the United States, Brazil, Canada, Colombia, Russia, United Kingdom and Ireland. Their native language... |
6,864 | 0.1 | 4,284 | 0.1 |
| Roma Ruska Roma The Ruska Roma , also known as Russian Gypsies , are a subgroup of Romani people, the biggest Romani group of Russia. Initially were known as Xaladitka Roma... |
2,366 | 0.1 | 3,632 | 0.1 |
| Mordvins | 1,051 | 0.0 | 2,042 | 0.0 |
| Others | 7,682 | 0.2 | 16,887 | 0.3 |
| Total | 4,983,240 | 5,568,994 | ||
| 1 Source: http://demoscope.ru/weekly/ssp/ussr_nac_26.php. 2 Source: http://demoscope.ru/weekly/ssp/ussr_nac_39.php. | ||||
After WW II
The Holocaust decimated the Jewish population in Belarus, and after World War II, in 1959, Jews accounted for only 1.9% of the population. Since then, Jewish emigration to IsraelIsrael
The State of Israel is a parliamentary republic located in the Middle East, along the eastern shore of the Mediterranean Sea...
and other countries reduced the number of Jews to 0.1% of the population (13,000 in 2009).
After the war, a large number of Poles (including Catholic Belarusians) were forced to move to Poland
Poland
Poland , officially the Republic of Poland , is a country in Central Europe bordered by Germany to the west; the Czech Republic and Slovakia to the south; Ukraine, Belarus and Lithuania to the east; and the Baltic Sea and Kaliningrad Oblast, a Russian exclave, to the north...
. In exchange, Belarusians from the former Belastok Voblast
Belastok Voblast
Belastok Voblast or Belostok Oblast was a territorial unit in the Belarusian Soviet Socialist Republic from September 1939 to August 1945.- Administrative units :The administrative center of the voblast was the city of Belastok ....
, which was returned to Poland in 1945, after being occupied in 1939 were displaced to Belarus. Due to changes in the western border of Belarus and Poland after World War II (see territorial changes of Poland
Territorial changes of Poland
Poland is a country in Central Europe bordered by Germany to the west; the Czech Republic and Slovakia to the south; Ukraine, Belarus and Lithuania to the east; and the Baltic Sea and Kaliningrad Oblast, a Russian exclave, to the north...
), the number of Poles in Belarus increased to more than 500,000 according to the first post-war census (1959) and to about 400,000 according to the 1999 census. Poles are now the third largest ethnic group in Belarus (see Polish minority in Belarus
Polish minority in Belarus
The Polish minority in Belarus numbers officially about 294,549 according to 2009 census. It forms the second largest ethnic minority in the country after the Russians, at 3,1% of the total population. An estimated 180,905 Polish Belarusians live in large agglomerations and 113,644 in smaller...
). There is around 15,000 of Lipka Tatars
Lipka Tatars
The Lipka Tatars are a group of Tatars who originally settled in the Grand Duchy of Lithuania at the beginning of 14th century. The first settlers tried to preserve their shamanistic religion and sought asylum amongst the non-Christian Lithuanians...
. Armenians
Armenians
Armenian people or Armenians are a nation and ethnic group native to the Armenian Highland.The largest concentration is in Armenia having a nearly-homogeneous population with 97.9% or 3,145,354 being ethnic Armenian....
and Ruska Roma
Ruska Roma
The Ruska Roma , also known as Russian Gypsies , are a subgroup of Romani people, the biggest Romani group of Russia. Initially were known as Xaladitka Roma...
(Russian Gypsies) account for about 10,000 each.
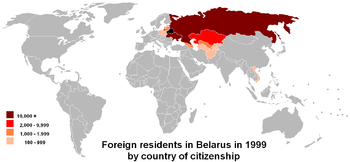
In the post-war period Belarus experienced an influx of workers from other parts of the Soviet Union, for example Russians and Ukrainians. The decade after independence saw a decline in the population of most of these minority groups, either by assimilation or emigration. The most significant exception to this trend has been a continued (if small-scale) net immigration of Armenians
Armenians
Armenian people or Armenians are a nation and ethnic group native to the Armenian Highland.The largest concentration is in Armenia having a nearly-homogeneous population with 97.9% or 3,145,354 being ethnic Armenian....
and Azeris, whose numbers increased from less than 2,000 in 1959 to around 10,000 in 1999.
| width="23%"|
| width="2%"|
| width="23%"|
| width="2%"|
| width="23%"|
| width="2%"|
| width="23%"|
|-
|Belarusian
|
|Russians
|
|Poles
|
|Ukrainians
|}>
| Ethnic group |
census 19591 | census 19702 | census 19793 | census 19894 | census 19995 | census 20096 | ||||||
|---|---|---|---|---|---|---|---|---|---|---|---|---|
| Number | % | Number | % | Number | % | Number | % | Number | % | Number | % | |
| Belarusians Belarusians Belarusians ; are an East Slavic ethnic group who populate the majority of the Republic of Belarus. Introduced to the world as a new state in the early 1990s, the Republic of Belarus brought with it the notion of a re-emerging Belarusian ethnicity, drawn upon the lines of the Old Belarusian... |
6,532,035 | 81.1 | 7,289,610 | 81.0 | 7,567,955 | 79.4 | 7,904,623 | 77.9 | 8,158,900 | 81.2 | 7,957,252 | 83.7 |
| Russians Russians The Russian people are an East Slavic ethnic group native to Russia, speaking the Russian language and primarily living in Russia and neighboring countries.... |
659,093 | 8.2 | 938,161 | 10.4 | 1,134,117 | 11.9 | 1,342,099 | 13.2 | 1,141,700 | 11.4 | 785,084 | 8.3 |
| Poles Poles thumb|right|180px|The state flag of [[Poland]] as used by Polish government and diplomatic authoritiesThe Polish people, or Poles , are a nation indigenous to Poland. They are united by the Polish language, which belongs to the historical Lechitic subgroup of West Slavic languages of Central Europe... |
538,881 | 6.7 | 382,600 | 4.3 | 403,169 | 4.2 | 417,720 | 4.1 | 395,700 | 3.9 | 294,549 | 3.1 |
| Ukrainians Ukrainians Ukrainians are an East Slavic ethnic group native to Ukraine, which is the sixth-largest nation in Europe. The Constitution of Ukraine applies the term 'Ukrainians' to all its citizens... |
133,061 | 1.7 | 190,839 | 2.1 | 230,985 | 2.4 | 291,008 | 2.9 | 237,000 | 2.4 | 158,723 | 1.7 |
| Jews Jews The Jews , also known as the Jewish people, are a nation and ethnoreligious group originating in the Israelites or Hebrews of the Ancient Near East. The Jewish ethnicity, nationality, and religion are strongly interrelated, as Judaism is the traditional faith of the Jewish nation... |
150,084 | 1.9 | 148,011 | 1.6 | 135,450 | 1.4 | 111,975 | 1.1 | 27,800 | 0.3 | 12,926 | 0.1 |
| Armenians Armenians Armenian people or Armenians are a nation and ethnic group native to the Armenian Highland.The largest concentration is in Armenia having a nearly-homogeneous population with 97.9% or 3,145,354 being ethnic Armenian.... |
1,751 | 0.0 | 2,362 | 0.0 | 2,751 | 0.0 | 4,933 | 0.1 | 10,200 | 0.1 | 8,512 | 0.1 |
| Tatars Tatars Tatars are a Turkic speaking ethnic group , numbering roughly 7 million.The majority of Tatars live in the Russian Federation, with a population of around 5.5 million, about 2 million of which in the republic of Tatarstan.Significant minority populations are found in Uzbekistan, Kazakhstan,... |
8,650 | 0.1 | 9,992 | 0.1 | 10,851 | 0.1 | 12,436 | 0.1 | 10,100 | 0.1 | 7,316 | 0.1 |
| Romani | 4,662 | 0.1 | 6,843 | 0.1 | 8,408 | 0.1 | 10,762 | 0.1 | 9,900 | 0.1 | 7,316 | 0.1 |
| Azeri | 1,402 | 0.0 | 1,335 | 0.0 | 2,654 | 0.0 | 5,009 | 0.1 | 6,300 | 0.1 | 5,567 | 0.1 |
| Lithuanians Lithuanians Lithuanians are the Baltic ethnic group native to Lithuania, where they number around 2,765,600 people. Another million or more make up the Lithuanian diaspora, largely found in countries such as the United States, Brazil, Canada, Colombia, Russia, United Kingdom and Ireland. Their native language... |
8,363 | 0.1 | 8,092 | 0.1 | 6,993 | 0.1 | 7,606 | 0.1 | 6,400 | 0.1 | 5,087 | 0.1 |
| Others | 16,666 | 0.2 | 24,493 | 0.3 | 29,183 | 0.3 | 43,635 | 0.4 | 41,200 | 0.4 | 261,712 | 2.8 |
| Total | 8,054,648 | 9,002,338 | 9,532,516 | 10,151,806 | 10,045,200 | 9,503,807 | ||||||
| 1 Source: http://demoscope.ru/weekly/ssp/sng_nac_59.php. 2 Source: http://demoscope.ru/weekly/ssp/sng_nac_70.php. 3 Source: http://demoscope.ru/weekly/ssp/sng_nac_79.php. 4 Source: http://demoscope.ru/weekly/ssp/sng_nac_89.php. 5 Source: http://belstat.gov.by/homep/en/census/main1.php. 6 Source: http://belstat.gov.by/homep/en/census/2009/main.php. | ||||||||||||
Vital statistics since 1950
| Average population (x 1000) | Live births | Deaths | Natural change | Crude birth rate (per 1000) | Crude death rate (per 1000) | Natural change (per 1000) | |
|---|---|---|---|---|---|---|---|
| 1950 (e) | 7 745 | 197 500 | 62 000 | 135 500 | 25.5 | 8.0 | 17.5 |
| 1951 (e) | 7 765 | 194 900 | 62 900 | 132 000 | 25.1 | 8.1 | 17.0 |
| 1952 (e) | 7 721 | 195 300 | 61 800 | 133 500 | 25.3 | 8.0 | 17.3 |
| 1953 (e) | 7 690 | 195 300 | 60 800 | 134 500 | 25.4 | 7.9 | 17.5 |
| 1954 (e) | 7 722 | 195 400 | 61 000 | 134 400 | 25.3 | 7.9 | 17.4 |
| 1955 (e) | 7 804 | 194 300 | 57 700 | 136 600 | 24.9 | 7.4 | 17.5 |
| 1956 (e) | 7 880 | 199 400 | 54 400 | 145 000 | 25.3 | 6.9 | 18.4 |
| 1957 (e) | 7 936 | 200 800 | 56 300 | 144 500 | 25.3 | 7.1 | 18.2 |
| 1958 (e) | 8 009 | 207 400 | 52 100 | 155 300 | 25.9 | 6.5 | 19.4 |
| 1959 (e) | 8 112 | 204 400 | 56 000 | 148 400 | 25.2 | 6.9 | 18.3 |
| 1960 | 8 190 | 200 218 | 54 037 | 146 181 | 24.4 | 6.6 | 17.8 |
| 1961 | 8 284 | 194 239 | 53 682 | 140 557 | 23.4 | 6.5 | 17.0 |
| 1962 | 8 385 | 185 302 | 60 676 | 124 626 | 22.1 | 7.2 | 14.9 |
| 1963 | 8 458 | 173 889 | 58 291 | 115 598 | 20.6 | 6.9 | 13.7 |
| 1964 | 8 519 | 161 794 | 53 967 | 107 827 | 19.0 | 6.3 | 12.7 |
| 1965 | 8 607 | 153 865 | 58 156 | 95 709 | 17.9 | 6.8 | 11.1 |
| 1966 | 8 709 | 153 414 | 58 265 | 95 149 | 17.6 | 6.7 | 10.9 |
| 1967 | 8 800 | 147 501 | 61 263 | 86 238 | 16.8 | 7.0 | 9.8 |
| 1968 | 8 877 | 146 095 | 62 354 | 83 741 | 16.5 | 7.0 | 9.4 |
| 1969 | 8 957 | 142 652 | 65 912 | 76 740 | 15.9 | 7.4 | 8.6 |
| 1970 | 9 038 | 146 676 | 68 974 | 77 702 | 16.2 | 7.6 | 8.6 |
| 1971 | 9 112 | 149 135 | 68 511 | 80 624 | 16.4 | 7.5 | 8.8 |
| 1972 | 9 178 | 147 813 | 71 866 | 75 947 | 16.1 | 7.8 | 8.3 |
| 1973 | 9 245 | 144 729 | 73 927 | 70 802 | 15.7 | 8.0 | 7.7 |
| 1974 | 9 312 | 146 876 | 73 181 | 73 695 | 15.8 | 7.9 | 7.9 |
| 1975 | 9 367 | 146 517 | 79 701 | 66 816 | 15.6 | 8.5 | 7.1 |
| 1976 | 9 411 | 147 912 | 82 400 | 65 512 | 15.7 | 8.8 | 7.0 |
| 1977 | 9 463 | 148 963 | 84 565 | 64 398 | 15.7 | 8.9 | 6.8 |
| 1978 | 9 525 | 151 053 | 86 612 | 64 441 | 15.9 | 9.1 | 6.8 |
| 1979 | 9 590 | 151 800 | 90 837 | 60 963 | 15.8 | 9.5 | 6.4 |
| 1980 | 9 658 | 154 432 | 95 514 | 58 918 | 16.0 | 9.9 | 6.1 |
| 1981 | 9 732 | 157 899 | 93 136 | 64 763 | 16.2 | 9.6 | 6.7 |
| 1982 | 9 804 | 159 364 | 93 840 | 65 524 | 16.3 | 9.6 | 6.7 |
| 1983 | 9 872 | 173 510 | 97 849 | 75 661 | 17.6 | 9.9 | 7.7 |
| 1984 | 9 938 | 168 749 | 104 274 | 64 475 | 17.0 | 10.5 | 6.5 |
| 1985 | 9 999 | 165 034 | 105 690 | 59 344 | 16.5 | 10.6 | 5.9 |
| 1986 | 10 058 | 171 611 | 97 276 | 74 335 | 17.1 | 9.7 | 7.4 |
| 1987 | 10 111 | 162 937 | 99 921 | 63 016 | 16.1 | 9.9 | 6.2 |
| 1988 | 10 144 | 163 193 | 102 671 | 60 522 | 16.1 | 10.1 | 6.0 |
| 1989 | 10 171 | 153 449 | 103 479 | 49 970 | 15.1 | 10.2 | 4.9 |
| 1990 | 10 190 | 142 167 | 109 582 | 32 585 | 14.0 | 10.8 | 3.2 |
| 1991 | 10 194 | 132 045 | 114 650 | 17 395 | 13.0 | 11.2 | 1.7 |
| 1992 | 10 217 | 127 971 | 116 674 | 11 297 | 12.5 | 11.4 | 1.1 |
| 1993 | 10 240 | 117 384 | 128 544 | -11 160 | 11.5 | 12.6 | -1.1 |
| 1994 | 10 227 | 110 599 | 130 003 | -19 404 | 10.8 | 12.7 | -1.9 |
| 1995 | 10 194 | 101 144 | 133 775 | -32 631 | 9.9 | 13.1 | -3.2 |
| 1996 | 10 160 | 95 798 | 133 422 | -37 624 | 9.4 | 13.1 | -3.7 |
| 1997 | 10 118 | 89 586 | 136 653 | -47 067 | 8.9 | 13.5 | -4.7 |
| 1998 | 10 069 | 92 645 | 137 296 | -44 651 | 9.2 | 13.6 | -4.4 |
| 1999 | 10 032 | 92 975 | 142 027 | -49 052 | 9.3 | 14.2 | -4.9 |
| 2000 | 10 005 | 93 691 | 134 867 | -41 176 | 9.4 | 13.5 | -4.1 |
| 2001 | 9 971 | 91 720 | 140 299 | -48 579 | 9.2 | 14.1 | -4.9 |
| 2002 | 9 925 | 88 743 | 146 665 | -57 922 | 8.9 | 14.8 | -5.8 |
| 2003 | 9 874 | 88 512 | 143 200 | -54 688 | 9.0 | 14.5 | -5.5 |
| 2004 | 9 825 | 88 943 | 140 064 | -51 121 | 9.1 | 14.3 | -5.2 |
| 2005 | 9 775 | 90 508 | 141 857 | -51 349 | 9.3 | 14.5 | -5.3 |
| 2006 | 9 732 | 96 721 | 138 426 | -41 705 | 9.9 | 14.2 | -4.3 |
| 2007 | 9 702 | 103 626 | 132 993 | -29 367 | 10.7 | 13.7 | -3.0 |
| 2008 | 9 592 | 107 876 | 133 879 | -26 003 | 11.2 | 14.0 | -2.7 |
| 2009 | 9 487 | 109 813 | 135 056 | -25 243 | 11.6 | 14.2 | -2.7 |
| 2010 | 9 481 | 108 123 | 137 305 | -29 182 | 11.4 | 14.5 | -3.1 |
(e)=estimate
| width="32%"|
| width="2%"|
| width="32%"|
| width="2%"|
| width="32%"|
|-
|Birth rate (per 1000)
|
|Death rate (per 1000)
|
|Natural growth rate (per 1000)
|}>
Languages
BelarusianBelarusian language
The Belarusian language , sometimes referred to as White Russian or White Ruthenian, is the language of the Belarusian people...
and Russian
Russian language
Russian is a Slavic language used primarily in Russia, Belarus, Uzbekistan, Kazakhstan, Tajikistan and Kyrgyzstan. It is an unofficial but widely spoken language in Ukraine, Moldova, Latvia, Turkmenistan and Estonia and, to a lesser extent, the other countries that were once constituent republics...
are the official languages according to the Constitution of Belarus
Constitution of Belarus
The Constitution of the Republic of Belarus is the ultimate law of Belarus. Adopted in 1994, three years after the country declared its independence from the Soviet Union, this formal document establishes the framework of the Belarusian state and government and enumerates the rights and freedoms...
(Article 17). The constitution guarantees preservation of the cultural heritage of all ethnic minorities, including their languages (Article 15). Russian, and not Belarusian, is the dominant language in Belarus, spoken normally at home by 63% of the population (1999 census).
| width="32%"|
| width="2%"|
| width="32%"|
|-
|Native languages
|
|Spoken languages
|}>
CIA World Factbook demographic statistics

Age structure
- 0-14 years: 14.3% (male 707,550/female 667,560)
- 15-64 years: 71.3% (male 3,337,253/female 3,540,916)
- 65 years and over: 14.5% (male 446,746/female 948,508) (2009 est.)
Net migration rate
- 0.38 migrant(s)/1,000 population (2009 est.)
- country comparison to the world: 68
Urbanization
- Urban population: 73% of total population (2008)
- Rate of urbanization: 0% annual rate of change (2005-10 est.)
Sex ratio
- At birth: 1.06 male(s)/female
- Under 15 years: 1.06 male(s)/female
- 15-64 years: 0.94 male(s)/female
- 65 years and over: 0.47 male(s)/female
- Total population: 0.87 male(s)/female (2009 est.)
Infant mortality rate
- Total: 6.43 deaths/1,000 live births
- country comparison to the world: 177
- Male: 7.45 deaths/1,000 live births
- Female: 5.36 deaths/1,000 live births (2009 est.)
Life expectancy at birth
- Total population: 70.63 years
- country comparison to the world: 141
- Male: 64.95 years
- Female: 76.67 years (2009 est.)
Total fertility rate
- 1.24 children born/woman (2009 est.)
- country comparison to the world: 214
HIV/AIDS
- Adult prevalence rate: 0.2% (2007 est.)
- country comparison to the world: 104
- People living with HIV/AIDS: 13,000 (2007 est.)
- country comparison to the world: 91
- Deaths: 1,100 (2007 est.)
- country comparison to the world: 69
Religions
According to 1997 estimates, 80% of the religious population belonged to the Eastern Orthodox ChurchEastern Orthodox Church
The Orthodox Church, officially called the Orthodox Catholic Church and commonly referred to as the Eastern Orthodox Church, is the second largest Christian denomination in the world, with an estimated 300 million adherents mainly in the countries of Belarus, Bulgaria, Cyprus, Georgia, Greece,...
and the others are mainly Roman Catholic, Protestants, Muslims, and Jews
Judaism
Judaism ) is the "religion, philosophy, and way of life" of the Jewish people...
.
Literacy
- Definition: age 15 and over who can read and write
- Total population: 99.6%
- Male: 99.8%
- Female: 99.5% (2003 est.)