Cobweb plot
Encyclopedia


Dynamical system
A dynamical system is a concept in mathematics where a fixed rule describes the time dependence of a point in a geometrical space. Examples include the mathematical models that describe the swinging of a clock pendulum, the flow of water in a pipe, and the number of fish each springtime in a...
s field of mathematics
Mathematics
Mathematics is the study of quantity, space, structure, and change. Mathematicians seek out patterns and formulate new conjectures. Mathematicians resolve the truth or falsity of conjectures by mathematical proofs, which are arguments sufficient to convince other mathematicians of their validity...
to investigate the qualitative behaviour of one dimensional iterated function
Iterated function
In mathematics, an iterated function is a function which is composed with itself, possibly ad infinitum, in a process called iteration. In this process, starting from some initial value, the result of applying a given function is fed again in the function as input, and this process is repeated...
s, such as the logistic map
Logistic map
The logistic map is a polynomial mapping of degree 2, often cited as an archetypal example of how complex, chaotic behaviour can arise from very simple non-linear dynamical equations...
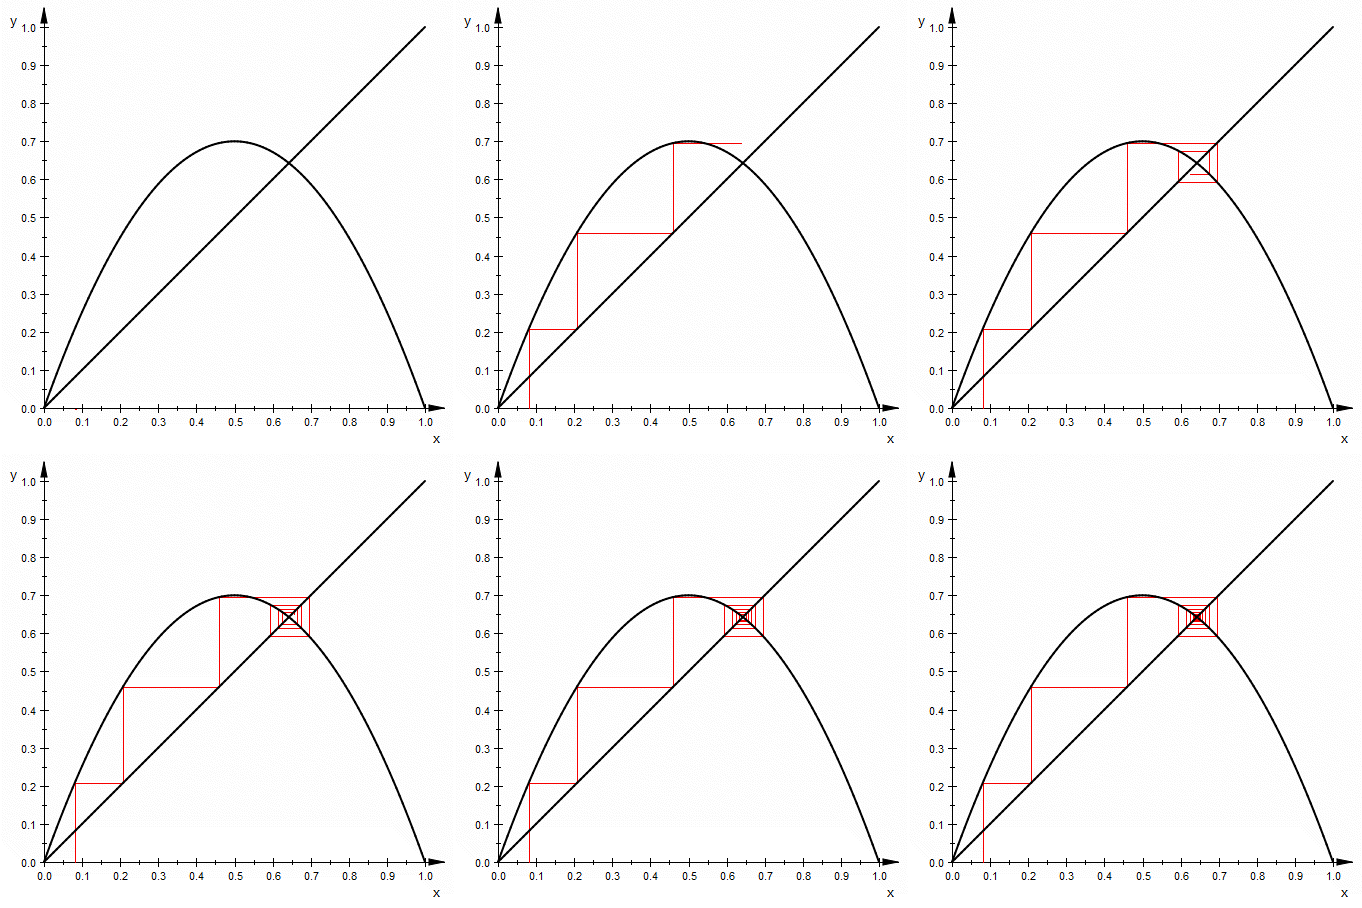
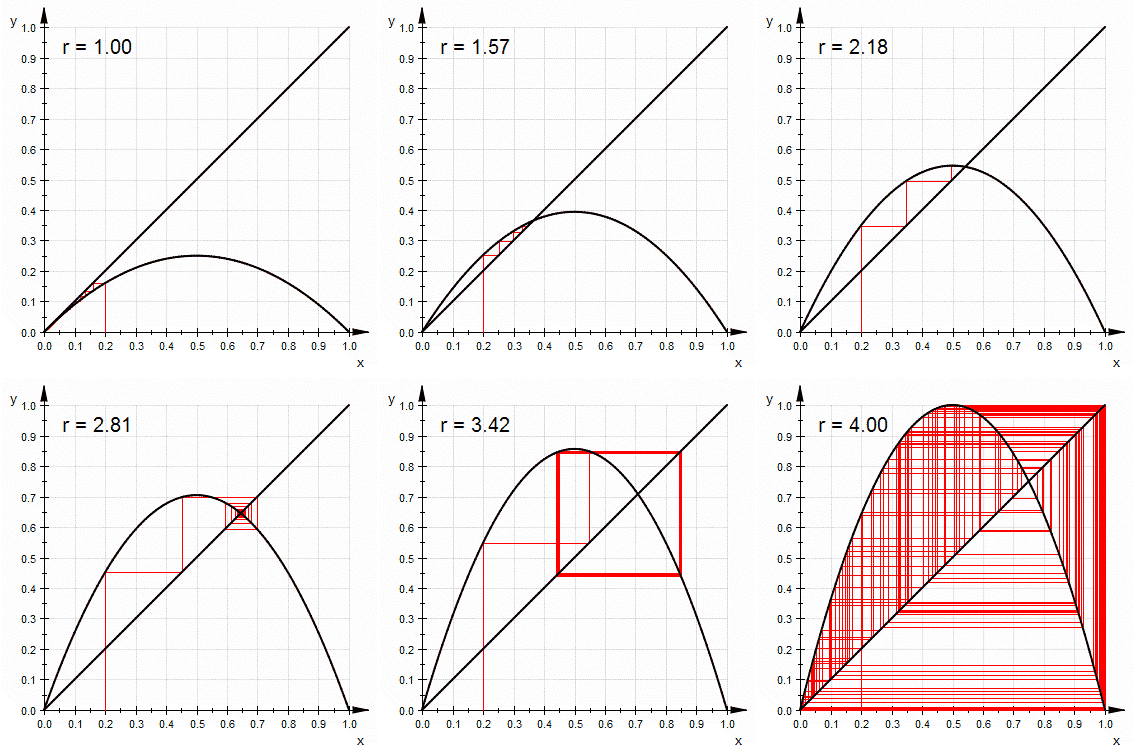
. Using a cobweb plot, it is possible to infer the long term status of an initial condition under repeated application of a map.
Method
For a given iterated function f: R → R, the plot consists of a diagonal (x = y) line and a curve representing y = f(x). To plot the behaviour of a value , apply the following steps.
- Find the point on the function curve with an x-coordinate of
 . This has the coordinates (
 ).
). - Plot horizontally across from this point to the diagonal line. This has the coordinates (
 ).
). - Plot vertically from the point on the diagonal to the function curve. This has the coordinates (
 ).
). - Repeat from step 2 as required.
Interpretation
On the cobweb plot, a stable fixed pointFixed point (mathematics)
In mathematics, a fixed point of a function is a point that is mapped to itself by the function. A set of fixed points is sometimes called a fixed set...
corresponds to an inward spiral, while an unstable fixed point is an outward one. It follows from the definition of a fixed point that these spirals will center at a point where the diagonal y=x line crosses the function graph. A period 2 orbit
Orbit (dynamics)
In mathematics, in the study of dynamical systems, an orbit is a collection of points related by the evolution function of the dynamical system. The orbit is a subset of the phase space and the set of all orbits is a partition of the phase space, that is different orbits do not intersect in the...
is represented by a rectangle, while greater period cycles produce further, more complex closed loops. A chaotic
Chaos theory
Chaos theory is a field of study in mathematics, with applications in several disciplines including physics, economics, biology, and philosophy. Chaos theory studies the behavior of dynamical systems that are highly sensitive to initial conditions, an effect which is popularly referred to as the...
orbit would show a 'filled out' area, indicating an infinite number of non-repeating values.
External links
- Emporia State University - A cobweb plotting appletAppletIn computing, an applet is any small application that performs one specific task that runs within the scope of a larger program, often as a plug-in. An applet typically also refers to Java applets, i.e., programs written in the Java programming language that are included in a web page...

