
Closing milestones of the Dow Jones Industrial Average
Encyclopedia
This article is a summary of the closing milestones of the Dow Jones Industrial Average, a United States stock market index
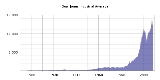
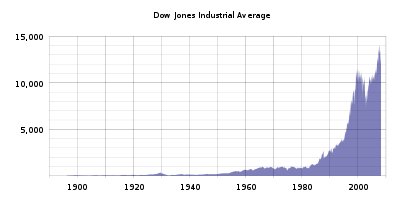
. Since opening at 40.94 on May 26, 1896, the Dow Jones Industrial Average
has increased steadily, despite several periods of decline.
.svg.png) Like most other stock market indices, the Dow undergoes periods of general increase and general declines or stagnation. A bull market is a term denoting a period of price increases, while a bear market denotes a period of declines. Wall Street
Like most other stock market indices, the Dow undergoes periods of general increase and general declines or stagnation. A bull market is a term denoting a period of price increases, while a bear market denotes a period of declines. Wall Street
generally considers a bear market in session when the main stock market index is more than 20 percent below its all-time high.
There are two types of bull markets. A secular bull market is a period in which the stock market index is continually reaching all-time highs with only brief periods of correction, as during the 1990s, and can last upwards of 15 years. A cyclical bull market is a period in which the stock market index is reaching 52-week or multi-year highs and may briefly peak at all-time highs before a rapid decline, as in the early 1970s. It usually occurs within relatively longer bear markets and lasts about three years.
The following are the secular bull and bear markets experienced by the Dow since its inception:
1This was the Dow's close at the peak of the 1929 bull market, a level that the Dow would not see again for 25 years.
2The Dow first exceeded 1000 during the trading day on January 18, 1966, but dropped back before closing that day. It would be nearly 7 years later before it closed above 1000 for the first time.
Stock market index
A stock market index is a method of measuring a section of the stock market. Many indices are cited by news or financial services firms and are used as benchmarks, to measure the performance of portfolios such as mutual funds....
. Since opening at 40.94 on May 26, 1896, the Dow Jones Industrial Average
Dow Jones Industrial Average
The Dow Jones Industrial Average , also called the Industrial Average, the Dow Jones, the Dow 30, or simply the Dow, is a stock market index, and one of several indices created by Wall Street Journal editor and Dow Jones & Company co-founder Charles Dow...
has increased steadily, despite several periods of decline.
Milestone highs and lows
Wall Street
Wall Street refers to the financial district of New York City, named after and centered on the eight-block-long street running from Broadway to South Street on the East River in Lower Manhattan. Over time, the term has become a metonym for the financial markets of the United States as a whole, or...
generally considers a bear market in session when the main stock market index is more than 20 percent below its all-time high.
There are two types of bull markets. A secular bull market is a period in which the stock market index is continually reaching all-time highs with only brief periods of correction, as during the 1990s, and can last upwards of 15 years. A cyclical bull market is a period in which the stock market index is reaching 52-week or multi-year highs and may briefly peak at all-time highs before a rapid decline, as in the early 1970s. It usually occurs within relatively longer bear markets and lasts about three years.
The following are the secular bull and bear markets experienced by the Dow since its inception:
- 1896–1929: Bull market. In the summer of 1896 the Dow sheds 30% to set an all-time low of 28.48, but quickly erases its losses, and eventually grows to a closing high of 381.17 (theoretical intra-day high of 386.1) on September 3, 1929.
- 1929–1949: Bear market. The stock market crash of 1929 precedes the Great DepressionGreat DepressionThe Great Depression was a severe worldwide economic depression in the decade preceding World War II. The timing of the Great Depression varied across nations, but in most countries it started in about 1929 and lasted until the late 1930s or early 1940s...
. The Dow plunges to 41.22 (theoretical intra-day low of 40.56) on July 8, 1932, thus erasing 36 years of gains. Although cyclical bull markets occur in the 1930s and 1940s, the index would take 22 years to surpass its previous highs. - 1949–1966: Bull market. The Dow posts impressive growth in the booming economy following the Second World War. Starting from about 150 in June 1949, when P/E ratioP/E ratioThe P/E ratio of a stock is a measure of the price paid for a share relative to the annual net income or profit earned by the firm per share...
s reach multi-decade lows, the index ends just five points below 1,000 on February 9, 1966. - 1967–1982: Bear market. Traders deal with a stagnant economy in an inflationary monetary environment. The Dow enters two long downturns in 1970 and 1974; during the latter, it falls nearly 45% to the bottom of a 20-year range.
- 1982–2000: Bull market. The Dow experiences its most spectacular rise in history. From a meager 777 on August 12, 1982, the index grows more than 1,500% to close at 11,722.98 by January 14, 2000, without any major reversals except for a brief but severe downturnBlack Monday (1987)In finance, Black Monday refers to Monday October 19, 1987, when stock markets around the world crashed, shedding a huge value in a very short time. The crash began in Hong Kong and spread west to Europe, hitting the United States after other markets had already declined by a significant margin...
in 1987, which includes the largest daily percentage loss in Dow history. - 2000–present: Bear market. The index meanders and then plunges to a closing low of 7,286.27 on October 9, 2002. A cyclical bull peak above the 14,000 level, reached exactly five years later, does not surpass the inflation-adjusted 2000 high. A renewed bear is recognized in summer 2008 and multiple volatility records are set that autumn. Another acute phase in early 2009 brings the index to new 12½ year lows around 6,600, for a total loss of 53% in less than 18 months.
Incremental closing milestones
The following is a list of the milestone closing levels of the Dow Jones Industrial Average, in 100-point increments.| Milestone | Closing Level | Date first achieved |
|---|---|---|
| The first bull market (1896–1929) | ||
| 100 | 100.25 | January 12, 1906 |
| 200 | 200.93 | December 19, 1927 |
| 300 | 300.00 | December 31, 1928 |
| The post-World War II boom (1949–1966) | ||
| 381.171 | 382.74 | November 23, 1954 |
| 400 | 401.97 | December 29, 1954 |
| 500 | 500.24 | March 12, 1956 |
| 600 | 602.21 | February 20, 1959 |
| 700 | 705.52 | May 17, 1961 |
| 800 | 800.14 | February 28, 1964 |
| 900 | 900.95 | January 28, 1965 |
| The 1970s bear market (1967–1982) | ||
| 1,0002 | 1,003.16 | November 14, 1972 |
| The 1980s bull market (1982–1987) History of the United States (1980–1988) The history of the United States includes the last year of the Jimmy Carter presidency, eight years of the Ronald Reagan administration, and the first two years of the George H. W. Bush presidency, up to the collapse of the Soviet Union. Plagued by the Iran hostage crisis and mounting domestic... |
||
| 1,100 | 1,121.81 | February 24, 1983 |
| 1,200 | 1,209.46 | April 26, 1983 |
| 1,300 | 1,304.88 | May 20, 1985 |
| 1,400 | 1,403.44 | November 6, 1985 |
| 1,500 | 1,511.70 | December 11, 1985 |
| 1,600 | 1,600.69 | February 6, 1986 |
| 1,700 | 1,713.99 | February 27, 1986 |
| 1,800 | 1,804.24 | March 20, 1986 |
| 1,900 | 1,903.54 | July 1, 1986 |
| 2,000 | 2,002.25 | January 8, 1987 |
| 2,100 | 2,102.50 | January 19, 1987 |
| 2,200 | 2,201.49 | February 5, 1987 |
| 2,300 | 2,333.52 | March 20, 1987 |
| 2,400 | 2,405.54 | April 6, 1987 |
| 2,500 | 2,510.04 | July 17, 1987 |
| 2,600 | 2,635.84 | August 10, 1987 |
| 2,700 | 2,700.57 | August 17, 1987 |
| The 1990s bull acceleration (1990–2000) | ||
| 2,800 | 2,810.15 | January 2, 1990 |
| 2,900 | 2,900.97 | June 1, 1990 |
| 3,000 | 3,004.46 | April 17, 1991 |
| 3,100 | 3,101.52 | December 27, 1991 |
| 3,200 | 3,201.48 | January 3, 1992 |
| 3,300 | 3,306.13 | April 14, 1992 |
| 3,400 | 3,413.21 | June 1, 1992 |
| 3,500 | 3,500.03 | May 19, 1993 |
| 3,600 | 3,604.86 | August 18, 1993 |
| 3,700 | 3,710.77 | November 16, 1993 |
| 3,800 | 3,803.88 | January 6, 1994 |
| 3,900 | 3,914.48 | January 21, 1994 |
| 4,000 | 4,003.33 | February 23, 1995 |
| 4,100 | 4,138.67 | March 24, 1995 |
| 4,200 | 4,201.61 | April 4, 1995 |
| 4,300 | 4,303.98 | April 24, 1995 |
| 4,400 | 4,404.62 | May 10, 1995 |
| 4,500 | 4,510.69 | June 16, 1995 |
| 4,600 | 4,615.23 | July 5, 1995 |
| 4,700 | 4,702.73 | July 7, 1995 |
| 4,800 | 4,801.80 | September 14, 1995 |
| 4,900 | 4,922.75 | November 15, 1995 |
| 5,000 | 5,023.55 | November 21, 1995 |
| 5,100 | 5,105.56 | November 29, 1995 |
| 5,200 | 5,216.47 | December 13, 1995 |
| 5,300 | 5,304.98 | January 29, 1996 |
| 5,400 | 5,405.06 | February 1, 1996 |
| 5,500 | 5,539.45 | February 8, 1996 |
| 5,600 | 5,600.15 | February 12, 1996 |
| 5,700 | 5,748.82 | May 20, 1996 |
| 5,800 | 5,838.52 | September 13, 1996 |
| 5,900 | 5,904.90 | October 1, 1996 |
| 6,000 | 6,010.00 | October 14, 1996 |
| 6,100 | 6,177.71 | November 6, 1996 |
| 6,200 | 6,206.04 | November 7, 1996 |
| 6,300 | 6,313.00 | November 14, 1996 |
| 6,400 | 6,430.02 | November 20, 1996 |
| 6,500 | 6,547.79 | November 25, 1996 |
| 6,600 | 6,600.66 | January 7, 1997 |
| 6,700 | 6,703.09 | January 10, 1997 |
| 6,800 | 6,833.10 | January 17, 1997 |
| 6,900 | 6,961.63 | February 12, 1997 |
| 7,000 | 7,022.44 | February 13, 1997 |
| 7,100 & 7,200 | 7,214.49 | May 5, 1997 |
| 7,300 | 7,333.55 | May 15, 1997 |
| 7,400 | 7,435.78 | June 6, 1997 |
| 7,500 | 7,539.27 | June 10, 1997 |
| 7,600 & 7,700 | 7,711.47 | June 12, 1997 |
| 7,800 | 7,895.81 | July 3, 1997 |
| 7,900 | 7,962.31 | July 8, 1997 |
| 8,000 | 8,038.88 | July 16, 1997 |
| 8,100 | 8,116.93 | July 24, 1997 |
| 8,200 | 8,254.89 | July 30, 1997 |
| 8,300 | 8,314.55 | February 11, 1998 |
| 8,400 | 8,451.06 | February 18, 1998 |
| 8,500 | 8,545.72 | February 27, 1998 |
| 8,600 | 8,643.12 | March 10, 1998 |
| 8,700 | 8,718.85 | March 16, 1998 |
| 8,800 | 8,803.05 | March 19, 1998 |
| 8,900 | 8,906.43 | March 20, 1998 |
| 9,000 | 9,033.23 | April 6, 1998 |
| 9,100 | 9,110.02 | April 14, 1998 |
| 9,200 | 9,211.84 | May 13, 1998 |
| 9,300 | 9,328.19 | July 16, 1998 |
| 9,400 & 9,500 | 9,544.87 | January 6, 1999 |
| 9,600 | 9,643.37 | January 8, 1999 |
| 9,700 | 9,736.08 | March 8, 1999 |
| 9,800 | 9,897.44 | March 11, 1999 |
| 9,900 | 9,958.77 | March 15, 1999 |
| 10,000 | 10,006.78 | March 29, 1999 |
| 10,100 | 10,197.70 | April 8, 1999 |
| 10,200 & 10,300 | 10,339.51 | April 12, 1999 |
| 10,400 | 10,411.66 | April 14, 1999 |
| 10,500 | 10,581.42 | April 21, 1999 |
| 10,600 & 10,700 | 10,727.18 | April 22, 1999 |
| 10,800 | 10,831.71 | April 27, 1999 |
| 10,900 & 11,000 | 11,014.70 | May 3, 1999 |
| 11,100 | 11,107.19 | May 13, 1999 |
| 11,200 | 11,200.98 | July 12, 1999 |
| 11,300 | 11,326.04 | August 25, 1999 |
| 11,400 | 11,405.76 | December 23, 1999 |
| 11,500 | 11,522.56 | January 7, 2000 |
| 11,600 & 11,700 | 11,722.98 | January 14, 2000 |
| The mid-2000s cyclical bull (2003–2007) | ||
| 11,722.98 | 11,727.34 | October 3, 2006 |
| 11,800 | 11,850.61 | October 4, 2006 |
| 11,900 | 11,947.70 | October 12, 2006 |
| 12,000 | 12,011.73 | October 19, 2006 |
| 12,100 | 12,116.91 | October 23, 2006 |
| 12,200 | 12,218.01 | November 14, 2006 |
| 12,300 | 12,305.82 | November 16, 2006 |
| 12,400 | 12,416.76 | December 14, 2006 |
| 12,500 | 12,510.57 | December 27, 2006 |
| 12,600 | 12,621.77 | January 24, 2007 |
| 12,700 | 12,741.86 | February 14, 2007 |
| 12,800 | 12,803.84 | April 18, 2007 |
| 12,900 | 12,961.98 | April 20, 2007 |
| 13,000 | 13,089.89 | April 25, 2007 |
| 13,100 | 13,105.50 | April 26, 2007 |
| 13,200 | 13,211.88 | May 2, 2007 |
| 13,300 | 13,312.97 | May 7, 2007 |
| 13,400 | 13,487.53 | May 16, 2007 |
| 13,500 | 13,556.53 | May 18, 2007 |
| 13,600 | 13,633.08 | May 30, 2007 |
| 13,700 & 13,800 | 13,861.73 | July 12, 2007 |
| 13,900 | 13,907.25 | July 13, 2007 |
| 14,000 | 14,000.41 | July 19, 2007 |
| 14,100 | 14,164.53 | October 9, 2007 |
1This was the Dow's close at the peak of the 1929 bull market, a level that the Dow would not see again for 25 years.
2The Dow first exceeded 1000 during the trading day on January 18, 1966, but dropped back before closing that day. It would be nearly 7 years later before it closed above 1000 for the first time.
Record highs and decade lows
| Closing: | 14,164.53 | Tuesday, October 9, 2007 | 6,547 | Monday, March 9, 2009 |
| Intra-day Actual: | 14,198.10 | Thursday, October 11, 2007 | 6,469 | Friday, March 6, 2009 |
| Intra-day Theoretical: | 14,279.96 | Thursday, October 11, 2007 | 6,443 | Friday, March 6, 2009 |
See also
- List of largest daily changes in the Dow Jones Industrial Average
- Stock market bubbleStock market bubbleA stock market bubble is a type of economic bubble taking place in stock markets when market participants drive stock prices above their value in relation to some system of stock valuation....
- Stock market crashStock market crashA stock market crash is a sudden dramatic decline of stock prices across a significant cross-section of a stock market, resulting in a significant loss of paper wealth. Crashes are driven by panic as much as by underlying economic factors...