
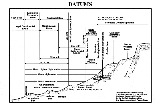
Chart datum
Encyclopedia
Nautical chart
A nautical chart is a graphic representation of a maritime area and adjacent coastal regions. Depending on the scale of the chart, it may show depths of water and heights of land , natural features of the seabed, details of the coastline, navigational hazards, locations of natural and man-made aids...
are measured from. A chart datum is generally a tidal datum; that is, a datum derived from some phase of the tide
Tide
Tides are the rise and fall of sea levels caused by the combined effects of the gravitational forces exerted by the moon and the sun and the rotation of the Earth....
. Common chart datums are lowest astronomical tide and mean lower low water.
Lowest astronomical tide
Many national charting agencies, including the United Kingdom Hydrographic OfficeUnited Kingdom Hydrographic Office
The United Kingdom Hydrographic Office is an organisation within the UK government responsible for providing navigational and other hydrographic information for national, civil and defence requirements...
and the Australian Hydrographic Service
Royal Australian Navy Hydrographic Service
The Australian Hydrographic Service is the Australian Commonwealth Government agency responsible for providing hydrographic services that meet Australia's obligations under the SOLAS convention and the national interest; enabling safe navigation, maritime trade and supporting protection of the...
, use the Lowest Astronomical Tide (LAT) - the height of the water at the lowest possible theoretical tide
Tide
Tides are the rise and fall of sea levels caused by the combined effects of the gravitational forces exerted by the moon and the sun and the rotation of the Earth....
- to define chart datums. LAT is the lowest levels which can be predicted to occur under average meteorological conditions..
The advantage of using LAT is that all tidal heights must then be positive (or zero) avoiding possible ambiguity and the need to explicitly state sign. Calculation of the LAT only allows for gravitational effects so lower tides may occur in practice due to other factors (e.g. meteorological effects such as high pressure
Pressure
Pressure is the force per unit area applied in a direction perpendicular to the surface of an object. Gauge pressure is the pressure relative to the local atmospheric or ambient pressure.- Definition :...
systems).
Mean lower low water
The United States' National Oceanic and Atmospheric AdministrationNational Oceanic and Atmospheric Administration
The National Oceanic and Atmospheric Administration , pronounced , like "noah", is a scientific agency within the United States Department of Commerce focused on the conditions of the oceans and the atmosphere...
uses mean lower low water (MLLW), which is the average of the lowest tide recorded at a tide station each day during the recording period. MLLW is generally located above LAT and therefore some tidal states may have negative heights.
Charts and tables
Charted depths and drying heightDrying height
On a nautical chart, the drying height is the vertical distance of the seabed that is exposed by the tide, above the level of the sea at the lowest astronomical tide.On admiralty charts a drying height is distinguished from a depth by being underlined....
s on a nautical chart
Nautical chart
A nautical chart is a graphic representation of a maritime area and adjacent coastal regions. Depending on the scale of the chart, it may show depths of water and heights of land , natural features of the seabed, details of the coastline, navigational hazards, locations of natural and man-made aids...
s are given relative to chart datum. Some height values on charts, such as vertical clearances under bridges or overhead wires, may be referenced to a different vertical datum, such as mean high water.
Tide table
Tide table
A tide table, sometimes called a tide chart, is used for tidal prediction and shows the daily times and height of high water and low water for a particular location...
s give the height of the tide above a chart datum. This makes it possible to calculate the depth of water at a given point and a given time by adding the charted depth to the height of the tide. To calculate whether an area that dries is under water, subtract the drying height from the height of the tide.
Using charts and tables that are not based on the same datum can result in incorrect calculation of water depths and should be avoided. Check that they are compatible before use.