Bessel's correction
Encyclopedia
In statistics
, Bessel's correction, named after Friedrich Bessel
, is the use of n − 1 instead of n in the formula for the sample variance and sample standard deviation
, where n is the number of observations in a sample: it corrects the bias in the estimation of the population variance, and some (but not all) of the bias in the estimation of the population standard deviation.
That is, when estimating
the population variance
and standard deviation
from a sample when the population mean is unknown, the sample variance is a biased estimator of the population variance, and systematically underestimates it. Multiplying the standard sample variance by n/(n − 1) (equivalently, using 1/(n − 1) instead of 1/n) corrects for this, and gives an unbiased estimator of the population variance. The cost of this correction is that the unbiased estimator has uniformly higher mean squared error
than the biased estimator. In some terminology, the factor n/(n − 1) is itself called Bessel's correction.
A subtle point is that, while the sample variance (using Bessel's correction) is an unbiased estimate of the population variance, its square root
, the sample standard deviation, is a biased estimate of the population standard deviation; because the square root is a concave function
, the bias is downward, by Jensen's inequality
. There is no general formula for an unbiased estimator of the population standard deviation, though there are correction factors for particular distributions, such as the normal; see unbiased estimation of standard deviation
for details.
One can understand Bessel's correction intuitively as the degrees of freedom
in the residuals
vector:
where is the mean. While there are n independent samples, there are only n − 1 independent residuals, as they sum to 0. This is explained further here.
One may compute the sample average:
This may serve as an observable estimate of the unobservable population average, which is 2050. Now we face the problem of estimating the population variance. That is the average of the squares of the deviations from 2050. If we knew that the population average is 2050, we could proceed as follows:
Statistics
Statistics is the study of the collection, organization, analysis, and interpretation of data. It deals with all aspects of this, including the planning of data collection in terms of the design of surveys and experiments....
, Bessel's correction, named after Friedrich Bessel
Friedrich Bessel
-References:* John Frederick William Herschel, A brief notice of the life, researches, and discoveries of Friedrich Wilhelm Bessel, London: Barclay, 1847 -External links:...
, is the use of n − 1 instead of n in the formula for the sample variance and sample standard deviation
Sample standard deviation
A sample standard deviation is an estimate, based on a sample, of a population standard deviation. See:* Standard deviation#Estimation* Sample mean and sample covariance...
, where n is the number of observations in a sample: it corrects the bias in the estimation of the population variance, and some (but not all) of the bias in the estimation of the population standard deviation.
That is, when estimating
Estimation theory
Estimation theory is a branch of statistics and signal processing that deals with estimating the values of parameters based on measured/empirical data that has a random component. The parameters describe an underlying physical setting in such a way that their value affects the distribution of the...
the population variance
Variance
In probability theory and statistics, the variance is a measure of how far a set of numbers is spread out. It is one of several descriptors of a probability distribution, describing how far the numbers lie from the mean . In particular, the variance is one of the moments of a distribution...
and standard deviation
Standard deviation
Standard deviation is a widely used measure of variability or diversity used in statistics and probability theory. It shows how much variation or "dispersion" there is from the average...
from a sample when the population mean is unknown, the sample variance is a biased estimator of the population variance, and systematically underestimates it. Multiplying the standard sample variance by n/(n − 1) (equivalently, using 1/(n − 1) instead of 1/n) corrects for this, and gives an unbiased estimator of the population variance. The cost of this correction is that the unbiased estimator has uniformly higher mean squared error
Mean squared error
In statistics, the mean squared error of an estimator is one of many ways to quantify the difference between values implied by a kernel density estimator and the true values of the quantity being estimated. MSE is a risk function, corresponding to the expected value of the squared error loss or...
than the biased estimator. In some terminology, the factor n/(n − 1) is itself called Bessel's correction.
A subtle point is that, while the sample variance (using Bessel's correction) is an unbiased estimate of the population variance, its square root
Square root
In mathematics, a square root of a number x is a number r such that r2 = x, or, in other words, a number r whose square is x...
, the sample standard deviation, is a biased estimate of the population standard deviation; because the square root is a concave function
Concave function
In mathematics, a concave function is the negative of a convex function. A concave function is also synonymously called concave downwards, concave down, convex upwards, convex cap or upper convex.-Definition:...
, the bias is downward, by Jensen's inequality
Jensen's inequality
In mathematics, Jensen's inequality, named after the Danish mathematician Johan Jensen, relates the value of a convex function of an integral to the integral of the convex function. It was proved by Jensen in 1906. Given its generality, the inequality appears in many forms depending on the context,...
. There is no general formula for an unbiased estimator of the population standard deviation, though there are correction factors for particular distributions, such as the normal; see unbiased estimation of standard deviation
Unbiased estimation of standard deviation
The question of unbiased estimation of a standard deviation arises in statistics mainly as question in statistical theory. Except in some important situations, outlined later, the task has little relevance to applications of statistics since its need is avoided by standard procedures, such as the...
for details.
One can understand Bessel's correction intuitively as the degrees of freedom
Degrees of freedom (statistics)
In statistics, the number of degrees of freedom is the number of values in the final calculation of a statistic that are free to vary.Estimates of statistical parameters can be based upon different amounts of information or data. The number of independent pieces of information that go into the...
in the residuals
Errors and residuals in statistics
In statistics and optimization, statistical errors and residuals are two closely related and easily confused measures of the deviation of a sample from its "theoretical value"...
vector:
where
is the mean. While there are n independent samples, there are only n − 1 independent residuals, as they sum to 0. This is explained further here.The source of the bias
Suppose the mean of the whole population is 2050, but the statistician does not know that, and must estimate it based on this small sample chosen randomly from the population:
One may compute the sample average:

This may serve as an observable estimate of the unobservable population average, which is 2050. Now we face the problem of estimating the population variance. That is the average of the squares of the deviations from 2050. If we knew that the population average is 2050, we could proceed as follows:
-

But our estimate of the population average is the sample average, 2052, not 2050. Therefore we do what we can:-

This is a substantially smaller estimate. Now a question arises: is the estimate of the population variance that arises in this way using the sample mean always smaller than what we would get if we used the population mean? The answer is yes except when the sample mean happens to be the same as the population mean.
In intuitive terms, we are seeking the sum of squared distances from the population mean, but end up calculating the sum of squared differences from the sample mean, which, as will be seen, is the number that minimizes that sum of squared distances. So unless the sample happens to have the same mean as the population, this estimate will always underestimate the population variance.
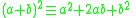
To see why this happens, we use a simple identity in algebra:
With representing the deviation from an individual to the sample mean, and
  representing the deviation from the sample mean to the population mean. Note that we've simply decomposed the actual deviation from the (unknown) population mean into two components: the deviation to the sample mean, which we can compute, and the additional deviation to the population mean, which we can not. Now apply that identity to the squares of deviations from the population mean:
-
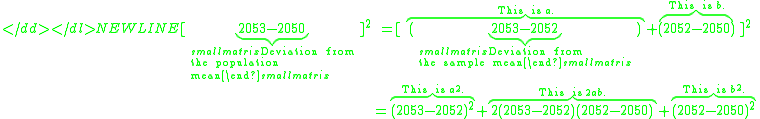
Now apply this to all five observations and observe certain patterns:-
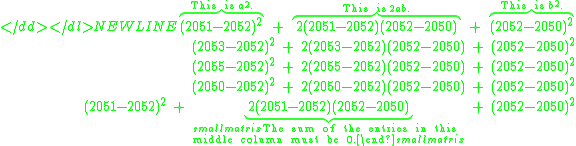
The sum of the entries in the middle column must be zero because the sum of the deviations from the sample average must be zero. When the middle column has vanished, we then observe that- The sum of the entries in the first column is the sum of the squares of the deviations from the sample mean;
- The sum of all of the entries in the remaining two columns (a and b) is the sum of squares of the deviations from the population mean, because of the way we started with [2053 − 2050]2, and did the same with the other four entries;
- The sum of all the entries must be bigger than the sum of the entries in the first column, since all the entries that have not vanished are positive (except when the population mean is the same as the sample mean, in which case all of the numbers in the last column will be 0).
Therefore:- The sum of squares of the deviations from the population mean will be bigger than the sum of squares of the deviations from the sample mean (except when the population mean is the same as the sample mean, in which case the two are equal).
That is why the sum of squares of the deviations from the sample mean is too small to give an unbiased estimate of the population variance when the average of those squares is found.
Terminology
This correction is so common that the term "sample standard deviation" is frequently used to mean the unbiased estimator (using n − 1). However caution is needed: some calculators and software packages may provide for both or only the more unusual formulation. This article uses the following symbols and definitions:
- μ is the population mean
 is the sample mean
- σ2 is the population variance
- sn2 is the biased sample variance (i.e. without Bessel's correction)
- s2 is the unbiased sample variance (i.e. with Bessel's correction)
The standard deviations will then be the square roots of the respective variances.
Formula
The sample mean is given by

The biased sample variance is then written:
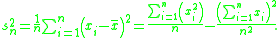
and the unbiased sample variance is written:
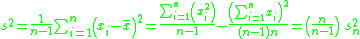
Proof that Bessel's correction yields an unbiased estimator of the population variance
By definition,
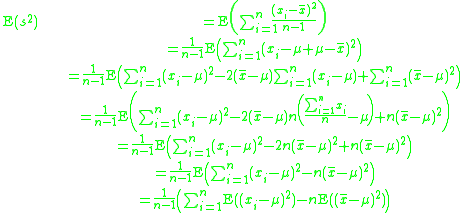
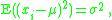
Note that, since x1, x2, · · · , xn are a random sample from a distribution with variance σ2, it follows that for each i = 1, 2, . . . , n:
and also
This is a property of the variance of uncorrelated variables, arising from the Bienaymé formula. For a proof, see here. The required result is then obtained by substituting these two formulae:

See also
- Bias of an estimatorBias of an estimatorIn statistics, bias of an estimator is the difference between this estimator's expected value and the true value of the parameter being estimated. An estimator or decision rule with zero bias is called unbiased. Otherwise the estimator is said to be biased.In ordinary English, the term bias is...
- Standard deviationStandard deviationStandard deviation is a widely used measure of variability or diversity used in statistics and probability theory. It shows how much variation or "dispersion" there is from the average...
- Unbiased estimation of standard deviationUnbiased estimation of standard deviationThe question of unbiased estimation of a standard deviation arises in statistics mainly as question in statistical theory. Except in some important situations, outlined later, the task has little relevance to applications of statistics since its need is avoided by standard procedures, such as the...
-
-
-