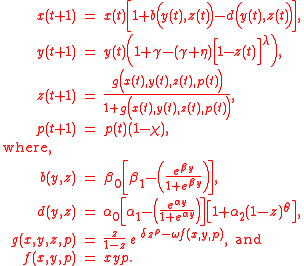
Governing equations
Denote the four state variables as:  (population),
  (per capita output),
  (stock of natural capital) and
  (pollution flow per unit of output). Let
  and
and
 , then the state variables evolve in discrete time
, according to the following difference equations (Sanderson, 1994).

Altogether, these equations depend upon 15 parameters.
| Sector | Parameter |
|---|---|
| Economic |  |
| Demographic |  |
| Anthropogenic |  |
 and
and  represent the birth rate
and death rate respectively. Both saturate as per capita output rises, in agreement with empirical studies (Cohen, 1995).
The form of  follows from the IPAT Hypothesis.
System behavior
Using the Scenario analysistechnique, Sanderson (1994) studied two possible futures for the idealized world described by Wonderland. One future entitled Dream, held out the possibility of unending sustainable growth, while the other termed Horror, ended in environmental collapse and eventual extinction of the population. Subsequent work (Kohring, 2006) showed that the parameters of the model can be bisected into two sets, one which always produces sustainable futures and one which always ends in collapse and extinction. Additionally, the equations of Wonderland exhibit chaotic behavior (Gröller, et al., 1996, Wegenkittl, et al., 1997, Leeves and Herbert, 1998).
Avoiding collapse
In the basic model it is impossible to avoid or recover from the environmental collapse seen in the Horror scenario without changes to the model itself. Two such changes have been studied:pollution abatement and pollution avoidance
.
Pollution abatement
Abating the effects of pollution draws funds from other sources to pay for cleaning up the environment (Sanderson, 1994). This decreases the value of entering into the equations for birth,
  , and death,
  :
:

The time evolution of  is unaffected because those goods and services needed for pollution abatement must also be considered part of the overall output. The impact of these changes on the environment is expressed by changes to
  :
:

These changes introduce three new parameters into the model:
| Sector | Parameter |
|---|---|
| Policy Levers |  |
By adjusting the policy levers, it is possible to cleanup a polluted environment and recover from the collapse seen in the Horror scenario. However, the recovery is only temporary, after a brief time of robust growth the system again collapses, leading to endless cycles of collapse followed by recovery. Abating pollution does not alter the fundamental division of the parameters into the two sets of sustainable and unsustainable futures (Kohring, 2006).
Pollution avoidance
Pollution avoidanceaims to prevent pollution from entering into the environment, by making its production unprofitable. This is modeled by means of a pollution tax (Herbert and Leeves, 1998, Lempert, et al., 2003):

The new parameters for the pollution avoidance model are:
| Sector | Parameter |
|---|---|
| Policy Levers |  |
With these changes, it is possible to raise the tax rate,  , such that the system never collapses and the horror scenario is avoided altogether. Regardless of the other parameters, it is always possible to increase
  in order to avoid collapse thereby enabling unending sustainable growth (Kohring, 2006).
Production function
Instead of the relatively simple economic growth equation used for some researchers use a Cobb–Douglas production function instead (Leeves and Herbert, 2002).
