
Software visualization
Encyclopedia
Software visualization is the static or animated 2-D or 3-D visual representation of information about software systems based on their structure, size, history, or behavior.
Typically, the information used for visualization is software metric
data from measurement activities or from reverse engineering
. Visualization is inherently not a method for software quality assurance
but can be used to manually discover anomalies similar to the process of visual data mining.
The objectives of software visualizations are to support the understanding of software systems
(i.e., its structure) and algorithms (e.g., by animating the behavior of sorting algorithms) as well as the analysis of software systems and their anomalies (e.g., by showing classes with high coupling
).
(e.g., Visual Studio, Eclipse
) they visualized the direct relationship of a class and its methods with other classes in the software system and mark potential quality defects to warn the developer. A further benefit is the support for visual navigation through the software system.
techniques for defect discovery.
Typically, the information used for visualization is software metric
Software metric
A software metric is a measure of some property of a piece of software or its specifications. Since quantitative measurements are essential in all sciences, there is a continuous effort by computer science practitioners and theoreticians to bring similar approaches to software development...
data from measurement activities or from reverse engineering
Reverse engineering
Reverse engineering is the process of discovering the technological principles of a device, object, or system through analysis of its structure, function, and operation...
. Visualization is inherently not a method for software quality assurance
Software quality assurance
Software quality assurance consists of a means of monitoring the software engineering processes and methods used to ensure quality. The methods by which this is accomplished are many and varied, and may include ensuring conformance to one or more standards, such as ISO 9000 or a model such as...
but can be used to manually discover anomalies similar to the process of visual data mining.
The objectives of software visualizations are to support the understanding of software systems
Program comprehension
Program comprehension is a domain of computer science concerned with the ways software engineers maintain existing source code. The cognitive and other processes involved are identified and studied...
(i.e., its structure) and algorithms (e.g., by animating the behavior of sorting algorithms) as well as the analysis of software systems and their anomalies (e.g., by showing classes with high coupling
Coupling (computer science)
In computer science, coupling or dependency is the degree to which each program module relies on each one of the other modules.Coupling is usually contrasted with cohesion. Low coupling often correlates with high cohesion, and vice versa...
).
Single component
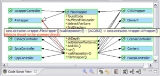
Tool for software visualization might be used to visualize source code and quality defects during software development and maintenance activities. Their target is the automatic discovery and visualization of quality defects in object-oriented software systems and services. Designed as a plugin for an IDEIntegrated development environment
An integrated development environment is a software application that provides comprehensive facilities to computer programmers for software development...
(e.g., Visual Studio, Eclipse
Eclipse (software)
Eclipse is a multi-language software development environment comprising an integrated development environment and an extensible plug-in system...
) they visualized the direct relationship of a class and its methods with other classes in the software system and mark potential quality defects to warn the developer. A further benefit is the support for visual navigation through the software system.
Whole (sub-)systems
Other more powerful tools are used to visualize a whole system or subsystem to explore the architecture or to apply visual data mining or visual analyticsVisual analytics
Visual analytics is an outgrowth of the fields information visualization and scientific visualization, that focuses on analytical reasoning facilitated by interactive visual interfaces...
techniques for defect discovery.
See also
- Programs
-
- Flowchart4j
- Imagix 4DImagix 4DImagix 4D is a source code analysis tool from Imagix Corporation, used primarily for understanding, documenting and evolving existing C, C++ and Java software....
- NDependNDependNDepend is a static analysis tool for .NET managed code. This tool supports a large number of code metrics, allows for visualization of dependencies using directed graphs and dependency matrix. The tools also performs code base snapshots comparison, and validation of architectural and quality rules...
- SonarJSonarJSonargraph is a commercial tool for static code analysis of software written in Java. By parsing the compiled classes and the source code it builds an in memory dependency and metrics model of the analyzed code. The model dependencies can then be visualized graphically so that the user is able to...
- SotoarcSotoarcSotoarc is a commercial static code analysis tool for software architects. It graphically visualizes the static structure of software systems written in Java, C# or in C++ code. The code structure is displayed as hierarchies of modules, packages and files.Besides the user can describe by...
- Structure101
- Visual Studio (Visual Studio 2010 Ultimate)
- Experts
-
- Ronald BaeckerRonald BaeckerDr. Ron Baecker is a tenured Professor of Computer Science at the University of Toronto, and has held these positions since 1989...
- Ronald Baecker
- Related concepts
-
- Cognitive dimensions of notations
- Software archaeologySoftware archaeologySoftware archaeology or software archeology is the study of poorly documented or undocumented legacy software implementations, as part of software maintenance...
Further reading
- Diehl, S. (2002). Software Visualization. International Seminar. Revised Papers (LNCS Vol. 2269), Dagstuhl Castle, Germany, 20-25 May 2001 (Dagstuhl Seminar Proceedings).
- Diehl, S. (2007). Software Visualization — Visualizing the Structure, Behaviour, and Evolution of Software. Springer, 2007, ISBN 978-3-540-46504-1
- Gîrba, T., Kuhn, A., Seeberger, M., and Ducasse, S., “How Developers Drive Software Evolution,” Proceedings of International Workshop on Principles of Software Evolution (IWPSE 2005), IEEE Computer Society Press, 2005, pp. 113–122. PDF
- Keim, D. A. (2002). Information visualization and visual data mining. IEEE Transactions on Visualization and Computer Graphics, USA * vol 8 (Jan. March 2002), no 1, p 1 8, 67 refs.
- Knight, C. (2002). System and Software Visualization. In Handbook of software engineering & knowledge engineering. Vol. 2, Emerging technologies (Vol. 2): World Scientific Publishing Company.
- Kuhn, A., and Greevy, O., “Exploiting the Analogy Between Traces and Signal Processing,” Proceedings IEEE International Conference on Software Maintenance (ICSM 2006), IEEE Computer Society Press, Los Alamitos CA, September 2006. PDF
- Lanza, M. (2004). CodeCrawler — polymetric views in action. Proceedings. 19th International Conference on Automated Software Engineering, Linz, Austria, 20 24 Sept. 2004 * Los Alamitos, CA, USA: IEEE Comput. Soc, 2004, p 394 5.
- Lopez, F. L., Robles, G., & Gonzalez, B. J. M. (2004). Applying social network analysis to the information in CVS repositories. "International Workshop on Mining Software Repositories (MSR 2004)" W17S Workshop 26th International Conference on Software Engineering, Edinburgh, Scotland, UK, 25 May 2004 * Stevenage, UK: IEE, 2004, p 101 5.
- Marcus, A., Feng, L., & Maletic, J. I. (2003). 3D representations for software visualization. Paper presented at the Proceedings of the 2003 ACM symposium on Software visualization, San Diego, California.
- Soukup, T. (2002). Visual data mining : techniques and tools for data visualization and mining. New York: Chichester.
- Staples, M. L., & Bieman, J. M. (1999). 3-D Visualization of Software Structure. In Advances in Computers (Vol. 49, pp. 96–143): Academic Press, London.
- Stasko, J. T., Brown, M. H., & Price, B. A. (1997). Software Visualization: MIT Press.
- Van Rysselberghe, F. (2004). Studying Software Evolution Information By Visualizing the Change History. Proceedings. 20th International Conference On Software Maintenance. pp 328–337, IEEE Computer Society Press, 2004
- Wettel, R., and Lanza, M., Visualizing Software Systems as Cities. In Proceedings of VISSOFT 2007 (4th IEEE International Workshop on Visualizing Software For Understanding and Analysis), pp. 92 – 99, IEEE Computer Society Press, 2007.
External links
- SoftVis the ACM Symposium on Software Visualization
- Software Visualization Blog information on Software Visualization
- The Program Visualization Workshops aim to bring together researchers who design and construct program, algorithm, or data structure visualizations or animations as well as educators who use or evaluate visualization or animations in their teaching.
- EPDV Eclipse Project Dependencies Viewer
- CppDepend - useful C++ tool to visualize dependencies.