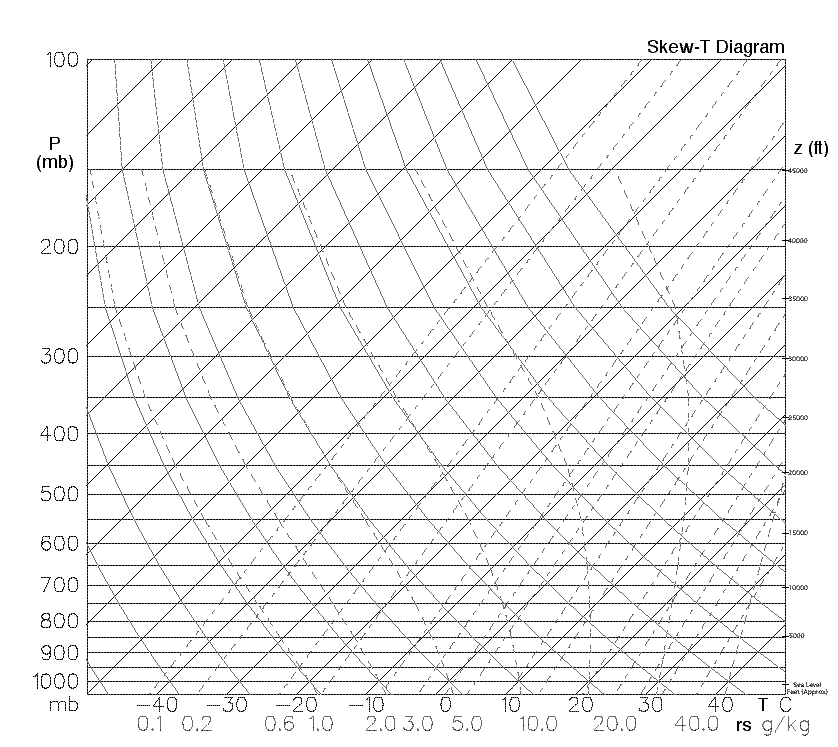
Skew-T log-P diagram
Encyclopedia

Thermodynamic diagrams
Thermodynamic diagrams are diagrams used by scientists and engineers to represent the thermodynamic states of a material and the consequences of manipulating this material...
commonly used in weather
Weather
Weather is the state of the atmosphere, to the degree that it is hot or cold, wet or dry, calm or stormy, clear or cloudy. Most weather phenomena occur in the troposphere, just below the stratosphere. Weather refers, generally, to day-to-day temperature and precipitation activity, whereas climate...
analysis and forecasting. In 1947, N. Herlofson proposed a modification to the emagram
Emagram
An emagram is one of four thermodynamic diagrams used to display temperature lapse rate and moisture content profiles in the atmosphere. The emagram has axes of temperature and pressure...
which allows straight, horizontal isobars, and provides for a large angle between isotherms and dry adiabats, similar to that in the tephigram
Tephigram
A tephigram is one of four thermodynamic diagrams commonly used in weather analysis and forecasting. The name evolved from the original name "T-\phi-gram" to describe the axes of temperature and entropy used to create the plot...
. It was thus more suitable for some of the newer analysis techniques being invented by the United States Air Force
United States Air Force
The United States Air Force is the aerial warfare service branch of the United States Armed Forces and one of the American uniformed services. Initially part of the United States Army, the USAF was formed as a separate branch of the military on September 18, 1947 under the National Security Act of...
.
The major use for skew-T log-P diagrams is the plotting of radiosonde soundings
Atmospheric sounding
An atmospheric sounding is a measurement of vertical distribution of physical properties of the atmospheric column such as pressure, temperature, wind speed and wind direction , liquid water content, ozone concentration, pollution, and other properties...
, which give a vertical profile of the temperature
Temperature
Temperature is a physical property of matter that quantitatively expresses the common notions of hot and cold. Objects of low temperature are cold, while various degrees of higher temperatures are referred to as warm or hot...
and dew point
Dew point
The dew point is the temperature to which a given parcel of humid air must be cooled, at constant barometric pressure, for water vapor to condense into liquid water. The condensed water is called dew when it forms on a solid surface. The dew point is a saturation temperature.The dew point is...
through the atmosphere above a certain point on the ground. The isopleths on the diagram can then be used to simplify many tedious calculations involved, which were previously performed by hand or not at all.

