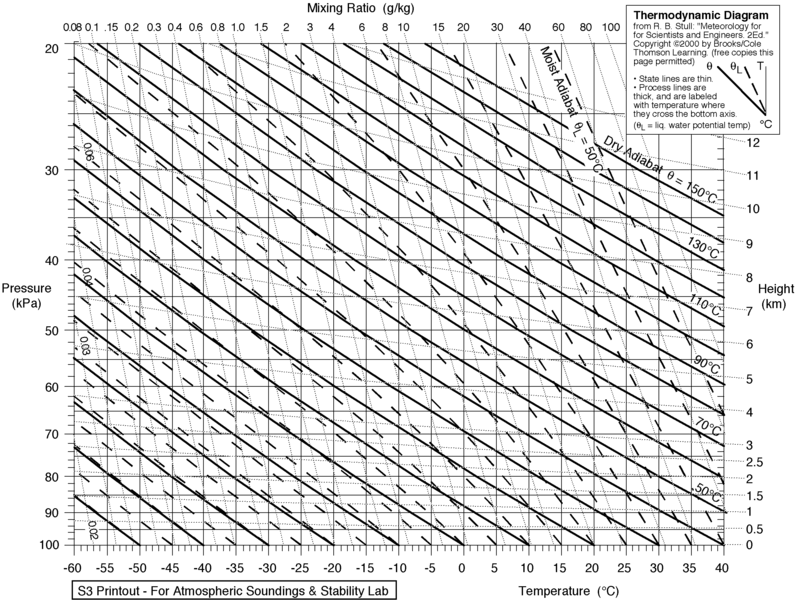
Emagram
Encyclopedia
An emagram is one of four thermodynamic diagrams
used to display temperature lapse rate
and moisture content profiles in the atmosphere. The emagram has axes of temperature
(T) and pressure
(p). In the emagram, the dry adiabats make an angle of about 45 degrees with the isobars, isotherms are vertical and isopleths of saturation mixing ratio are almost straight and vertical.
Usually, temperature
and dew point
data from radiosonde
s are plotted on these diagrams to allow calculations of convective stability or Convective Available Potential Energy
. Wind barbs are often plotted at the side of a tephigram to indicate the winds at different heights.
First devised in 1884 by Heinrich Hertz
, the emagram is used primarily in Europe
. Other countries use similar thermodynamic diagrams for the same purpose. However, the details of their construction vary.
example:
Thermodynamic diagrams
Thermodynamic diagrams are diagrams used by scientists and engineers to represent the thermodynamic states of a material and the consequences of manipulating this material...
used to display temperature lapse rate
Lapse rate
The lapse rate is defined as the rate of decrease with height for an atmospheric variable. The variable involved is temperature unless specified otherwise. The terminology arises from the word lapse in the sense of a decrease or decline; thus, the lapse rate is the rate of decrease with height and...
and moisture content profiles in the atmosphere. The emagram has axes of temperature
Temperature
Temperature is a physical property of matter that quantitatively expresses the common notions of hot and cold. Objects of low temperature are cold, while various degrees of higher temperatures are referred to as warm or hot...
(T) and pressure
Pressure
Pressure is the force per unit area applied in a direction perpendicular to the surface of an object. Gauge pressure is the pressure relative to the local atmospheric or ambient pressure.- Definition :...
(p). In the emagram, the dry adiabats make an angle of about 45 degrees with the isobars, isotherms are vertical and isopleths of saturation mixing ratio are almost straight and vertical.
Usually, temperature
Temperature
Temperature is a physical property of matter that quantitatively expresses the common notions of hot and cold. Objects of low temperature are cold, while various degrees of higher temperatures are referred to as warm or hot...
and dew point
Dew point
The dew point is the temperature to which a given parcel of humid air must be cooled, at constant barometric pressure, for water vapor to condense into liquid water. The condensed water is called dew when it forms on a solid surface. The dew point is a saturation temperature.The dew point is...
data from radiosonde
Radiosonde
A radiosonde is a unit for use in weather balloons that measures various atmospheric parameters and transmits them to a fixed receiver. Radiosondes may operate at a radio frequency of 403 MHz or 1680 MHz and both types may be adjusted slightly higher or lower as required...
s are plotted on these diagrams to allow calculations of convective stability or Convective Available Potential Energy
Convective available potential energy
In meteorology, convective available potential energy , sometimes, simply, available potential energy , is the amount of energy a parcel of air would have if lifted a certain distance vertically through the atmosphere...
. Wind barbs are often plotted at the side of a tephigram to indicate the winds at different heights.
First devised in 1884 by Heinrich Hertz
Heinrich Rudolf Hertz
Heinrich Rudolf Hertz was a German physicist who clarified and expanded the electromagnetic theory of light that had been put forth by Maxwell...
, the emagram is used primarily in Europe
Europe
Europe is, by convention, one of the world's seven continents. Comprising the westernmost peninsula of Eurasia, Europe is generally 'divided' from Asia to its east by the watershed divides of the Ural and Caucasus Mountains, the Ural River, the Caspian and Black Seas, and the waterways connecting...
. Other countries use similar thermodynamic diagrams for the same purpose. However, the details of their construction vary.
example:


