Real business cycle theory
Encyclopedia
Real business cycle theory (RBC theory) are a class of macroeconomic models in which business cycle
fluctuations to a large extent can be accounted for by real (in contrast to nominal) shocks
. Unlike other leading theories of the business cycle, RBC theory sees recessions and periods of economic growth
as the efficient response to exogenous
changes in the real economic environment. That is, the level of national output necessarily maximizes expected utility, and government should therefore concentrate on the long-run structural policy changes and not intervene through discretionary fiscal
or monetary policy
designed to actively smooth out economic short-term fluctuations.
According to RBC theory, business cycles are therefore "real" in that they do not represent a failure of markets to clear
but rather reflect the most efficient possible operation of the economy, given the structure of the economy. RBC theory differs in this way from other theories of the business cycle such as Keynesian economics
and Monetarism
that see recessions as the failure of some market to clear.
RBC theory is associated with freshwater economics (the Chicago school of economics in the neoclassical
tradition).
 A common way to observe such behavior is by looking at a time series of an economy’s output, more specifically gross national product (GNP). This is just the value of the goods and services produced by a country’s businesses and workers.
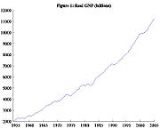
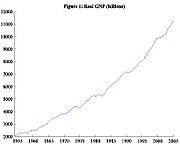
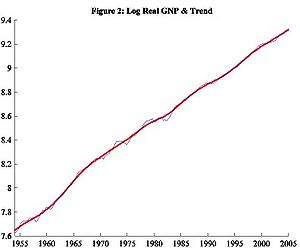
Figure 1 shows the time series of real GNP for the United States from 1954-2005. While we see continuous growth of output, it is not a steady increase. There are times of faster growth and times of slower growth. Figure 2 transforms these levels into growth rates of real GNP and extracts a smoother growth trend. A common method to obtain this trend is the Hodrick-Prescott filter
. The basic idea is to find a balance between the extent to which general growth trend follows the cyclical movement (since long term growth rate is not likely to be perfectly constant) and how smooth it is. The HP filter identifies the longer term fluctuations as part of the growth trend while classifying the more jumpy fluctuations as part of the cyclical component.
 Observe the difference between this growth component and the jerkier data. Economists refer to these cyclical movements about the trend as business cycles. Figure 3 explicitly captures such deviations. Note the horizontal axis at 0. A point on this line indicates at that year, there is no deviation from the trend. All other points above and below the line imply deviations. By using log real GNP the distance between any point and the 0 line roughly equals the percentage deviation from the long run growth trend.
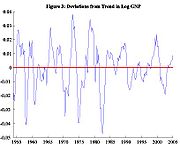 We call large positive deviations (those above the 0 axis) peaks. We call relatively large negative deviations (those below the 0 axis) troughs. A series of positive deviations leading to peaks are booms and a series of negative deviations leading to troughs are recessions.
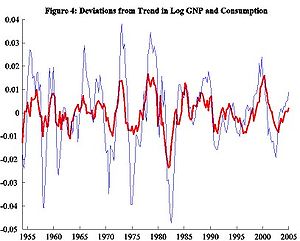
At a glance, the deviations just look like a string of waves bunched together—nothing about it appears consistent. To explain causes of such fluctuations may appear rather difficult given these irregularities. However, if we consider other macroeconomic variables, we will observe patterns in these irregularities. For example, consider Figure 4 which depicts fluctuations in output and consumption spending, i.e. what people buy and use at any given period. Observe how the peaks and troughs align at almost the same places and how the upturns and downturns coincide.
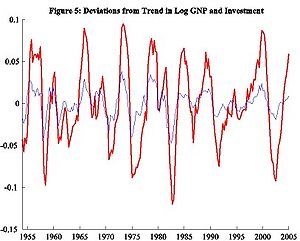
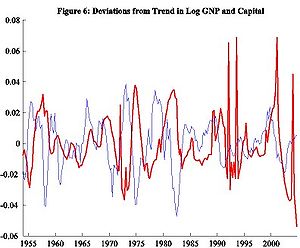
 We might predict that other similar data may exhibit similar qualities. For example, (a) labor, hours worked (b) productivity, how effective firms use such capital or labor, (c) investment, amount of capital saved to help future endeavors, and (d) capital stock, value of machines, buildings and other equipment that help firms produce their goods. While Figure 5 shows a similar story for investment, the relationship with capital in Figure 6 departs from the story. We need a way to pin down a better story; one way is to look at some statistics.
. One is persistence. For example, if we take any point in the series above the trend (the x-axis in figure 3), the probability the next period is still above the trend is very high. However, this persistence wears out over time. That is, economic activity in the short run is quite predictable but due to the irregular long-term nature of fluctuations, forecasting in the long run is much more difficult if not impossible.
Another regularity is cyclical variability. Column A of Table 1 lists a measure of this with standard deviations. The magnitude of fluctuations in output and hours worked are nearly equal. Consumption and productivity are similarly much smoother than output while investment fluctuates much more than output. Capital stock is the least volatile of the indicators.
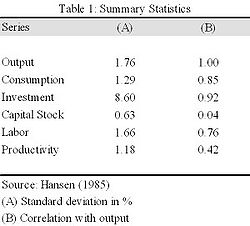 Yet another regularity is the co-movement between output and the other macroeconomic variables. Figures 4 - 6 illustrated such relationship. We can measure this in more detail using correlation
s as listed in column B of Table 1. Procyclical variables have positive correlations since it usually increases during booms and decreases during recessions. Vice versa, a countercyclical
variable associates with negative correlations. Acyclical, correlations close to zero, implies no systematic relationship to the business cycle. We find that productivity is slightly procyclical. This implies workers and capital are more productive when the economy is experiencing a boom. They aren’t quite as productive when the economy is experiencing a slowdown. Similar explanations follow for consumption and investment, which are strongly procyclical. Labor is also procyclical while capital stock appears acyclical.
Observing these similarities yet seemingly non-deterministic fluctuations about trend, we come to the burning question of why any of this occurs. It’s common sense that people prefer economic booms over recessions. It follows that if all people in the economy make optimal decisions, these fluctuations are caused by something outside the decision-making process. So the key question really is: what main factor influences and subsequently changes the decisions of all actors in an economy?
and Edward C. Prescott
in their seminal 1982 work Time to Build And Aggregate Fluctuations. They envisioned this factor to be technological shocks i.e., random fluctuations in the productivity level that shifted the constant growth trend up or down. Examples of such shocks include innovations, bad weather, imported oil price increase, stricter environmental and safety regulations, etc. The general gist is that something occurs that directly changes the effectiveness of capital and/or labour. This in turn affects the decisions of workers and firms, who in turn change what they buy and produce and thus eventually affect output. RBC models predict time sequences of allocation for consumption, investment, etc. given these shocks.
But exactly how do these productivity shocks cause ups and downs in economic activity? Let’s consider a positive but temporary shock to productivity. This momentarily increases the effectiveness of workers and capital, allowing a given level of capital and labor to produce more output.
Individuals face two types of tradeoffs. One is the consumption-investment decision. Since productivity is higher, people have more output to consume. An individual might choose to consume all of it today. But if he values future consumption, all that extra output might not be worth consuming in its entirety today. Instead, he may consume some but invest the rest in capital to enhance production in subsequent periods and thus increase future consumption. This explains why investment spending is more volatile than consumption. The life cycle hypothesis argues that households base their consumption decisions on expected lifetime income and so they prefer to “smooth” consumption over time. They will thus save (and invest) in periods of high income and defer consumption of this to periods of low income.
The other decision is the labor-leisure tradeoff. Higher productivity encourages substitution of current work for future work since workers will earn more per hour today compared to tomorrow. More labor and less leisure results in higher output today. greater consumption and investment today. On the other hand, there is an opposing effect: since workers are earning more, they may not want to work as much today and in future periods. However, given the pro-cyclical nature of labor, it seems that the above “substitution effect” dominates this “income effect”.
Overall, the basic RBC model predicts that given a temporary shock, output, consumption, investment and labor all rise above their long-term trends and hence formulate into a positive deviation. Furthermore, since more investment means more capital is available for the future, a short-lived shock may have an impact in the future. That is, above-trend behavior may persist for some time even after the shock disappears. This capital accumulation is often referred to as an internal “propagation mechanism”, since it may increase the persistence of shocks to output.
It is easy to see that a string of such productivity shocks will likely result in a boom. Similarly, recessions follow a string of bad shocks to the economy. If there were no shocks, the economy would just continue following the growth trend with no business cycles.
Essentially this is how the basic RBC model qualitatively explains key business cycle regularities. Yet any good model should also generate business cycles that quantitatively match the stylized facts in Table 1, our empirical benchmark. Kydland and Prescott introduced calibration techniques to do just this. The reason why this theory is so celebrated today is that using this methodology, the model closely mimics many business cycle properties. Yet current RBC models have not fully explained all behavior and neoclassical economists are still searching for better variations.
It is important to note the main assumption in RBC theory is that individuals and firms respond optimally all the time. In other words, if the government came along and forced people to work more or less than they would have otherwise, it would most likely make people unhappy. It follows that business cycles exhibited in an economy are chosen in preference to no business cycles at all. This is not to say that people like to be in a recession. Slumps are preceded by an undesirable productivity shock which constrains the situation. But given these new constraints, people will still achieve the best outcomes possible and markets will react efficiently. So when there is a slump, people are choosing to be in that slump because given the situation, it is the best solution. This suggests laissez-faire (non-intervention) is the best policy of government towards the economy but given the abstract nature of the model, this has been debated.
A pre-cursor to RBC theory was developed by monetary economists Milton Friedman and Robert Lucas in the early 1970s. They envisioned the factor that influenced people’s decisions to be misperception of wages—that booms/recessions occurred when workers perceived wages higher/lower than they really were. This meant they worked and consumed more/less than otherwise. In a world of perfect information, there would be no booms or recessions.
, which is usually used for the construction of economic models, calibration only returns to the drawing board to change the model in the face of overwhelming evidence against the model being correct; this inverts the burden of proof away from the builder of the model. In fact, simply stated, it is the process of changing the model to fit the data. Since RBC models explain data ex post, it is very difficult to falsify any one model that could be hypothesised to explain the data. RBC models are highly sample specific, leading some to believe that they have little or no predictive power.
: RBC theory categorically rejects Keynesian economics
and real effectiveness of monetarism
, which are the pillars of mainstream
macroeconomic policy, while such noted mainstream economists as Larry Summers and Paul Krugman
categorically reject RBC theory in turn:
It is a common misconception that RBC theories are purely based on shocks to supply, as opposed to Keynesian theories, which are based on shocks to demand, and this leads to the common criticism of RBC theories as ignoring the demand side of the economy. However, technology-based theories of real business cycles also imply that consumers will change their intertemporal consumption and savings decisions based on the real interest rate available to them, which is a shift in demand. Other RBC theories based on preferences implicate the demand side to an even greater extent (Plosser, 1989). Intuitively, as a market-clearing model, RBC theories do not fall clearly into either a demand-side theory or a supply-side theory as Say's law
will hold in these theories and supply and demand will automatically move together.
By way of specific criticism of RBC theory as advanced by Prescott, lists four:
Business cycle
The term business cycle refers to economy-wide fluctuations in production or economic activity over several months or years...
fluctuations to a large extent can be accounted for by real (in contrast to nominal) shocks
Shock (economics)
In economics a shock is an unexpected or unpredictable event that affects an economy, either positively or negatively. Technically, it refers to an unpredictable change in exogenous factors—that is, factors unexplained by economics—which may have an impact on endogenous economic variables.The...
. Unlike other leading theories of the business cycle, RBC theory sees recessions and periods of economic growth
Economic growth
In economics, economic growth is defined as the increasing capacity of the economy to satisfy the wants of goods and services of the members of society. Economic growth is enabled by increases in productivity, which lowers the inputs for a given amount of output. Lowered costs increase demand...
as the efficient response to exogenous
Exogenous
Exogenous refers to an action or object coming from outside a system. It is the opposite of endogenous, something generated from within the system....
changes in the real economic environment. That is, the level of national output necessarily maximizes expected utility, and government should therefore concentrate on the long-run structural policy changes and not intervene through discretionary fiscal
Fiscal policy
In economics and political science, fiscal policy is the use of government expenditure and revenue collection to influence the economy....
or monetary policy
Monetary policy
Monetary policy is the process by which the monetary authority of a country controls the supply of money, often targeting a rate of interest for the purpose of promoting economic growth and stability. The official goals usually include relatively stable prices and low unemployment...
designed to actively smooth out economic short-term fluctuations.
According to RBC theory, business cycles are therefore "real" in that they do not represent a failure of markets to clear
Market clearing
In economics, market clearing refers to either# a simplifying assumption made by the new classical school that markets always go to where the quantity supplied equals the quantity demanded; or# the process of getting there via price adjustment....
but rather reflect the most efficient possible operation of the economy, given the structure of the economy. RBC theory differs in this way from other theories of the business cycle such as Keynesian economics
Keynesian economics
Keynesian economics is a school of macroeconomic thought based on the ideas of 20th-century English economist John Maynard Keynes.Keynesian economics argues that private sector decisions sometimes lead to inefficient macroeconomic outcomes and, therefore, advocates active policy responses by the...
and Monetarism
Monetarism
Monetarism is a tendency in economic thought that emphasizes the role of governments in controlling the amount of money in circulation. It is the view within monetary economics that variation in the money supply has major influences on national output in the short run and the price level over...
that see recessions as the failure of some market to clear.
RBC theory is associated with freshwater economics (the Chicago school of economics in the neoclassical
Neoclassical economics
Neoclassical economics is a term variously used for approaches to economics focusing on the determination of prices, outputs, and income distributions in markets through supply and demand, often mediated through a hypothesized maximization of utility by income-constrained individuals and of profits...
tradition).
Business cycles
If we were to take snapshots of an economy at different points in time, no two photos would look alike. This occurs for two reasons:- Many advanced economies exhibit sustained growth over time. That is, snapshots taken many years apart will most likely depict higher levels of economic activity in the later period.
- There exist seemingly random fluctuations around this growth trend. Thus given two snapshots in time, predicting the latter with the earlier is nearly impossible.

Figure 1 shows the time series of real GNP for the United States from 1954-2005. While we see continuous growth of output, it is not a steady increase. There are times of faster growth and times of slower growth. Figure 2 transforms these levels into growth rates of real GNP and extracts a smoother growth trend. A common method to obtain this trend is the Hodrick-Prescott filter
Hodrick-Prescott filter
The Hodrick–Prescott filter is a mathematical tool used in macroeconomics, especially in real business cycle theory to separate the cyclical component of a time series from raw data. It is used to obtain a smoothed-curve representation of a time series, one that is more sensitive to long-term than...
. The basic idea is to find a balance between the extent to which general growth trend follows the cyclical movement (since long term growth rate is not likely to be perfectly constant) and how smooth it is. The HP filter identifies the longer term fluctuations as part of the growth trend while classifying the more jumpy fluctuations as part of the cyclical component.


At a glance, the deviations just look like a string of waves bunched together—nothing about it appears consistent. To explain causes of such fluctuations may appear rather difficult given these irregularities. However, if we consider other macroeconomic variables, we will observe patterns in these irregularities. For example, consider Figure 4 which depicts fluctuations in output and consumption spending, i.e. what people buy and use at any given period. Observe how the peaks and troughs align at almost the same places and how the upturns and downturns coincide.


Stylized facts
By eyeballing the data, we can infer several regularities, sometimes called stylized factsStylized facts
In social sciences, especially economics, a stylized fact is a simplified presentation of an empirical finding. A stylized fact is often a broad generalization that summarizes some complicated statistical calculations, which although essentially true may have inaccuracies in the detail.A prominent...
. One is persistence. For example, if we take any point in the series above the trend (the x-axis in figure 3), the probability the next period is still above the trend is very high. However, this persistence wears out over time. That is, economic activity in the short run is quite predictable but due to the irregular long-term nature of fluctuations, forecasting in the long run is much more difficult if not impossible.
Another regularity is cyclical variability. Column A of Table 1 lists a measure of this with standard deviations. The magnitude of fluctuations in output and hours worked are nearly equal. Consumption and productivity are similarly much smoother than output while investment fluctuates much more than output. Capital stock is the least volatile of the indicators.

Correlation
In statistics, dependence refers to any statistical relationship between two random variables or two sets of data. Correlation refers to any of a broad class of statistical relationships involving dependence....
s as listed in column B of Table 1. Procyclical variables have positive correlations since it usually increases during booms and decreases during recessions. Vice versa, a countercyclical
Countercyclical
Countercyclical is a term used in economics to describe how an economic quantity is related to economic fluctuations. It is the opposite of procyclical. However, it has more than one meaning.-Meaning in policy making:...
variable associates with negative correlations. Acyclical, correlations close to zero, implies no systematic relationship to the business cycle. We find that productivity is slightly procyclical. This implies workers and capital are more productive when the economy is experiencing a boom. They aren’t quite as productive when the economy is experiencing a slowdown. Similar explanations follow for consumption and investment, which are strongly procyclical. Labor is also procyclical while capital stock appears acyclical.
Observing these similarities yet seemingly non-deterministic fluctuations about trend, we come to the burning question of why any of this occurs. It’s common sense that people prefer economic booms over recessions. It follows that if all people in the economy make optimal decisions, these fluctuations are caused by something outside the decision-making process. So the key question really is: what main factor influences and subsequently changes the decisions of all actors in an economy?
Real business cycle theory
Economists have come up with many ideas to answer the above question. The one which currently dominates the academic literature on real business cycle theory was introduced by Finn E. KydlandFinn E. Kydland
Finn Erling Kydland is a Norwegian economist. He is currently the Henley Professor of Economics at the University of California, Santa Barbara. He also holds the Richard P...
and Edward C. Prescott
Edward C. Prescott
Edward Christian Prescott is an American economist. He received the Nobel Memorial Prize in Economics in 2004, sharing the award with Finn E. Kydland, "for their contributions to dynamic macroeconomics: the time consistency of economic policy and the driving forces behind business cycles"...
in their seminal 1982 work Time to Build And Aggregate Fluctuations. They envisioned this factor to be technological shocks i.e., random fluctuations in the productivity level that shifted the constant growth trend up or down. Examples of such shocks include innovations, bad weather, imported oil price increase, stricter environmental and safety regulations, etc. The general gist is that something occurs that directly changes the effectiveness of capital and/or labour. This in turn affects the decisions of workers and firms, who in turn change what they buy and produce and thus eventually affect output. RBC models predict time sequences of allocation for consumption, investment, etc. given these shocks.
But exactly how do these productivity shocks cause ups and downs in economic activity? Let’s consider a positive but temporary shock to productivity. This momentarily increases the effectiveness of workers and capital, allowing a given level of capital and labor to produce more output.
Individuals face two types of tradeoffs. One is the consumption-investment decision. Since productivity is higher, people have more output to consume. An individual might choose to consume all of it today. But if he values future consumption, all that extra output might not be worth consuming in its entirety today. Instead, he may consume some but invest the rest in capital to enhance production in subsequent periods and thus increase future consumption. This explains why investment spending is more volatile than consumption. The life cycle hypothesis argues that households base their consumption decisions on expected lifetime income and so they prefer to “smooth” consumption over time. They will thus save (and invest) in periods of high income and defer consumption of this to periods of low income.
The other decision is the labor-leisure tradeoff. Higher productivity encourages substitution of current work for future work since workers will earn more per hour today compared to tomorrow. More labor and less leisure results in higher output today. greater consumption and investment today. On the other hand, there is an opposing effect: since workers are earning more, they may not want to work as much today and in future periods. However, given the pro-cyclical nature of labor, it seems that the above “substitution effect” dominates this “income effect”.
Overall, the basic RBC model predicts that given a temporary shock, output, consumption, investment and labor all rise above their long-term trends and hence formulate into a positive deviation. Furthermore, since more investment means more capital is available for the future, a short-lived shock may have an impact in the future. That is, above-trend behavior may persist for some time even after the shock disappears. This capital accumulation is often referred to as an internal “propagation mechanism”, since it may increase the persistence of shocks to output.
It is easy to see that a string of such productivity shocks will likely result in a boom. Similarly, recessions follow a string of bad shocks to the economy. If there were no shocks, the economy would just continue following the growth trend with no business cycles.
Essentially this is how the basic RBC model qualitatively explains key business cycle regularities. Yet any good model should also generate business cycles that quantitatively match the stylized facts in Table 1, our empirical benchmark. Kydland and Prescott introduced calibration techniques to do just this. The reason why this theory is so celebrated today is that using this methodology, the model closely mimics many business cycle properties. Yet current RBC models have not fully explained all behavior and neoclassical economists are still searching for better variations.
It is important to note the main assumption in RBC theory is that individuals and firms respond optimally all the time. In other words, if the government came along and forced people to work more or less than they would have otherwise, it would most likely make people unhappy. It follows that business cycles exhibited in an economy are chosen in preference to no business cycles at all. This is not to say that people like to be in a recession. Slumps are preceded by an undesirable productivity shock which constrains the situation. But given these new constraints, people will still achieve the best outcomes possible and markets will react efficiently. So when there is a slump, people are choosing to be in that slump because given the situation, it is the best solution. This suggests laissez-faire (non-intervention) is the best policy of government towards the economy but given the abstract nature of the model, this has been debated.
A pre-cursor to RBC theory was developed by monetary economists Milton Friedman and Robert Lucas in the early 1970s. They envisioned the factor that influenced people’s decisions to be misperception of wages—that booms/recessions occurred when workers perceived wages higher/lower than they really were. This meant they worked and consumed more/less than otherwise. In a world of perfect information, there would be no booms or recessions.
Calibration
Unlike estimationEstimation
Estimation is the calculated approximation of a result which is usable even if input data may be incomplete or uncertain.In statistics,*estimation theory and estimator, for topics involving inferences about probability distributions...
, which is usually used for the construction of economic models, calibration only returns to the drawing board to change the model in the face of overwhelming evidence against the model being correct; this inverts the burden of proof away from the builder of the model. In fact, simply stated, it is the process of changing the model to fit the data. Since RBC models explain data ex post, it is very difficult to falsify any one model that could be hypothesised to explain the data. RBC models are highly sample specific, leading some to believe that they have little or no predictive power.
Structural variables
Crucial to RBC models, "plausible values" for structural variables such as the discount rate, and the rate of capital depreciation are used in the creation of simulated variable paths. These tend to be estimated from econometric studies, with 95% confidence intervals. If the full range of possible values for these variables is used, correlation coefficients between actual and simulated paths of economic variables can shift wildly, leading some to question how successful a model which only achieves a coefficient of 80% really is.Criticisms
Real business cycle theory is a major point of contention within macroeconomicsMacroeconomics
Macroeconomics is a branch of economics dealing with the performance, structure, behavior, and decision-making of the whole economy. This includes a national, regional, or global economy...
: RBC theory categorically rejects Keynesian economics
Keynesian economics
Keynesian economics is a school of macroeconomic thought based on the ideas of 20th-century English economist John Maynard Keynes.Keynesian economics argues that private sector decisions sometimes lead to inefficient macroeconomic outcomes and, therefore, advocates active policy responses by the...
and real effectiveness of monetarism
Monetarism
Monetarism is a tendency in economic thought that emphasizes the role of governments in controlling the amount of money in circulation. It is the view within monetary economics that variation in the money supply has major influences on national output in the short run and the price level over...
, which are the pillars of mainstream
Mainstream economics
Mainstream economics is a loose term used to refer to widely-accepted economics as taught in prominent universities and in contrast to heterodox economics...
macroeconomic policy, while such noted mainstream economists as Larry Summers and Paul Krugman
Paul Krugman
Paul Robin Krugman is an American economist, professor of Economics and International Affairs at the Woodrow Wilson School of Public and International Affairs at Princeton University, Centenary Professor at the London School of Economics, and an op-ed columnist for The New York Times...
categorically reject RBC theory in turn:
- "(My view is that) real business cycle models of the type urged on us by [Ed] Prescott have nothing to do with the business cycle phenomena observed in the United States or other capitalist economies." –
It is a common misconception that RBC theories are purely based on shocks to supply, as opposed to Keynesian theories, which are based on shocks to demand, and this leads to the common criticism of RBC theories as ignoring the demand side of the economy. However, technology-based theories of real business cycles also imply that consumers will change their intertemporal consumption and savings decisions based on the real interest rate available to them, which is a shift in demand. Other RBC theories based on preferences implicate the demand side to an even greater extent (Plosser, 1989). Intuitively, as a market-clearing model, RBC theories do not fall clearly into either a demand-side theory or a supply-side theory as Say's law
Say's law
Say's law, or the law of market, is an economic principle of classical economics named after the French businessman and economist Jean-Baptiste Say , who stated that "products are paid for with products" and "a glut can take place only when there are too many means of production applied to one kind...
will hold in these theories and supply and demand will automatically move together.
By way of specific criticism of RBC theory as advanced by Prescott, lists four:
- Prescott uses incorrect parameters (one third of household time devoted to market activity rather than one sixth; historical real interest rates of 4% rather than 1%);
- absence of independent evidence for the technology shocks that supposedly cause the business cycle, and notably being unable to point to technological causes of observed recessions;
- Prescott's models ignore prices, and its predictions on asset prices are rejected by 100 years of data by Prescott's own work;
- Prescott ignores exchange failures (e.g., failures of factories to trade their goods for workers' labor), which are central to Keynesian accounts of the causes of the Great DepressionGreat DepressionThe Great Depression was a severe worldwide economic depression in the decade preceding World War II. The timing of the Great Depression varied across nations, but in most countries it started in about 1929 and lasted until the late 1930s or early 1940s...
, among other crises.
See also
- Austrian business cycle theory
- Business cycleBusiness cycleThe term business cycle refers to economy-wide fluctuations in production or economic activity over several months or years...
- Welfare cost of business cyclesWelfare cost of business cyclesIn macroeconomics, the welfare cost of business cycles refers to the decrease in social welfare, if any, caused by business cycle fluctuations....
- Lucas critiqueLucas critiqueThe Lucas critique, named for Robert Lucas′ work on macroeconomic policymaking, argues that it is naïve to try to predict the effects of a change in economic policy entirely on the basis of relationships observed in historical data, especially highly aggregated historical data.The basic idea...
- Monetary-disequilibrium theory
- Dynamic stochastic general equilibriumDynamic stochastic general equilibriumDynamic stochastic general equilibrium modeling is a branch of applied general equilibrium theory that is influential in contemporary macroeconomics...
- New classical economics
- New Keynesian economicsNew Keynesian economicsNew Keynesian economics is a school of contemporary macroeconomics that strives to provide microeconomic foundations for Keynesian economics. It developed partly as a response to criticisms of Keynesian macroeconomics by adherents of New Classical macroeconomics.Two main assumptions define the New...
- Say's lawSay's lawSay's law, or the law of market, is an economic principle of classical economics named after the French businessman and economist Jean-Baptiste Say , who stated that "products are paid for with products" and "a glut can take place only when there are too many means of production applied to one kind...

