

Productivity
Encyclopedia
Productivity is a measure of the efficiency of production. Productivity is a ratio of what is produced to what is required to produce it. Usually this ratio is in the form of an average, expressing the total output divided by the total input. Productivity is a measure of output from a production process, per unit of input.
At the national level, productivity growth raises living standards because more real income improves people's ability to purchase goods and services, enjoy leisure, improve housing and education and contribute to social and environmental programs. Productivity growth is important to the firm because it means that the firm can meet its (perhaps growing) obligations to customers, suppliers, workers, shareholders, and governments (taxes and regulation), and still remain competitive or even improve its competitiveness in the market place.
 Production is a process of combining various material inputs and immaterial inputs (plans, know-how) in order to make something for consumption (the output). The methods of combining the inputs of production in the process of making output are called technology. Technology can be depicted mathematically by the production function which describes the relation between input and output. The production function can be used as a measure of relative performance when comparing technologies.
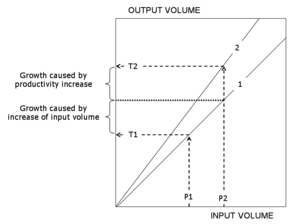
The production function is a simple description of the mechanism of economic growth. Economic growth is defined as any production increase of a business or nation (whatever you are measuring). It is usually expressed as an annual growth percentage depicting growth of the company output (per entity) or the national product (per nation). Real economic growth (as opposed to inflation) consists of two components. These components are an increase in production input and an increase in productivity.
The figure illustrates an economic growth process (exaggerated for clarity). The Value T2 (value at time 2) represents the growth in output from Value T1 (value at time 1). Each time of measurement has its own graph of the production function for that time (the straight lines). The output measured at time 2 is greater than the output measured at time one for both of the components of growth: an increase of inputs and an increase of productivity. The portion of growth caused by the increase in inputs is shown on line 1 and does not change the relation between inputs and outputs. The portion of growth caused by an increase in productivity is shown on line 2 with a steeper slope. So increased productivity represents greater output per unit of input.
Accordingly, an increase in productivity is characterised by a shift of the production function (steepening slope) and a consequent change to the output/input relation. The formula of total productivity is normally written as follows:
According to this formula, changes in input and output have to be measured inclusive of both quantitative and qualitative changes. In practice, quantitative and qualitative changes take place when relative quantities and relative prices of different input and output factors alter. In order to accentuate qualitative changes in output and input, the formula of total productivity shall be written as follows:
Productivity is created in the real process, productivity gains are distributed in the income distribution process and these two processes constitute the production process. The production process and its sub-processes, the real process and income distribution process occur simultaneously, and only the production process is identifiable and measurable by the traditional accounting practices. The real process and income distribution process can be identified and measured by extra calculation, and this is why they need to be analysed separately in order to understand the logic of production performance.
Real process generates the production output from input, and it can be described by means of the production function. It refers to a series of events in production in which production inputs of different quality and quantity are combined into products of different quality and quantity. Products can be physical goods, immaterial services and most often combinations of both. The characteristics created into the product by the manufacturer imply surplus value to the consumer, and on the basis of the price this value is shared by the consumer and the producer in the marketplace. This is the mechanism through which surplus value originates to the consumer and the producer likewise. Surplus value to the producer is a result of the real process, real income, and measured proportionally it means productivity.
Income distribution process of the production refers to a series of events in which the unit prices of constant-quality products and inputs alter causing a change in income distribution among those participating in the exchange. The magnitude of the change in income distribution is directly proportionate to the change in prices of the output and inputs and to their quantities. Productivity gains are distributed, for example, to customers as lower product sales prices or to staff as higher income pay.
Davis has deliberated the phenomenon of productivity, measurement of productivity, distribution of productivity gains, and how to measure such gains. He refers to an article suggesting that the measurement of productivity shall be developed so that it ”will indicate increases or decreases in the productivity of the company and also the distribution of the ’fruits of production’ among all parties at interest”. According to David, the price system is a mechanism through which productivity gains are distributed, and besides the business enterprise, receiving parties may consist of its customers, staff and the suppliers of production inputs. In this article, the concept of ”distribution of the fruits of production” by Davis is simply referred to as production income distribution or shorter still as distribution.
The production process consists of the real process and the income distribution process. A result and a criterion of success of the production process is profitability. The profitability of production is the share of the real process result the producer has been able to keep to himself in the income distribution process. Factors describing the production process are the components of profitability, i.e., returns and costs. They differ from the factors of the real process in that the components of profitability are given at nominal prices whereas in the real process the factors are at periodically fixed prices.
Monetary process refers to events related to financing the business. Market value process refers to a series of events in which investors determine the market value of the company in the investment markets.
The table presents a surplus value calculation. This basic example is a simplified profitability calculation used for illustration and modelling. Even as reduced, it comprises all phenomena of a real measuring situation and most importantly the change in the output-input mix between two periods. Hence, the basic example works as an illustrative “scale model” of production without any features of a real measuring situation being lost. In practice, there may be hundreds of products and inputs but the logic of measuring does not differ from that presented in the basic example.
Both the absolute and relative surplus value have been calculated in the example. Absolute value is the difference of the output and input values and the relative value is their relation, respectively. The surplus value calculation in the example is at a nominal price, calculated at the market price of each period.
by help of which it is possible to calculate the results of the real process, income distribution process and production process. The starting point is a profitability calculation using surplus value as a criterion of profitability. The surplus value calculation is the only valid measure for understanding the connection between profitability and productivity or understanding the connection between real process and production process. A valid measurement of total productivity necessitates considering all production inputs, and the surplus value calculation is the only calculation to conform to the requirement.
The process of calculating is best understood by applying the term ceteris paribus, i.e. "all other things being the same," stating that at a time only the impact of one changing factor be introduced to the phenomenon being examined. Therefore, the calculation can be presented as a process advancing step by step. First, the impacts of the income distribution process are calculated, and then, the impacts of the real process on the profitability of the production.
The first step of the calculation is to separate the impacts of the real process and the income distribution process, respectively, from the change in profitability (285.12 – 266.00 = 19.12). This takes place by simply creating one auxiliary column (4) in which a surplus value calculation is compiled using the quantities of Period 1 and the prices of Period 2. In the resulting profitability calculation, Columns 3 and 4 depict the impact of a change in income distribution process on the profitability and in Columns 4 and 7 the impact of a change in real process on the profitability.
The nine most central key figures depicting changes in production performance can be presented as shown in Figure. Vertical lines depict the key figures of the real process, production process and income distribution process. Key figures in the production process are a result of the real process and the income distribution process. Horizontal lines show the changes in input and output processes and their impact on profitability. The logic behind the figure is simple. Squares in the corners refer to initial calculation data. Profitability figures are obtained by dividing the output figures by the input figures in each process. After this, the production process figures are obtained by multiplying the figures of the real and income distribution process.
Now the intention is to draw up the time series for the ten periods in order to express the annual profitability of production by help of productivity and income distribution development. With the time series it is possible to prove that productivity of the real process is the distributable result of production, and profitability is the share remaining in the company after income distribution between the company and interested parties participating in the exchange.
The graph shows how profitability depends on the development of productivity and income distribution. Productivity figures are fictional but in practice they are perfectly feasible indicating an annual growth of 1.5 per cent on average. Growth potentials in productivity vary greatly by industry, and as a whole, they are directly proportionate to the technical development in the branch. Fast-developing industries attain stronger growth in productivity. This is a traditional way of thinking. Today we understand that human and social capitals together with competition have a significant impact on productivity growth. In any case, productivity grows in small steps. By the accurate measurement of productivity, it is possible to appreciate these small changes and create an organisation culture where continuous improvement is a common value.
 Typical solutions of partial productivity are:
Single-factor productivity refers to the measurement of productivity that is a ratio of output and one input factor. A most well-known measure of single-factor productivity is the measure of output per work input, describing work productivity. Sometimes it is practical to employ the value added as output. Productivity measured in this way is called Value-added productivity. Also, productivity can be examined in cost accounting using Unit costs. Then it is mostly a question of exploiting data from standard cost accounting for productivity measurements. Efficiency ratios, which tell something about the ratio between the value produced and the sacrifices made for it, are available in large numbers. Managerial control ratio systems are composed of single measures which are interpreted in parallel with other measures related to the subject. Ratios may be related to any success factor of the area of responsibility, such as profitability, quality, position on the market, etc. Ratios may be combined to form one whole using simple rules, hence, creating a key figure system.
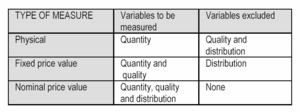
The measures of partial productivity are physical measures, nominal price value measures and fixed price value measures. These measures differ from one another by the variables they measure and by the variables excluded from measurements. By excluding variables from measurement makes it possible to better focus the measurement on a given variable, yet, this means a more narrow approach. The table below was compiled to compare the basic types of measurement. The first column presents the measure types, the second the variables being measured, and the third column gives the variables excluded from measurement.
is the ratio of (the real value of) output to the input of labor. Where possible, hours worked, rather than the numbers of employees, is used as the measure of labor input. Specifically, how many goods or services are produced within one working hour. With an increase in part-time employment, hours worked provides the more accurate measure of labor input. Labor productivity should be interpreted very carefully if used as a measure of efficiency. In particular, it reflects more than just the efficiency or productivity of workers. Labor productivity is the ratio of output to labor input; and output is influenced by many factors that are outside of workers' influence, including the nature and amount of capital equipment which is used to produce other commodities, introduction of new technologies, agricultural resources and management practices.
There is an inverse relationship between the demand for labor and the wage rate that a business needs to pay for each additional worker employed. When the wages per worker are less, then labor becomes relatively cheaper than for example using capital equipment and it becomes more profitable for the business to take on more employees.
is the ratio of the real value of output to the combined input of labor and capital. The Standard “neo-classical” labor market theory assumes that businesses seek to maximize profits. They will therefore search in the long run for the mix of factors of production (labor and capital) that produces the required level of output as efficiently as possible for the lowest possible total cost.Sometimes this measure is referred to as total factor productivity. In principle, multifactor productivity is a better indicator of efficiency. It measures how efficiently and effectively the main factors of production - labor and capital - combine to generate output. However, in some circumstances, robust measures of capital input can be hard to find.
Labor productivity and multifactor productivity have both increased over the long term. Usually, the growth in labor productivity exceeds the growth in multifactor productivity, reflecting the influence of the growth of capital relative to labor.
At a firm or industry level, the benefits of productivity growth can be distributed in a number of different ways:
Productivity growth is important to the firm because it means that it can meet its (perhaps growing) obligations to workers, shareholders, and governments (taxes and regulation), and still remain competitive or even improve its competitiveness in the market place.
There are essentially two ways to promote growth in output:
Adding more inputs will not increase the income earned per unit of input (unless there are increasing returns to scale). In fact, it is likely to mean lower average wages and lower rates of profit.
But, when there is productivity growth, even the existing commitment of resources generates more output and income. Income generated per unit of input increases. Additional resources are also attracted into production and can be profitably employed.
At the national level, productivity growth raises living standards because more real income improves people's ability to purchase goods and services (whether they are necessities or luxuries), enjoy leisure, improve housing and education and contribute to social and environmental programs.
‘Productivity isn't everything, but in the long run it is almost everything. A country's ability to improve its standard of living over time depends almost entirely on its ability to raise its output per worker. World War II veterans came home to an economy that doubled its productivity over the next 25 years; as a result, they found themselves achieving living standards their parents had never imagined. Vietnam veterans came home to an economy that raised its productivity less than 10 percent in 15 years; as a result, they found themselves living no better - and in many cases worse - than their parents’.
‘Over long periods of time, small differences in rates of productivity growth compound, like interest in a bank account, and can make an enormous difference to a society's prosperity. Nothing contributes more to reduction of poverty, to increases in leisure, and to the country's ability to finance education, public health, environment and the arts’.
Average productivity can improve as firms move toward the best available technology; plants and firms with poor productivity performance cease operation; and as new technologies become available. Firms can change organisational structures (e.g. core functions and supplier relationships), management systems and work arrangements to take the best advantage of new technologies and changing market opportunities. A nation's average productivity level can also be affected by the movement of resources from low-productivity to high-productivity industries and activities.
National productivity growth stems from a complex interaction of factors. As just outlined, some of the most important immediate factors include technological change, organisational change, industry restructuring and resource reallocation, as well as economies of scale and scope. Over time, other factors such as research and development and innovative effort, the development of human capital through education, and incentives from stronger competition promote the search for productivity improvements and the ability to achieve them. Ultimately, many policy, institutional and cultural factors determine a nation's success in improving productivity.
contains a list and discussion of several major technologies that have contributed to productivity since the industrial revolution. The article briefly describes improvements in living standards through the decline in hours worked and the increase in real wages.
. While productivity is the amount of output produced relative to the amount of resources (time and money) that go into the production, efficiency is the value of output relative to the cost of inputs used. Productivity improves when the quantity of output increases relative to the quantity of input. Efficiency improves when the cost of inputs used is reduced relative the value of output. A change in the price of inputs might lead a firm to change the mix of inputs used, in order to reduce the cost of inputs used, and improve efficiency, without actually increasing the quantity of output relative the quantity of inputs. A change in technology, however, might allow a firm to increase output with a given quantity of inputs; such an increase in productivity would be more technically efficient, but might not reflect any change in allocative efficiency.
The Ishikawa diagram
, and related business process modeling
, may be a useful tools for studying productivity. These methods list process inputs such as people, methods, machines, energy and materials and the environment.
and capital accumulation
. A new theory suggests that the increased contribution that productivity has on economic growth is largely due to the relatively high price of technology and its exportation via trade, as well as domestic use due to high demand, rather than attributing it to micro economic efficiency theories which tend to downsize economic growth and reduce labor productivity for the most part. Many economists see the economic expansion of the later 1990s in the United States as being allowed by the increase in worker productivity that occurred during that period. The growth in aggregate supply
allowed increases in aggregate demand
and decreases in unemployment
at the same time that inflation
remained stable. Others emphasize drastic changes in patterns of social behaviour resulting from new communication technologies and changed male-female relationships.
of labor, which refers to the increase in output that results from a corresponding increase in labor input. The qualitative aspects of labor productivity such as creativity, innovation, teamwork, improved quality of work and the effects on other areas in a company are more difficult to measure.
and information-technology (IT) productivity are linked, and that without improving knowledge work productivity, IT productivity does not have a governing mechanism.
At the national level, productivity growth raises living standards because more real income improves people's ability to purchase goods and services, enjoy leisure, improve housing and education and contribute to social and environmental programs. Productivity growth is important to the firm because it means that the firm can meet its (perhaps growing) obligations to customers, suppliers, workers, shareholders, and governments (taxes and regulation), and still remain competitive or even improve its competitiveness in the market place.
Economic growth and productivity
The production function is a simple description of the mechanism of economic growth. Economic growth is defined as any production increase of a business or nation (whatever you are measuring). It is usually expressed as an annual growth percentage depicting growth of the company output (per entity) or the national product (per nation). Real economic growth (as opposed to inflation) consists of two components. These components are an increase in production input and an increase in productivity.
The figure illustrates an economic growth process (exaggerated for clarity). The Value T2 (value at time 2) represents the growth in output from Value T1 (value at time 1). Each time of measurement has its own graph of the production function for that time (the straight lines). The output measured at time 2 is greater than the output measured at time one for both of the components of growth: an increase of inputs and an increase of productivity. The portion of growth caused by the increase in inputs is shown on line 1 and does not change the relation between inputs and outputs. The portion of growth caused by an increase in productivity is shown on line 2 with a steeper slope. So increased productivity represents greater output per unit of input.
Accordingly, an increase in productivity is characterised by a shift of the production function (steepening slope) and a consequent change to the output/input relation. The formula of total productivity is normally written as follows:
- Total productivity = Output quantity / Input quantity
According to this formula, changes in input and output have to be measured inclusive of both quantitative and qualitative changes. In practice, quantitative and qualitative changes take place when relative quantities and relative prices of different input and output factors alter. In order to accentuate qualitative changes in output and input, the formula of total productivity shall be written as follows:
- Total productivity = Output quality and quantity / Input quality and quantity
Main processes of a company
A company can be divided into sub-processes in different ways; yet, the following five are identified as main processes, each with a logic, objectives, theory and key figures of its own. It is important to examine each of them individually, yet, as a part of the whole, in order to be able to measure and understand them. The main processes of a company are as follows- real process
- income distribution process
- production process
- monetary process
- market value process
Productivity is created in the real process, productivity gains are distributed in the income distribution process and these two processes constitute the production process. The production process and its sub-processes, the real process and income distribution process occur simultaneously, and only the production process is identifiable and measurable by the traditional accounting practices. The real process and income distribution process can be identified and measured by extra calculation, and this is why they need to be analysed separately in order to understand the logic of production performance.
Real process generates the production output from input, and it can be described by means of the production function. It refers to a series of events in production in which production inputs of different quality and quantity are combined into products of different quality and quantity. Products can be physical goods, immaterial services and most often combinations of both. The characteristics created into the product by the manufacturer imply surplus value to the consumer, and on the basis of the price this value is shared by the consumer and the producer in the marketplace. This is the mechanism through which surplus value originates to the consumer and the producer likewise. Surplus value to the producer is a result of the real process, real income, and measured proportionally it means productivity.
Income distribution process of the production refers to a series of events in which the unit prices of constant-quality products and inputs alter causing a change in income distribution among those participating in the exchange. The magnitude of the change in income distribution is directly proportionate to the change in prices of the output and inputs and to their quantities. Productivity gains are distributed, for example, to customers as lower product sales prices or to staff as higher income pay.
Davis has deliberated the phenomenon of productivity, measurement of productivity, distribution of productivity gains, and how to measure such gains. He refers to an article suggesting that the measurement of productivity shall be developed so that it ”will indicate increases or decreases in the productivity of the company and also the distribution of the ’fruits of production’ among all parties at interest”. According to David, the price system is a mechanism through which productivity gains are distributed, and besides the business enterprise, receiving parties may consist of its customers, staff and the suppliers of production inputs. In this article, the concept of ”distribution of the fruits of production” by Davis is simply referred to as production income distribution or shorter still as distribution.
The production process consists of the real process and the income distribution process. A result and a criterion of success of the production process is profitability. The profitability of production is the share of the real process result the producer has been able to keep to himself in the income distribution process. Factors describing the production process are the components of profitability, i.e., returns and costs. They differ from the factors of the real process in that the components of profitability are given at nominal prices whereas in the real process the factors are at periodically fixed prices.
Monetary process refers to events related to financing the business. Market value process refers to a series of events in which investors determine the market value of the company in the investment markets.
Surplus value as a measure of production profitability
The scale of success run by a going concern is manifold, and there are no criteria that might be universally applicable to success. Nevertheless, there is one criterion by which we can generalise the rate of success in production. This criterion is the ability to produce surplus value. As a criterion of profitability, surplus value refers to the difference between returns and costs, taking into consideration the costs of equity in addition to the costs included in the profit and loss statement as usual. Surplus value indicates that the output has more value than the sacrifice made for it, in other words, the output value is higher than the value (production costs) of the used inputs. If the surplus value is positive, the owner’s profit expectation has been surpassed.The table presents a surplus value calculation. This basic example is a simplified profitability calculation used for illustration and modelling. Even as reduced, it comprises all phenomena of a real measuring situation and most importantly the change in the output-input mix between two periods. Hence, the basic example works as an illustrative “scale model” of production without any features of a real measuring situation being lost. In practice, there may be hundreds of products and inputs but the logic of measuring does not differ from that presented in the basic example.
Both the absolute and relative surplus value have been calculated in the example. Absolute value is the difference of the output and input values and the relative value is their relation, respectively. The surplus value calculation in the example is at a nominal price, calculated at the market price of each period.
Productivity model
The next step is to describe a productivity modelProductivity model
Productivity in economics is the ratio of what is produced to what is required to produce. Productivity is the measure on production efficiency. Productivity model is a measurement method which is used in practice for measuring productivity...
by help of which it is possible to calculate the results of the real process, income distribution process and production process. The starting point is a profitability calculation using surplus value as a criterion of profitability. The surplus value calculation is the only valid measure for understanding the connection between profitability and productivity or understanding the connection between real process and production process. A valid measurement of total productivity necessitates considering all production inputs, and the surplus value calculation is the only calculation to conform to the requirement.
The process of calculating is best understood by applying the term ceteris paribus, i.e. "all other things being the same," stating that at a time only the impact of one changing factor be introduced to the phenomenon being examined. Therefore, the calculation can be presented as a process advancing step by step. First, the impacts of the income distribution process are calculated, and then, the impacts of the real process on the profitability of the production.
The first step of the calculation is to separate the impacts of the real process and the income distribution process, respectively, from the change in profitability (285.12 – 266.00 = 19.12). This takes place by simply creating one auxiliary column (4) in which a surplus value calculation is compiled using the quantities of Period 1 and the prices of Period 2. In the resulting profitability calculation, Columns 3 and 4 depict the impact of a change in income distribution process on the profitability and in Columns 4 and 7 the impact of a change in real process on the profitability.
Illustration of the real and income distribution processes
Measurement results can be illustrated by models and graphic presentations. The following figure illustrates the connections between the processes by means of indexes describing the change. A presentation by means of an index is illustrative because the magnitudes of the changes are commensurate. Figures are from the above calculation example of the production model. (Loggerenberg van et al. 1982. Saari 2006).The nine most central key figures depicting changes in production performance can be presented as shown in Figure. Vertical lines depict the key figures of the real process, production process and income distribution process. Key figures in the production process are a result of the real process and the income distribution process. Horizontal lines show the changes in input and output processes and their impact on profitability. The logic behind the figure is simple. Squares in the corners refer to initial calculation data. Profitability figures are obtained by dividing the output figures by the input figures in each process. After this, the production process figures are obtained by multiplying the figures of the real and income distribution process.
Depicting the development by time series
Development in the real process, income distribution process and production process can be illustrated by means of time series. (Kendrick 1984, Saari 2006) The principle of a time series is to describe, for example, the profitability of production annually by means of a relative surplus value and also to explain how profitability was produced as a consequence of productivity development and income distribution. A time series can be composed using the chain indexes as seen in the following.Now the intention is to draw up the time series for the ten periods in order to express the annual profitability of production by help of productivity and income distribution development. With the time series it is possible to prove that productivity of the real process is the distributable result of production, and profitability is the share remaining in the company after income distribution between the company and interested parties participating in the exchange.
The graph shows how profitability depends on the development of productivity and income distribution. Productivity figures are fictional but in practice they are perfectly feasible indicating an annual growth of 1.5 per cent on average. Growth potentials in productivity vary greatly by industry, and as a whole, they are directly proportionate to the technical development in the branch. Fast-developing industries attain stronger growth in productivity. This is a traditional way of thinking. Today we understand that human and social capitals together with competition have a significant impact on productivity growth. In any case, productivity grows in small steps. By the accurate measurement of productivity, it is possible to appreciate these small changes and create an organisation culture where continuous improvement is a common value.
Measuring and interpreting partial productivity
Measurement of partial productivity refers to the measurement solutions which do not meet the requirements of total productivity measurement, yet, being practicable as indicators of total productivity. In practice, measurement in production means measures of partial productivity. In that case, the objects of measurement are components of total productivity, and interpreted correctly, these components are indicative of productivity development. The term of partial productivity illustrates well the fact that total productivity is only measured partially – or approximately. In a way, measurements are defective but, by understanding the logic of total productivity, it is possible to interpret correctly the results of partial productivity and to benefit from them in practical situations.- Single-factor productivity
- Value-added productivity
- Unit cost accounting
- Efficiency ratios
- Managerial control ratio system
Single-factor productivity refers to the measurement of productivity that is a ratio of output and one input factor. A most well-known measure of single-factor productivity is the measure of output per work input, describing work productivity. Sometimes it is practical to employ the value added as output. Productivity measured in this way is called Value-added productivity. Also, productivity can be examined in cost accounting using Unit costs. Then it is mostly a question of exploiting data from standard cost accounting for productivity measurements. Efficiency ratios, which tell something about the ratio between the value produced and the sacrifices made for it, are available in large numbers. Managerial control ratio systems are composed of single measures which are interpreted in parallel with other measures related to the subject. Ratios may be related to any success factor of the area of responsibility, such as profitability, quality, position on the market, etc. Ratios may be combined to form one whole using simple rules, hence, creating a key figure system.
The measures of partial productivity are physical measures, nominal price value measures and fixed price value measures. These measures differ from one another by the variables they measure and by the variables excluded from measurements. By excluding variables from measurement makes it possible to better focus the measurement on a given variable, yet, this means a more narrow approach. The table below was compiled to compare the basic types of measurement. The first column presents the measure types, the second the variables being measured, and the third column gives the variables excluded from measurement.
National productivity
Productivity measures are often used to indicate the capacity of a nation to harness its human and physical resources to generate economic growth. Productivity measures are key indicators of economic performance and there is strong interest in comparing them internationally. The OECDhttp://stats.oecd.org/Index.aspx?DataSetCode=LEVEL publishes an annual Compendium of Productivity Indicators that includes both labor and multi-factor measures of productivity. Economic analysts and policymakers also use this to see the trend of productivity. If there is an upward trend in productivity, this suggests the cots of living may rise.Labor Productivity
Labor productivityLabor productivity
Workforce productivity is the amount of goods and services that a worker produces in a given amount of time. It is one of several types of productivity that economists measure. Workforce productivity can be measured for a firm, a process, an industry, or a country...
is the ratio of (the real value of) output to the input of labor. Where possible, hours worked, rather than the numbers of employees, is used as the measure of labor input. Specifically, how many goods or services are produced within one working hour. With an increase in part-time employment, hours worked provides the more accurate measure of labor input. Labor productivity should be interpreted very carefully if used as a measure of efficiency. In particular, it reflects more than just the efficiency or productivity of workers. Labor productivity is the ratio of output to labor input; and output is influenced by many factors that are outside of workers' influence, including the nature and amount of capital equipment which is used to produce other commodities, introduction of new technologies, agricultural resources and management practices.
There is an inverse relationship between the demand for labor and the wage rate that a business needs to pay for each additional worker employed. When the wages per worker are less, then labor becomes relatively cheaper than for example using capital equipment and it becomes more profitable for the business to take on more employees.
Multifactor Productivity
Multifactor productivityMultifactor productivity
Multifactor productivity measures the changes in output per unit of combined inputs. In the United States, Indices of MFP are produced for the private business, private nonfarm business, and manufacturing sectors of the economy...
is the ratio of the real value of output to the combined input of labor and capital. The Standard “neo-classical” labor market theory assumes that businesses seek to maximize profits. They will therefore search in the long run for the mix of factors of production (labor and capital) that produces the required level of output as efficiently as possible for the lowest possible total cost.Sometimes this measure is referred to as total factor productivity. In principle, multifactor productivity is a better indicator of efficiency. It measures how efficiently and effectively the main factors of production - labor and capital - combine to generate output. However, in some circumstances, robust measures of capital input can be hard to find.
Labor productivity and multifactor productivity have both increased over the long term. Usually, the growth in labor productivity exceeds the growth in multifactor productivity, reflecting the influence of the growth of capital relative to labor.
Measures
There are programs to assist the productivity measurement process. The major sector productivity program publishes quarterly and annual measures of output per hour and unit labor costs for US business, non-farm business, and manufacturing. The other program is Industry Productivity, which publishes annual measures of output per hour and unit labor cost for US industries. These two programs produce labor productivity and cost measure for sectors of the US economy.Importance of national productivity growth
Productivity growth is a crucial source of growth in living standards. Productivity growth means more value is added in production and this means more income is available to be distributed.At a firm or industry level, the benefits of productivity growth can be distributed in a number of different ways:
- to the workforce through better wages and conditions;
- to shareholders and superannuation funds through increased profits and dividend distributions;
- to customers through lower prices;
- to the environment through more stringent environmental protection; and
- to governments through increases in tax payments (which can be used to fund social and environmental programs).
Productivity growth is important to the firm because it means that it can meet its (perhaps growing) obligations to workers, shareholders, and governments (taxes and regulation), and still remain competitive or even improve its competitiveness in the market place.
There are essentially two ways to promote growth in output:
- bring additional inputs into production; or
- increase productivity.
Adding more inputs will not increase the income earned per unit of input (unless there are increasing returns to scale). In fact, it is likely to mean lower average wages and lower rates of profit.
But, when there is productivity growth, even the existing commitment of resources generates more output and income. Income generated per unit of input increases. Additional resources are also attracted into production and can be profitably employed.
At the national level, productivity growth raises living standards because more real income improves people's ability to purchase goods and services (whether they are necessities or luxuries), enjoy leisure, improve housing and education and contribute to social and environmental programs.
‘Productivity isn't everything, but in the long run it is almost everything. A country's ability to improve its standard of living over time depends almost entirely on its ability to raise its output per worker. World War II veterans came home to an economy that doubled its productivity over the next 25 years; as a result, they found themselves achieving living standards their parents had never imagined. Vietnam veterans came home to an economy that raised its productivity less than 10 percent in 15 years; as a result, they found themselves living no better - and in many cases worse - than their parents’.
‘Over long periods of time, small differences in rates of productivity growth compound, like interest in a bank account, and can make an enormous difference to a society's prosperity. Nothing contributes more to reduction of poverty, to increases in leisure, and to the country's ability to finance education, public health, environment and the arts’.
Sources of productivity growth
In the most immediate sense, productivity is determined by:- the available technology or know-how for converting resources into outputs desired in an economy; and
- the way in which resources are organised in firms and industries to produce goods and services.
Average productivity can improve as firms move toward the best available technology; plants and firms with poor productivity performance cease operation; and as new technologies become available. Firms can change organisational structures (e.g. core functions and supplier relationships), management systems and work arrangements to take the best advantage of new technologies and changing market opportunities. A nation's average productivity level can also be affected by the movement of resources from low-productivity to high-productivity industries and activities.
National productivity growth stems from a complex interaction of factors. As just outlined, some of the most important immediate factors include technological change, organisational change, industry restructuring and resource reallocation, as well as economies of scale and scope. Over time, other factors such as research and development and innovative effort, the development of human capital through education, and incentives from stronger competition promote the search for productivity improvements and the ability to achieve them. Ultimately, many policy, institutional and cultural factors determine a nation's success in improving productivity.
Historical productivity - major sources of growth and effects on living standards
Productivity improving technologies (historical)Productivity improving technologies (historical)
Productivity improving technologies date back to antiquity, with rather slow progress until the late Middle Ages. Technological progress was aided by literacy and the diffusion of knowledge that accelerated after the spinning wheel spread to Western Europe in the 13th century...
contains a list and discussion of several major technologies that have contributed to productivity since the industrial revolution. The article briefly describes improvements in living standards through the decline in hours worked and the increase in real wages.
Productivity studies
Productivity studies analyze technical processes and engineering relationships such as how much of an output can be produced in a specified period of time (see also Taylorism). It is related to the concept of efficiencyEfficiency (economics)
In economics, the term economic efficiency refers to the use of resources so as to maximize the production of goods and services. An economic system is said to be more efficient than another if it can provide more goods and services for society without using more resources...
. While productivity is the amount of output produced relative to the amount of resources (time and money) that go into the production, efficiency is the value of output relative to the cost of inputs used. Productivity improves when the quantity of output increases relative to the quantity of input. Efficiency improves when the cost of inputs used is reduced relative the value of output. A change in the price of inputs might lead a firm to change the mix of inputs used, in order to reduce the cost of inputs used, and improve efficiency, without actually increasing the quantity of output relative the quantity of inputs. A change in technology, however, might allow a firm to increase output with a given quantity of inputs; such an increase in productivity would be more technically efficient, but might not reflect any change in allocative efficiency.
The Ishikawa diagram
Ishikawa diagram
Ishikawa diagrams are causal diagrams that show the causes of a certain event -- created by Kaoru Ishikawa . Common uses of the Ishikawa diagram are product design and quality defect prevention, to identify potential factors causing an overall effect...
, and related business process modeling
Business process modeling
Business Process Modeling in systems engineering is the activity of representing processes of an enterprise, so that the current process may be analyzed and improved. BPM is typically performed by business analysts and managers who are seeking to improve process efficiency and quality...
, may be a useful tools for studying productivity. These methods list process inputs such as people, methods, machines, energy and materials and the environment.
Increases in productivity
Companies can increase productivity in a variety of ways. The most obvious methods involve automation and computerization which minimize the tasks that must be performed by employees. Recently, less obvious techniques are being employed that involve ergonomic design and worker comfort. A comfortable employee, the theory maintains, can produce more than a counterpart who struggles through the day. Some studies suggest that measures such as raising workplace temperature has a drastic effect on office productivity. Experiments done by the Japanese Shiseido corporation also suggested that productivity could be increased by means of perfuming or deodorising the air conditioning system of workplaces. Increases in productivity also can influence society more broadly, by improving living standards, and creating income. They are central to the process generating economic growthEconomic growth
In economics, economic growth is defined as the increasing capacity of the economy to satisfy the wants of goods and services of the members of society. Economic growth is enabled by increases in productivity, which lowers the inputs for a given amount of output. Lowered costs increase demand...
and capital accumulation
Capital accumulation
The accumulation of capital refers to the gathering or amassing of objects of value; the increase in wealth through concentration; or the creation of wealth. Capital is money or a financial asset invested for the purpose of making more money...
. A new theory suggests that the increased contribution that productivity has on economic growth is largely due to the relatively high price of technology and its exportation via trade, as well as domestic use due to high demand, rather than attributing it to micro economic efficiency theories which tend to downsize economic growth and reduce labor productivity for the most part. Many economists see the economic expansion of the later 1990s in the United States as being allowed by the increase in worker productivity that occurred during that period. The growth in aggregate supply
Aggregate supply
In economics, aggregate supply is the total supply of goods and services that firms in a national economy plan on selling during a specific time period...
allowed increases in aggregate demand
Aggregate demand
In macroeconomics, aggregate demand is the total demand for final goods and services in the economy at a given time and price level. It is the amount of goods and services in the economy that will be purchased at all possible price levels. This is the demand for the gross domestic product of a...
and decreases in unemployment
Unemployment
Unemployment , as defined by the International Labour Organization, occurs when people are without jobs and they have actively sought work within the past four weeks...
at the same time that inflation
Inflation
In economics, inflation is a rise in the general level of prices of goods and services in an economy over a period of time.When the general price level rises, each unit of currency buys fewer goods and services. Consequently, inflation also reflects an erosion in the purchasing power of money – a...
remained stable. Others emphasize drastic changes in patterns of social behaviour resulting from new communication technologies and changed male-female relationships.
Labor productivity
Labor productivity is generally speaking held to be the same as the "average product of labor" (average output per worker or per worker-hour, an output which could be measured in physical terms or in price terms). It is not the same as the marginal productMarginal product
In economics and in particular neoclassical economics, the marginal product or marginal physical product of an input is the extra output that can be produced by using one more unit of the input , assuming that the quantities of no other inputs to production...
of labor, which refers to the increase in output that results from a corresponding increase in labor input. The qualitative aspects of labor productivity such as creativity, innovation, teamwork, improved quality of work and the effects on other areas in a company are more difficult to measure.
Productivity paradox
Despite the proliferation of computers, productivity growth was relatively slow from the 1970s through the early 1990s. One hypothesis to explain this is that computers are productive, yet their productive gains are realized only after a lag period, during which complementary capital investments must be developed to allow for the use of computers to their full potential. Another hypothesis states that computers are simply not very productivity-enhancing because they require time, a scarce complementary human input. This theory holds that although computers perform a variety of tasks, these tasks are not done in any particularly new or efficient manner, but rather they are only done faster. It has also been argued that computer automation just facilitates ever more complex bureaucracies and regulation, and therefore produces a net reduction in real productivity. Another explanation is that knowledge work productivityKnowledge work productivity
right|200px|Knowledge work productivity is the measure of the efficiency and effectiveness of the output generated by workers who mainly rely on knowledge, rather than labor, during the production process...
and information-technology (IT) productivity are linked, and that without improving knowledge work productivity, IT productivity does not have a governing mechanism.
See also
- Productivity modelProductivity modelProductivity in economics is the ratio of what is produced to what is required to produce. Productivity is the measure on production efficiency. Productivity model is a measurement method which is used in practice for measuring productivity...
- Production, costs, and pricingProduction, costs, and pricingThe following outline is provided as an overview of and topical guide to industrial organization:Industrial organization – describes the behavior of firms in the marketplace with regard to production, pricing, employment and other decisions...
- Production theory basicsProduction theory basicsProduction refers to the economic process of converting of inputs into outputs. Production uses resources to create a good or service that is suitable for use, gift-giving in a gift economy, or exchange in a market economy. This can include manufacturing, storing, shipping, and packaging. Some...
- Production possibility frontierProduction possibility frontierIn economics, a production–possibility frontier , sometimes called a production–possibility curve or product transformation curve, is a graph that compares the production rates of two commodities that use the same fixed total of the factors of production...
- Production functionProduction functionIn microeconomics and macroeconomics, a production function is a function that specifies the output of a firm, an industry, or an entire economy for all combinations of inputs...
- Computer-aided manufacturingComputer-aided manufacturingComputer-aided manufacturing is the use of computer software to control machine tools and related machinery in the manufacturing of workpieces. This is not the only definition for CAM, but it is the most common; CAM may also refer to the use of a computer to assist in all operations of a...
- Productive and unproductive labourProductive and unproductive labourProductive and unproductive labour were concepts used in classical political economy mainly in the 18th and 19th century, which survive today to some extent in modern management discussions, economic sociology and Marxist or Marxian economic analysis...
- Productive forcesProductive forcesProductive forces, "productive powers" or "forces of production" [in German, Produktivkräfte] is a central idea in Marxism and historical materialism....
- Productivity improving technologies (historical)Productivity improving technologies (historical)Productivity improving technologies date back to antiquity, with rather slow progress until the late Middle Ages. Technological progress was aided by literacy and the diffusion of knowledge that accelerated after the spinning wheel spread to Western Europe in the 13th century...
- Underinvestment employment relationship
- Division of labourDivision of labourDivision of labour is the specialisation of cooperative labour in specific, circumscribed tasks and likeroles. Historically an increasingly complex division of labour is closely associated with the growth of total output and trade, the rise of capitalism, and of the complexity of industrialisation...
- Mass productionMass productionMass production is the production of large amounts of standardized products, including and especially on assembly lines...
- Assembly lineAssembly lineAn assembly line is a manufacturing process in which parts are added to a product in a sequential manner using optimally planned logistics to create a finished product much faster than with handcrafting-type methods...
- Second Industrial RevolutionSecond Industrial RevolutionThe Second Industrial Revolution, also known as the Technological Revolution, was a phase of the larger Industrial Revolution corresponding to the latter half of the 19th century until World War I...
- Industrial RevolutionIndustrial RevolutionThe Industrial Revolution was a period from the 18th to the 19th century where major changes in agriculture, manufacturing, mining, transportation, and technology had a profound effect on the social, economic and cultural conditions of the times...
External links
- Productivity and Costs – Bureau of Labor Statistics United States Department of LaborUnited States Department of LaborThe United States Department of Labor is a Cabinet department of the United States government responsible for occupational safety, wage and hour standards, unemployment insurance benefits, re-employment services, and some economic statistics. Many U.S. states also have such departments. The...
: contains international comparisons of productivity rates, historical and present - Productivity Statistics - Organisation for Economic Co-operation and Development
- Greenspan Speech
- OECD estimates of labour productivity levels
- Productivity Enhancement Through Business Automation
- Productivity Science - source for personal and business productivity information
- Productivity Assessment Framework from Zinnov LLC